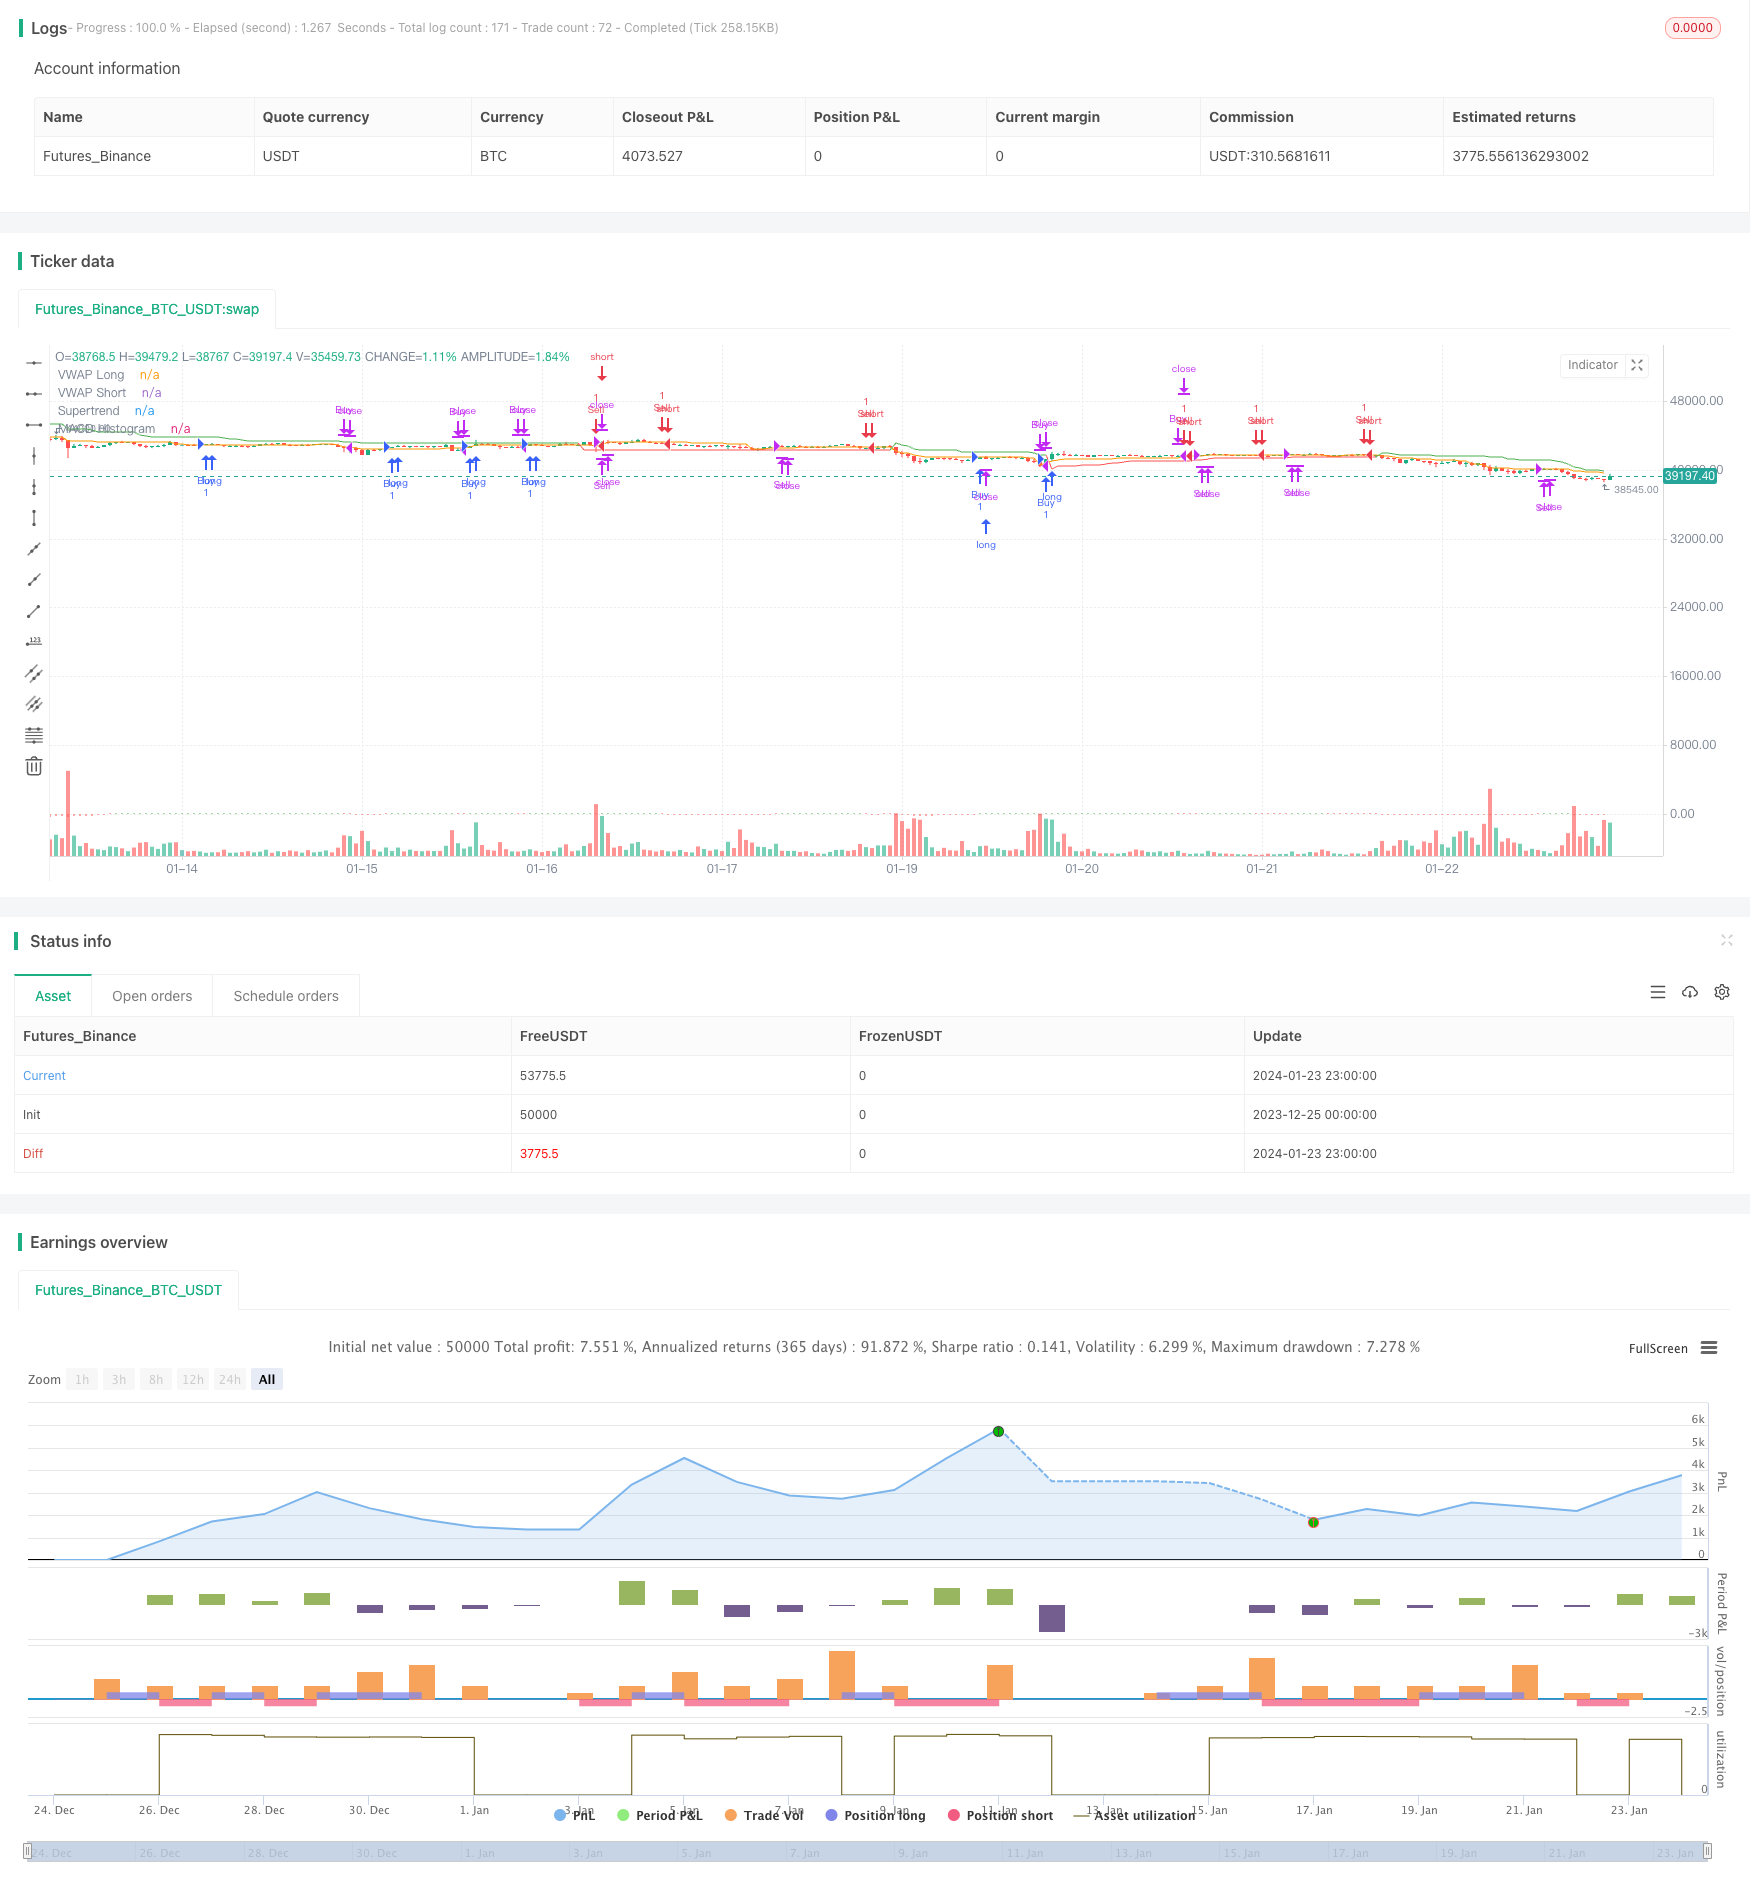
트렌드 확인 추적 전략
저자:차오장, 날짜: 2024-01-25 11:57:56태그:

전반적인 설명
전략 논리
입국 조건
트렌드 확인: 전략은 트렌드 방향을 확인하기 위해 슈퍼트렌드와 MACD를 모두 사용합니다. 이 두 가지 확인은 트렌드를 정확하게 식별하고 잘못된 신호를 필터링 할 가능성을 높일 수 있습니다.
출입 조건
MACD 크로스오버 (MACD Crossover): 이 전략은 MACD 라인이 신호 라인 아래를 넘을 때 긴 포지션을 닫고 MACD 라인이 위를 넘을 때 짧은 포지션을 닫습니다.
위험 관리
이점 분석
이중 지표 확인: 트렌드 확인을 위해 슈퍼 트렌드와 MACD의 조합은 신호 정확성을 향상시키기 위해 필터링 층을 추가하는 독특한 측면입니다.
부분 이윤 기록: MACD 크로스오버에 대해 부분 이윤 기록을 고려하는 제안은 거래에 머무는 동안 이윤을 확보 할 수 있습니다.
위험 분석
백테스팅: 다양한 시장 조건에서 성능을 이해하기 위해 실시간 배포 전에 모든 전략을 철저히 백테스팅합니다.
시장 조건: 어떤 전략도 모든 시장 조건에서 완벽하게 작동하지 않습니다. 유연하고 특히 변동적인 기간 동안 거래를 하지 마십시오.
모니터링: 자동화 된 구성 요소에도 불구하고 거래 및 시장 상황을 지속적으로 모니터링합니다.
적응력: 시장은 시간이 지남에 따라 진화합니다. 변화하는 역학에 맞추어 필요한 경우 전략을 조정할 준비가 되어 있습니다.
최적화 방향
부분 이익 취득: 특정 비율로 이익을 취득하는 것과 같은 더 확실한 부분 이익 취득 규칙을 포함합니다.
조건 최적화: 올바른 균형을 찾기 위해 특정 입력 또는 출력 규칙을 추가하거나 제거하는 테스트.
결론
이 전략은 트렌드를 확인하고 잠재적 진입 지점을 식별하기 위해 트렌드, 추진력 및 볼륨 지표를 결합하는 비교적 독특한 접근 방식을 제공합니다. 이중 확인 및 적응 중지와 같은 기능은 특정 장점을 제공합니다. 그러나 철저한 백테스팅, 최적화 및 모니터링은 모든 전략의 장기적 실현 가능성에 필수적입니다. 전략은 더 탐색하고 정제 할 가치가있는 프레임워크를 제공합니다.
/*backtest
start: 2023-12-25 00:00:00
end: 2024-01-24 00:00:00
period: 1h
basePeriod: 15m
exchanges: [{"eid":"Futures_Binance","currency":"BTC_USDT"}]
*/

//@version=5
strategy("Trend Confirmation Strategy", overlay=true)

// Supertrend Indicator
atrPeriod = input(10, "ATR Length")
factor = input.float(3.0, "Factor", step = 0.01)
[supertrend, direction] = ta.supertrend(factor, atrPeriod)

// MACD Indicator
fast_length = input(title="Fast Length", defval=12)
slow_length = input(title="Slow Length", defval=26)
macd_src = input(title="Source", defval=close)
signal_length = input.int(title="Signal Smoothing",  minval = 1, maxval = 50, defval = 9)
macd_sma_source = input.string(title="Oscillator MA Type",  defval="EMA", options=["SMA", "EMA"])
macd_sma_signal = input.string(title="Signal Line MA Type", defval="EMA", options=["SMA", "EMA"])

fast_ma = macd_sma_source == "SMA" ? ta.sma(macd_src, fast_length) : ta.ema(macd_src, fast_length)
slow_ma = macd_sma_source == "SMA" ? ta.sma(macd_src, slow_length) : ta.ema(macd_src, slow_length)
macd = fast_ma - slow_ma
signal = macd_sma_signal == "SMA" ? ta.sma(macd, signal_length) : ta.ema(macd, signal_length)

// VWAP Indicator
vwap_hideonDWM = input(false, title="Hide VWAP on 1D or Above")
vwap_src = input(title="VWAP Source", defval=hlc3)

vwap_value = ta.vwap(vwap_src)
vwap_value_long = vwap_value
vwap_value_short = vwap_value

// Entry Criteria
confirm_up_trend = direction > 0 and macd > signal
confirm_down_trend = direction < 0 and macd < signal

// VWAP Confirmation
price_above_vwap = close > vwap_value_long
price_below_vwap = close < vwap_value_short

// Stop Loss and Take Profit
stop_loss_range = input(2, title="Stop Loss Range")
trail_offset = input(0.5, title="Trailing Stop Offset")

stop_loss_long = close - stop_loss_range
stop_loss_short = close + stop_loss_range

// Strategy Entry
if not (vwap_hideonDWM and timeframe.isdwm)
    if confirm_up_trend and price_above_vwap
        strategy.entry("Buy", strategy.long)
    if confirm_down_trend and price_below_vwap
        strategy.entry("Sell", strategy.short)

// Strategy Exit
if macd < signal and macd[1] >= signal[1]
    strategy.close("Buy", comment="MACD Crossover")

if macd > signal and macd[1] <= signal[1]
    strategy.close("Sell", comment="MACD Crossover")

// Plot Supertrend and VWAP
plot(supertrend, color=direction > 0 ? color.green : color.red, title="Supertrend")
plot(vwap_value_long, color=color.blue, title="VWAP Long")
plot(vwap_value_short, color=color.orange, title="VWAP Short")

// Plot MACD Histogram
hist = macd - signal
hist_color = hist >= 0 ? color.green : color.red
plot(hist, style=plot.style_histogram, color=hist_color, title="MACD Histogram")
- 이중 기하급수적 이동 평균 크로스오버 알고리즘 거래 전략
- 다중 요인을 가진 양적 거래 전략
- 피어싱 핀 바 역전 전략
- RSI 인디케이터에 기반한 니프티 거래 전략
- RSI 및 EMA 기반 트렌드 다음 전략
- RSI 격차 지표 전략
- 모멘텀 이동 평균 통합 전략
- 트렌드 필터 기반의 빠른 QQE 크로스오버 거래 전략
- 적응적인 이동 평균 추적 전략
- 트렌드 역전 시장에서 스칼핑 전략
- 양방향 EMA 크로스 퀀트 거래 전략
- EMA 내일 스칼핑 전략
- 랜덤 엔트리에 기반한 종합 스톱 로스 및 영업 전략
- 대역 패스 필터 역전 전략
- 이중 이동 평균 크로스오버 거래 전략