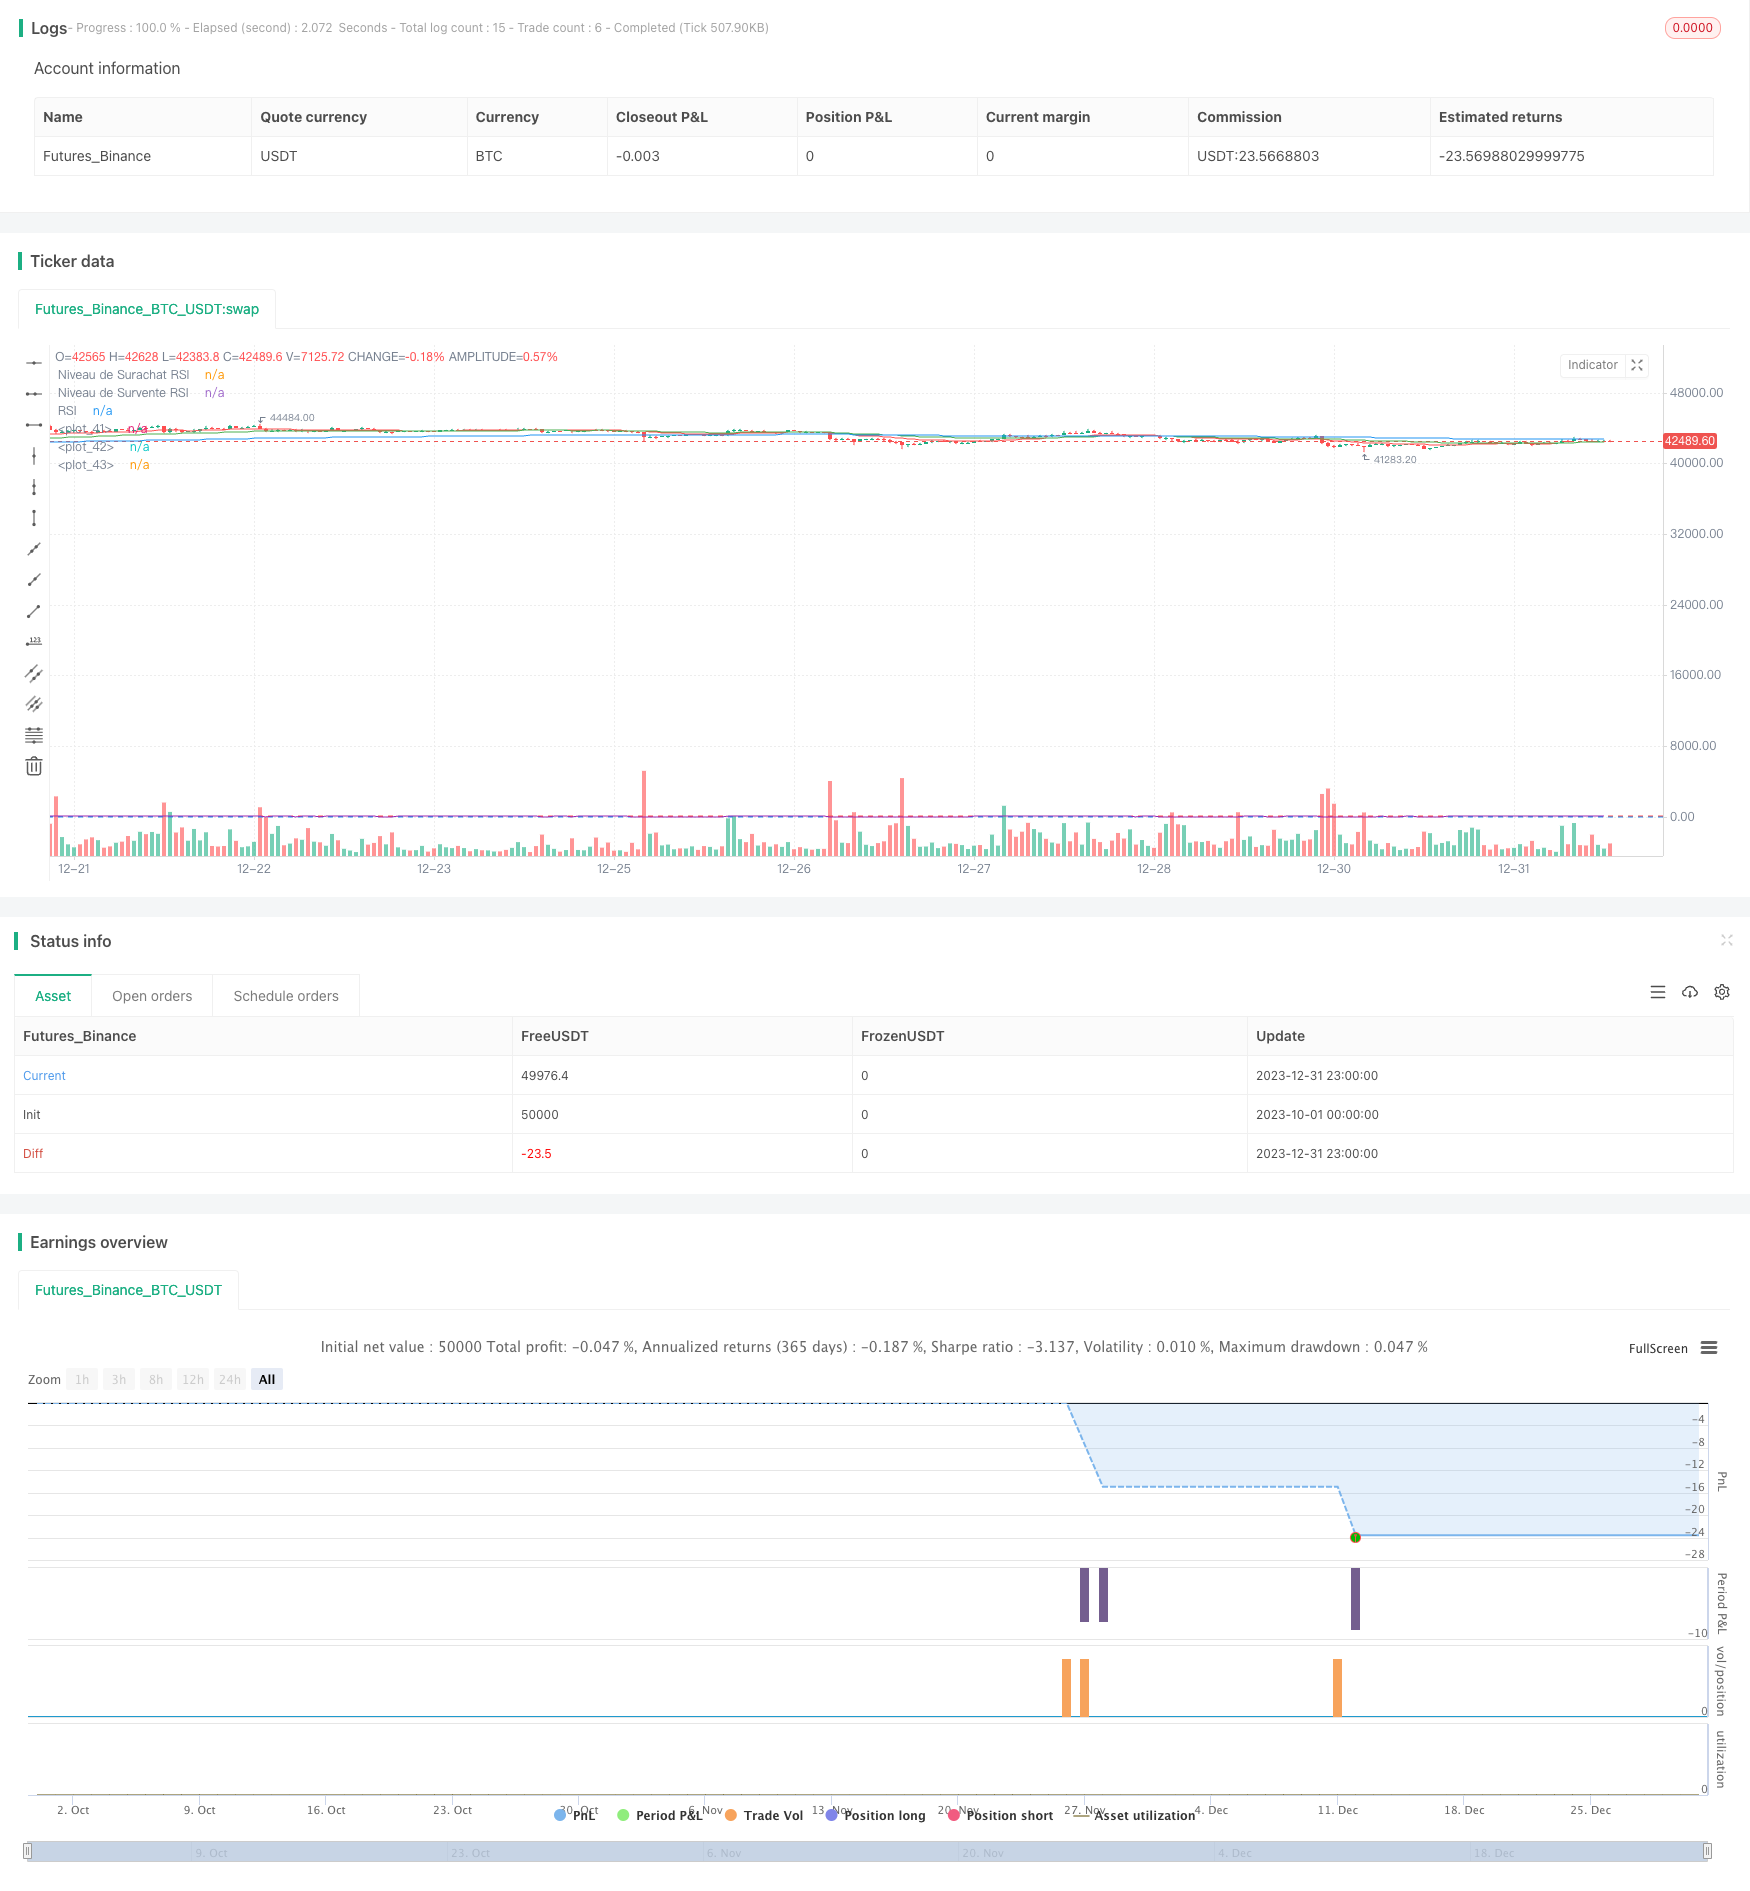
RSI 및 EMA 기반 트렌드 다음 전략
저자:차오장, 날짜: 2024-01-25 12:19:32태그:

전반적인 설명
이 전략은 트렌드를 따르는 것에 기반한 양적 거래 전략을 구현하기 위해 상대적 강도 지수 (RSI) 와 기하급수적 이동 평균 (EMA) 기술 지표를 결합합니다. 트렌드를 따르는 시장에 주로 적합하며, 트렌드에서 이익을 얻기 위해 가격 반전이 확인되면 진입합니다.
전략 논리
지표 선택
- 현재 트렌드 방향을 결정하기 위한 EMA. 전략은 20일, 50일 및 200일 EMA를 사용합니다. 가격이 이러한 EMA보다 높을 때 상승 추세가 확인됩니다.
- RSI는 과잉 구매/ 과잉 판매 수준을 식별합니다. 표준 14 기간 RSI, 과잉 구매 한계 70와 과잉 판매 한계 30입니다.
입국 규칙
장거리 입력 신호:
- RSI가 30 수준 이하로 떨어지면 가격이 상승할 수 있는 과잉판매 상황을 나타냅니다.
- 20일, 50일 또는 200일 EMA 이상의 가격, 상승 추세를 보이는 시장
두 가지 기준이 모두 충족되면, 긴 지위가 입력됩니다.
위험 관리
각 거래의 최대 손실은 전체 계정 가치의 3%로 제한됩니다.
입시 시 포지션 크기: 최대 손실 / (입시 가격 - 중지 손실 가격) = 포지션 크기
이것은 거래 리스크를 효과적으로 제어합니다.
출입규칙
주요 출구 신호:
- RSI가 70 수준을 넘어서면 과잉 매수 조건으로 인해 가격이 떨어질 수 있습니다.
- 가격 하락 20 일, 50 일 또는 200 일 EMA, 트렌드 역전
신호가 나오면 포지션이 종료됩니다.
이점 분석
거래당 최대 손실은 거래 위험 수준을 직접 제어함으로써 자본을 보호합니다.
위험 분석
스톱 손실 배치는 PnL에 매우 중요하며, 다른 시장에 대한 신중한 테스트가 필요합니다. 너무 넓으면 단일 손실이 확장 될 수 있습니다. 너무 좁으면 소음이 원치 않는 스톱을 유발할 수 있습니다. 지속적인 최적화를 위해 라이브 테스트가 필요합니다.
최적화 방향
다른 RSI 매개 변수를 테스트하여 더 많은 시장에 맞게합니다. 최적의 거래 크기 비율을 찾습니다. 더 강력한 입출시스템을 구축하기 위해 다른 기술적 지표를 추가합니다. 이것들은 모두 탐구 가치가있는 옵션입니다.
결론
/*backtest
start: 2023-10-01 00:00:00
end: 2023-12-31 23:59:59
period: 1h
basePeriod: 15m
exchanges: [{"eid":"Futures_Binance","currency":"BTC_USDT"}]
*/

//@version=4
strategy("Stratégie RSI et EMA avec Gestion du Risque", overlay=true)

// Paramètres de la stratégie
rsiLength = input(14, "Longueur du RSI")
rsiOverbought = input(70, "Niveau de Surachat RSI")
rsiOversold = input(30, "Niveau de Survente RSI")

// Calcul du RSI
rsiValue = rsi(close, rsiLength)

// Paramètres des EMA
ema20 = ema(close, 20)
ema50 = ema(close, 50)
ema200 = ema(close, 200)

// Paramètre du risque par trade
riskPerTrade = input(0.03, "Risque par Trade (3%)")

// Distance du stop-loss en pips (à ajuster selon votre stratégie)
stopLossPips = input(1, "Distance du Stop-Loss en pips")

// Calcul de la taille de position et du stop-loss
calculatePositionSize(entryPrice, stopLossPips) =>
    stopLossPrice = entryPrice - stopLossPips * syminfo.mintick
    riskPerTradeValue = strategy.equity * riskPerTrade
    positionSize = riskPerTradeValue / (entryPrice - stopLossPrice)
    positionSize

// Conditions d'entrée
longCondition = (rsiValue < rsiOversold) and (close > ema20 or close > ema50 or close > ema200)
if longCondition
    strategy.entry("Long", strategy.long, qty=1)

// Conditions de sortie
exitCondition = (rsiValue > rsiOverbought) or (close < ema20 or close < ema50 or close < ema200)
if exitCondition
    strategy.close("Long")

// Affichage des EMA et RSI sur le graphique
plot(ema20, color=color.red)
plot(ema50, color=color.green)
plot(ema200, color=color.blue)
hline(rsiOverbought, "Niveau de Surachat RSI", color=color.red)
hline(rsiOversold, "Niveau de Survente RSI", color=color.blue)
plot(rsiValue, "RSI", color=color.purple)
더 많은