재발동 모멘텀 거래 전략
저자:차오장, 날짜: 2024-01-31 16:56:31태그:

전반적인 설명
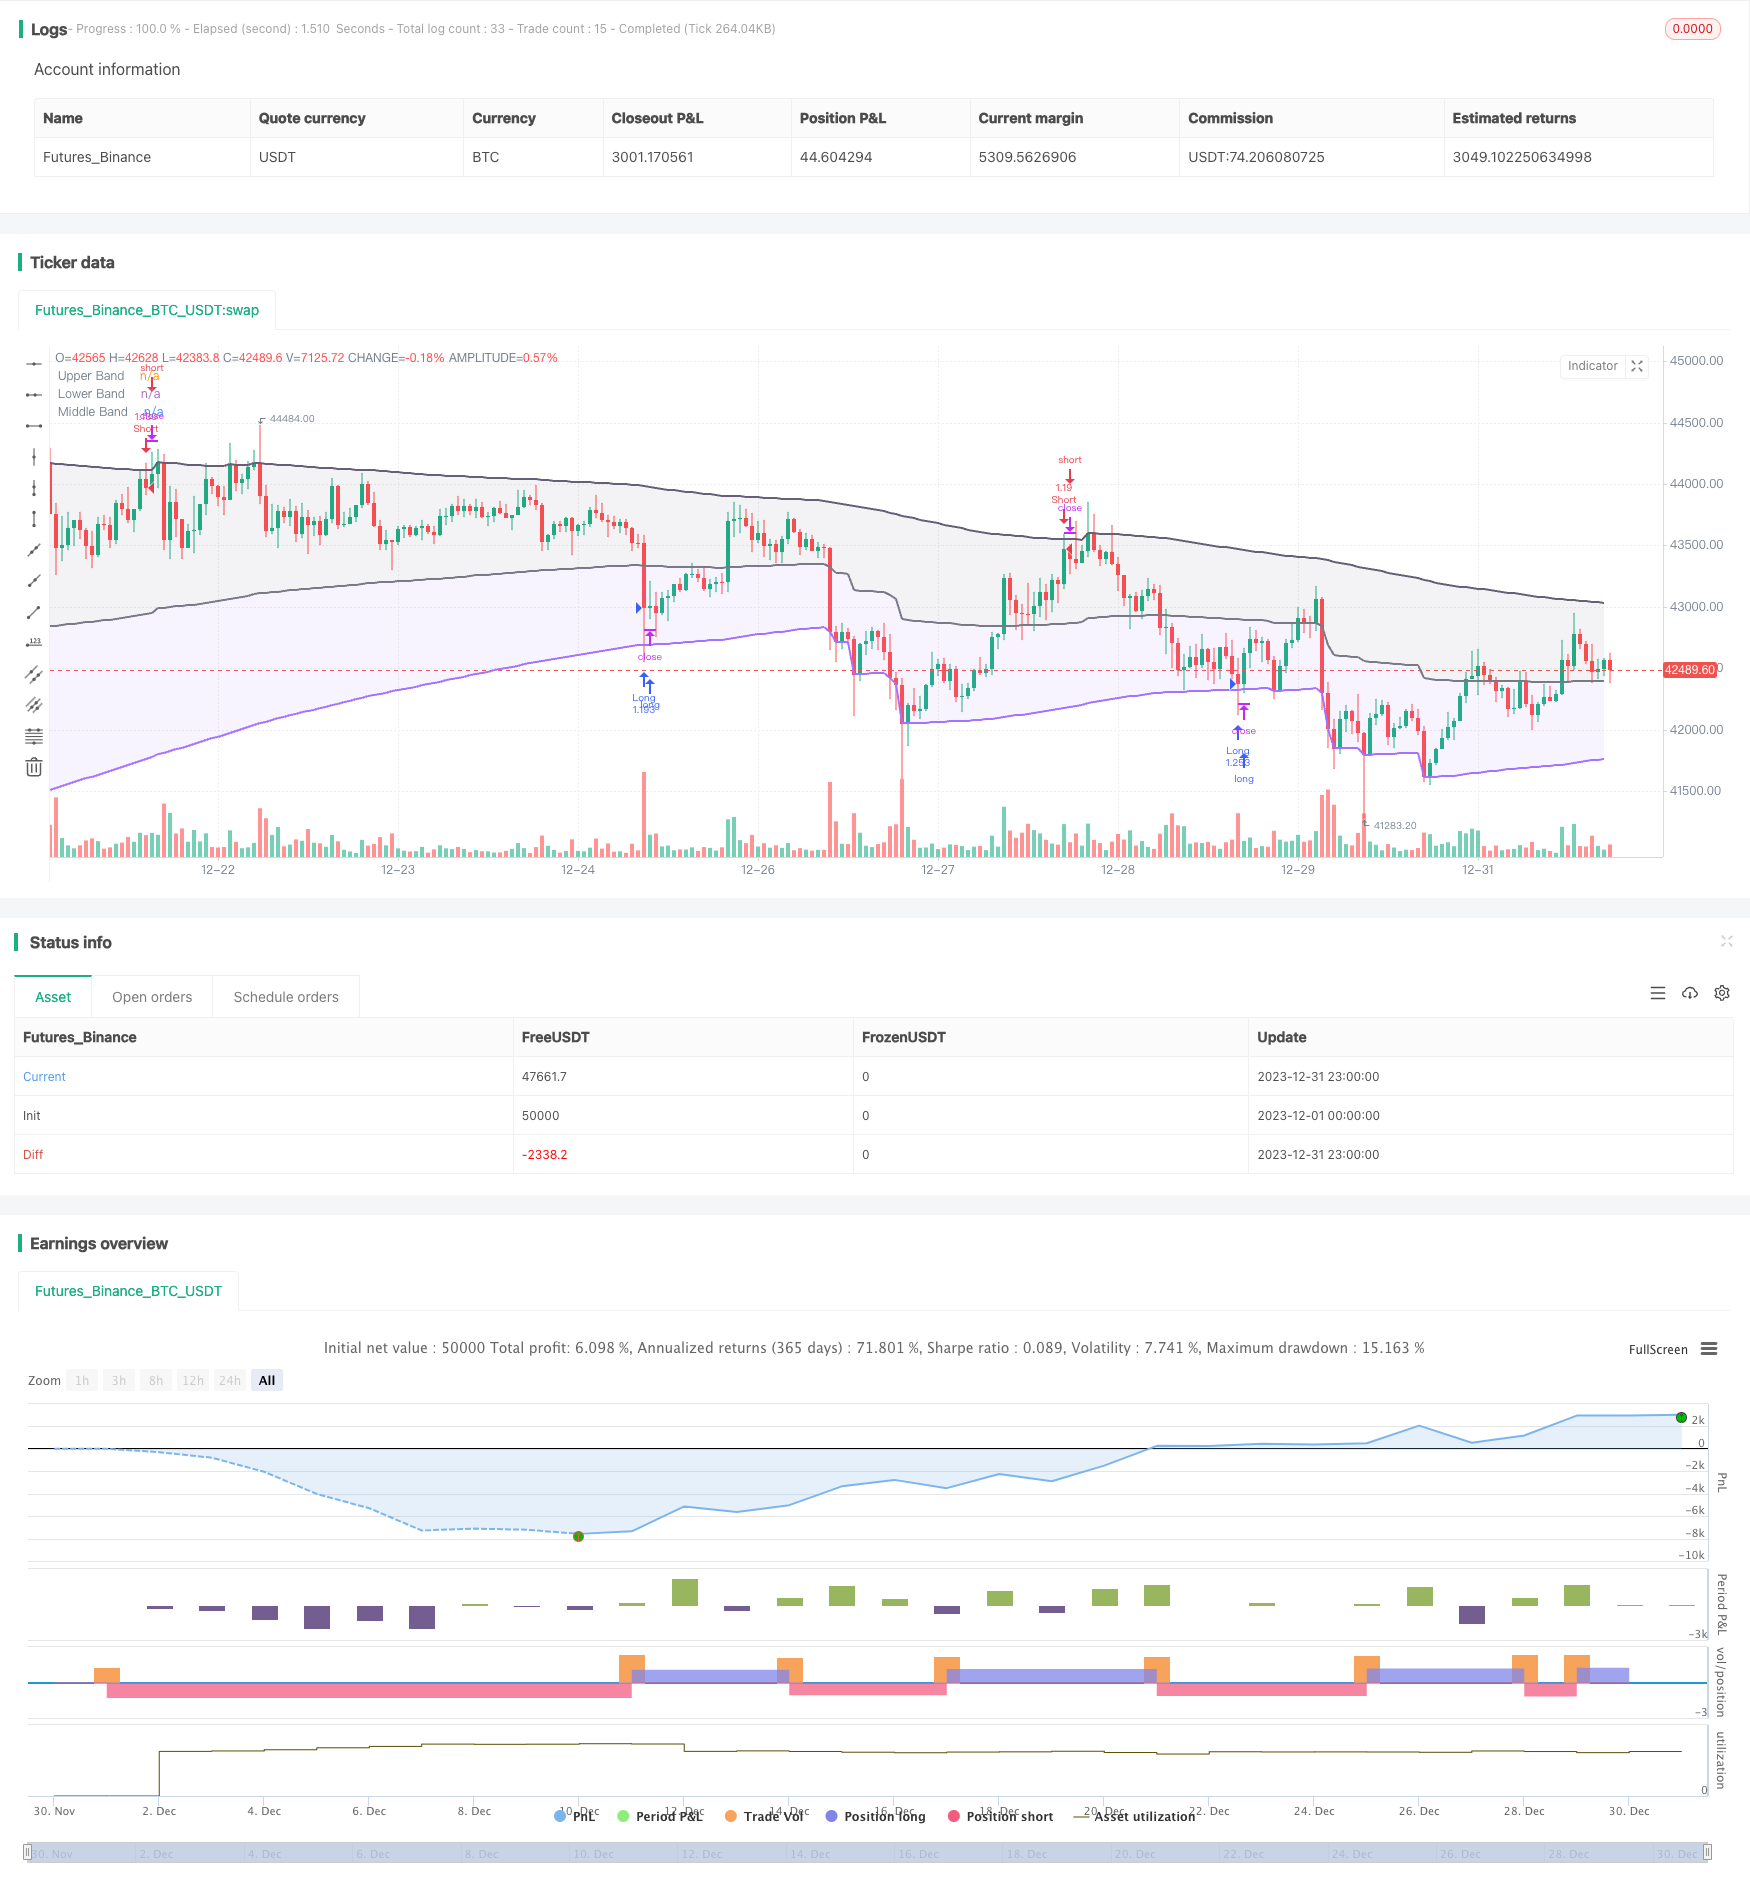
이 전략은 알렉스그로버가 개발한 리큐리브 밴드 지표에 기반한 트렌드 추적 및 브레이크아웃 전략이다. 리큐리브 밴드 지표를 사용하여 가격 추세와 주요 지원/저항 수준을 결정하고, 잘못된 브레이크아웃을 필터링하기 위해 모멘텀 조건과 결합하여 낮은 주파수이지만 고품질의 입시 신호를 달성합니다.
전략 논리
리커리브 밴드 지표 계산
재귀 대역 지표는 상단, 하단 및 중간 선으로 구성됩니다. 지표는 다음과 같이 계산됩니다.
상단역 = 최대 (max)) 이전 바
여기 n는 확장 계수이며 변동성은 ATR, 표준편차, 평균 진 범위 또는 특수 RFV 방법에서 선택할 수 있습니다. 길이 매개 변수는 민감도를 제어하며, 더 큰 값은 지표가 덜 자주 작동하도록합니다.
거래 규칙
이 전략은 먼저 하위 대역과 상위 대역이 같은 방향으로 추세를 보이고 있는지 확인하여 거짓 파장을 피합니다.
가격이 하위 범위를 넘으면, 롱, 상위 범위를 넘으면, 쇼트.
또한 스톱 로스 로직이 적용됩니다.
이점 분석
이 전략의 장점은 다음과 같습니다.
- 반복 계산을 피하는 재귀적 프레임워크를 사용하여 효율적인 지표 계산
- 다양한 시장 체제에 적응하기 위한 유연한 매개 변수 조정
- 트렌드와 브레이크를 결합하여 가짜 브레이크를 피합니다.
- 모멘텀 상태 필터는 신호 품질을 보장합니다
위험 분석
이 전략에는 몇 가지 위험도 있습니다.
- 부적절한 매개 변수 설정으로 인해 오버 트레이딩 또는 신호 품질이 떨어질 수 있습니다.
- 주요 트렌드 변경으로 큰 손실을 입을 수 있습니다.
- 극단적 인 움직임에서 미끄러짐 통제가 부족하면 손실이 증폭 될 수 있습니다.
이러한 위험은 매개 변수 최적화, 스톱 로스 구현, 미끄러짐 문턱 증가 등으로 관리 될 수 있습니다.
최적화 방향
전략의 최적화를 위한 몇 가지 방향:
- 안정성을 위한 여러 시간 프레임에 걸쳐 지표를 포함
- 적응 파라미터 최적화를 위한 기계 학습 모듈을 추가
- 최적의 매개 변수 조합을 찾기 위해 양적 상관 분석을 수행
- 심층 학습을 사용하여 가격 경로를 예측하고 신호 정확도를 향상시킵니다.
결론
요약하자면, 이것은 매우 실용적이고 효율적인 트렌드 추적 전략이다. 계산 효율을 위한 재귀적 프레임워크를 결합하고, 주요 트렌드를 결정하기 위해 트렌드 지원/저항을 사용하며, 잘못된 브레이크오웃을 필터링하고 신호 품질을 보장하기 위해 모멘텀 조건을 추가한다. 적절한 매개 변수 조정과 위험 통제로 좋은 결과를 얻을 수 있다. 더 복잡한 시장 체제에 적응하기 위해 추가 연구와 최적화에 가치가 있다.
/*backtest
start: 2023-12-01 00:00:00
end: 2023-12-31 23:59:59
period: 1h
basePeriod: 15m
exchanges: [{"eid":"Futures_Binance","currency":"BTC_USDT"}]
*/

// @version=5
// Original indicator by alexgrover
strategy('Extended Recursive Bands Strategy', overlay=true, commission_type=strategy.commission.percent,commission_value=0.06,default_qty_type =strategy.percent_of_equity,default_qty_value = 100,initial_capital =1000)
length = input.int(260, step=10, title='Length')
src = input(close, title='Source')
method = input.string('Classic', options=['Classic', 'Atr', 'Stdev', 'Ahlr', 'Rfv'], title='Method')
bandDirectionCheck = input.bool(true, title='Bands Hold Direction')
lookback = input(3)
//----
atr = ta.atr(length)
stdev = ta.stdev(src, length)
ahlr = ta.sma(high - low, length)
rfv = 0.
rfv := ta.rising(src, length) or ta.falling(src, length) ? math.abs(ta.change(src)) : rfv[1]
//-----
f(a, b, c) =>
    method == a ? b : c
v(x) =>
    f('Atr', atr, f('Stdev', stdev, f('Ahlr', ahlr, f('Rfv', rfv, x))))
//----
sc = 2 / (length + 1)
a = 0.
a := math.max(nz(a[1], src), src) - sc * v(math.abs(src - nz(a[1], src)))
b = 0.
b := math.min(nz(b[1], src), src) + sc * v(math.abs(src - nz(b[1], src)))
c = (a+b)/2

// Colors
beColor = #675F76
buColor = #a472ff

// Plots
pA = plot(a, color=color.new(beColor, 0), linewidth=2, title='Upper Band')
pB = plot(b, color=color.new(buColor, 0), linewidth=2, title='Lower Band')
pC = plot(c, color=color.rgb(120,123,134,0), linewidth=2, title='Middle Band')
fill(pC, pA, color=color.new(beColor,90))
fill(pC, pB, color=color.new(buColor,90))

// Band keeping direction
// By Adulari
longc = 0
shortc = 0
for i = 0 to lookback-1
    if b[i] > b[i+1]
        longc:=longc+1
    if a[i] < a[i+1]
        shortc:=shortc+1
bhdLong = if bandDirectionCheck
    longc==lookback
else
    true
bhdShort = if bandDirectionCheck
    shortc==lookback
else
    true

// Strategy
if b>=low and bhdLong
    strategy.entry(id='Long',direction=strategy.long)
if high>=a and bhdShort
    strategy.entry(id='Short',direction=strategy.short)

// TP at middle line
//if low<=c and strategy.position_size<0 and strategy.position_avg_price>close
    //strategy.exit(id="Short",limit=close)
//if high>=c and strategy.position_size>0 and strategy.position_avg_price<close
    //strategy.exit(id="Long",limit=close)
- 숨겨진 기회 에서의 돌파구 폭풍 전략
- 크로스 타임프레임 모멘텀 추적 전략
- 전략에 따른 이동 평균 트렌드
- 여러 시간 프레임에 걸쳐 피보트 슈퍼 트렌드 전략
- 양적 촛불 패턴 및 트렌드 다음 전략
- 슈퍼트렌드와 RSI 양적 거래 전략 결합
- 케이프타운 15분 촛불 발사 전략
- 이중 ATR 후속 정지 전략
- 쿨라마기 탈출 추적 전략
- 노로의 트렌드 이동 평균 전략의 극단적인 버전
- 전략에 따른 돈치안 트렌드
- 슈퍼트렌드 RSI EMA 크로스오버 전략
- 양방위 3점 이동평균 양적 거래 전략
- RSI 및 MACD 지표에 기초한 거래 전략
- CCI와 EMA에 기반한 스칼핑 전략
- 개선 된 파동 트렌드 추적 전략
- 이치모쿠의 전략
- 이동평균 크로스오버에 기초한 전략을 따르는 경향
- RSI 트렌드 트래일링 스톱 로스 전략
- 연대화 탈퇴 전략