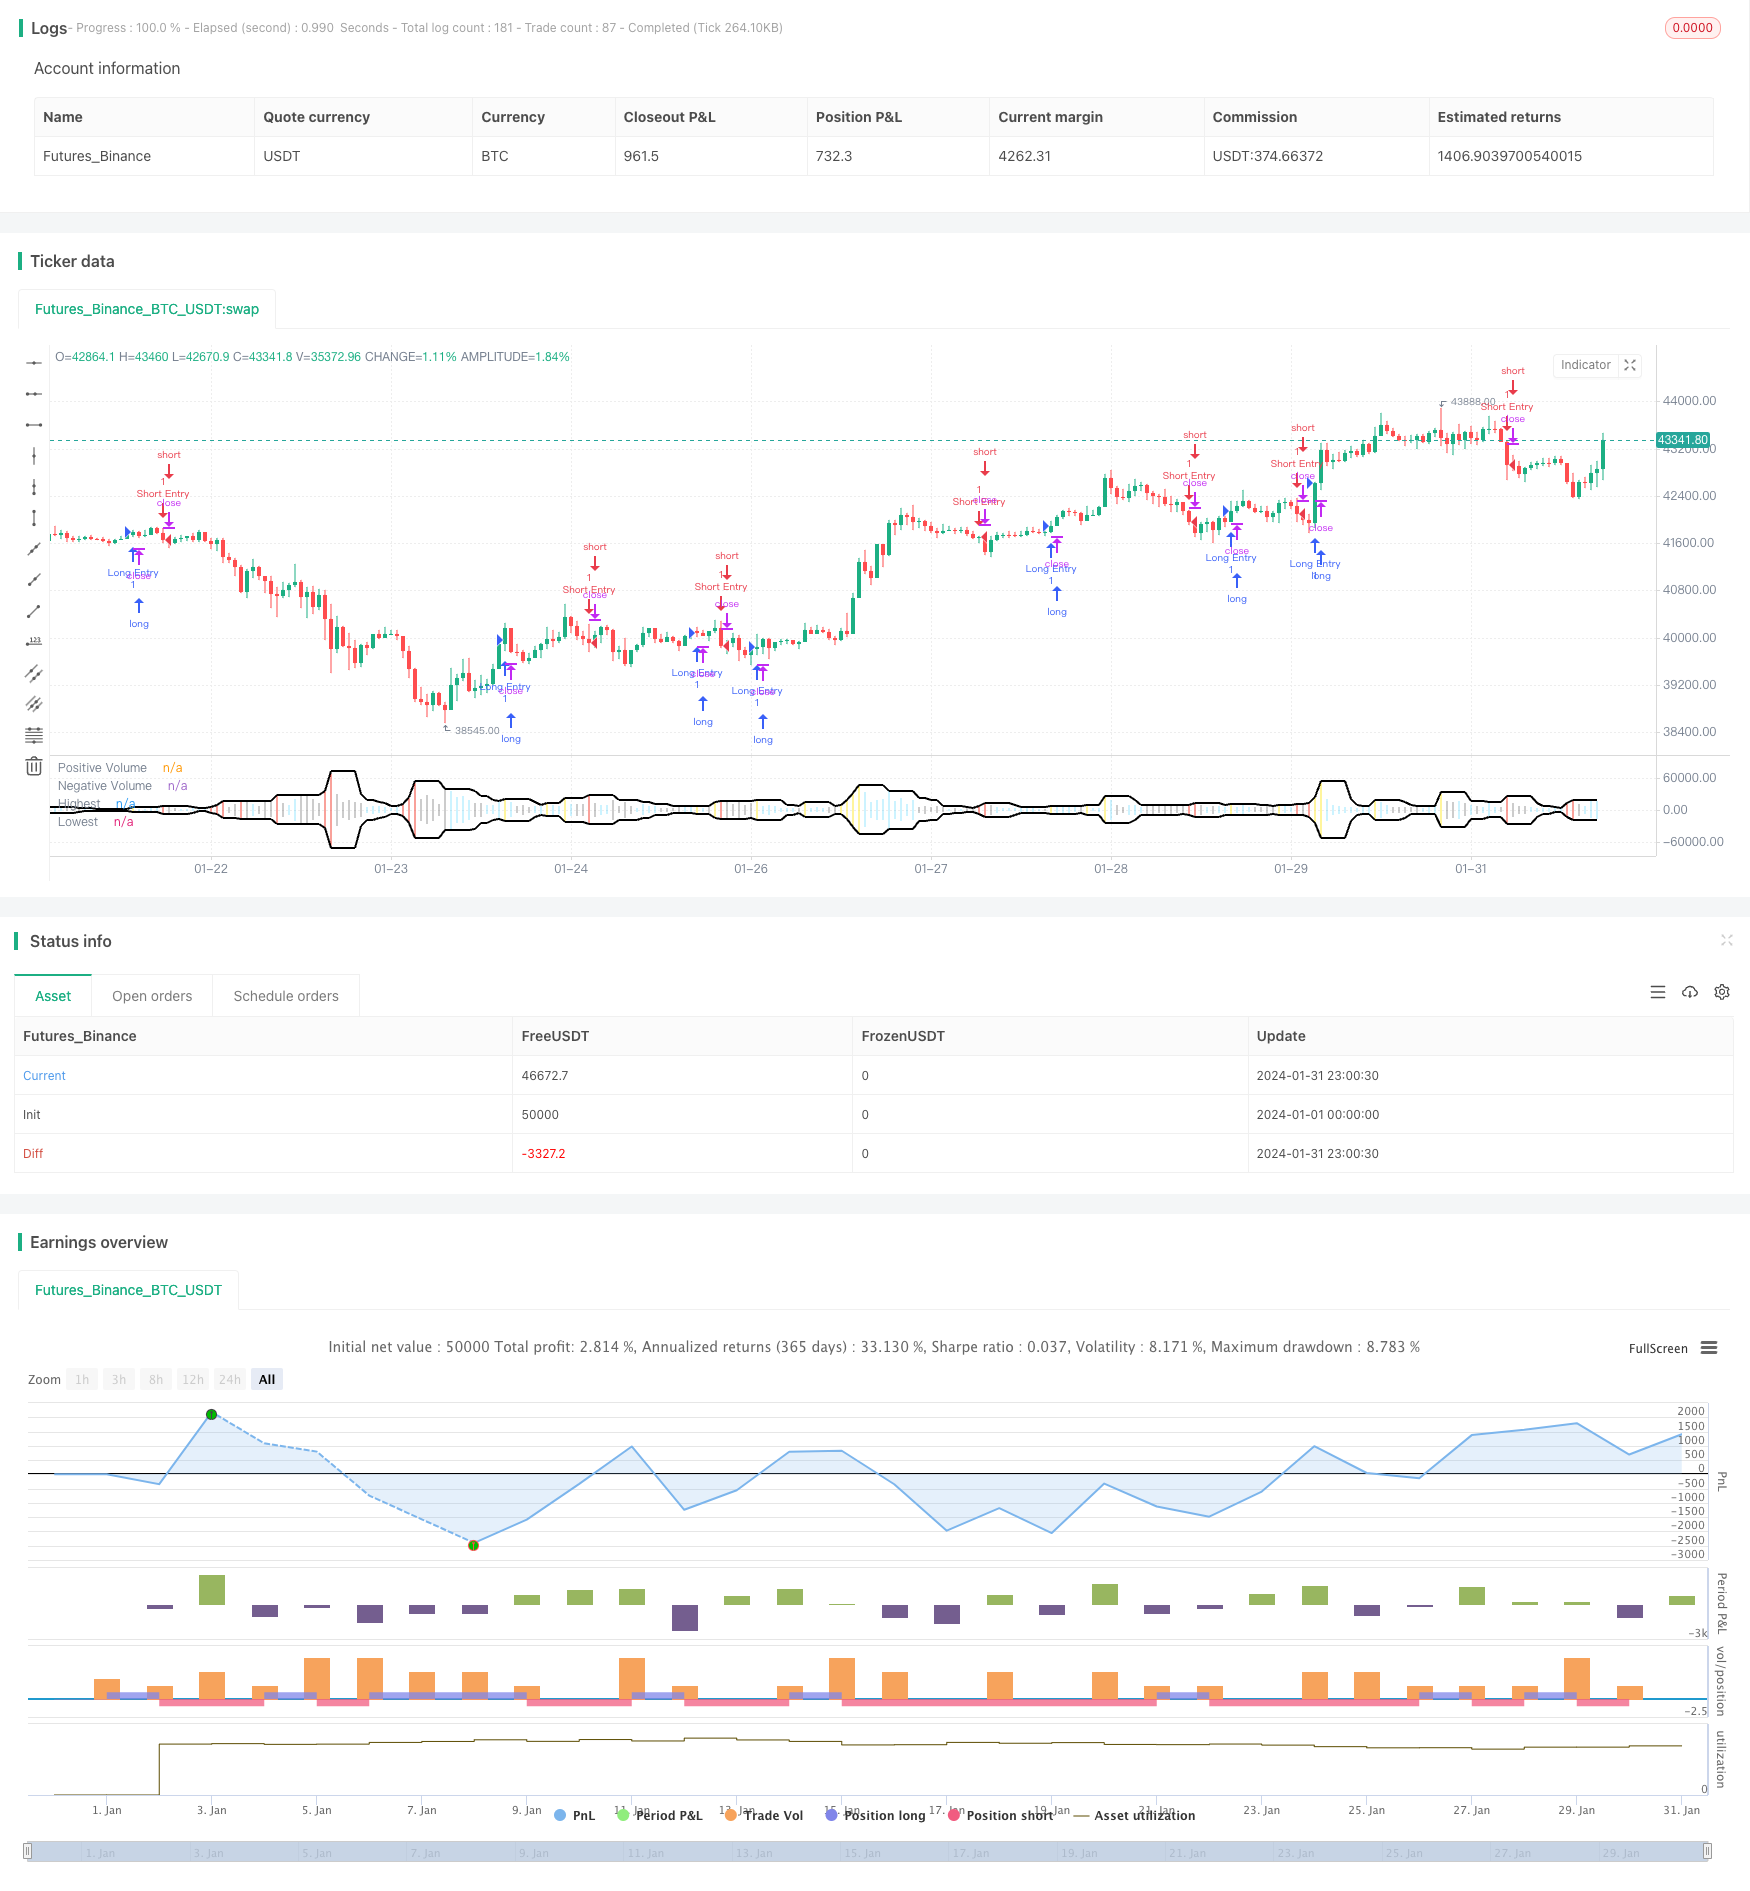
양적 범위 돌파구에 기초한 적응 변동 전략
저자:차오장, 날짜: 2024-02-22 16:50:46태그:

전반적인 설명
이 전략은 적응 변동 범위를 형성하기 위해 특정 최근 기간 동안 가장 높고 가장 낮은 거래량을 계산합니다. 현재 주기의 거래량이이 범위를 넘을 때 거래 신호가 생성됩니다. 신호 방향은 시장에서 갑작스러운 큰 단일 거래를 추적하는 간단하고 효과적인 전략인 진 양 촛불로 결정됩니다.
전략 논리
핵심 논리는 가장 최근의 N 사이클에서 긍정적 및 부정적인 거래 양의 가장 높고 낮은 값을 계산하여 적응 변동 범위를 형성하는 것입니다. 판단을 완료하기 위해 인 양 선 신호를 고려하면서이 범위에 기반하여 현재 기간에 돌파구가 발생하는지 여부를 결정합니다.
특정 계산 과정은 다음과 같습니다.
- 가장 높은 거래량 가장 높은 거래량 가장 낮은 거래량을 가장 최근 N 주기의 가장 낮은 거래량을 계산합니다
- 트랜잭션 볼륨이 현재 사이클의 볼륨이 최고보다 크는지 결정합니다.
- 현재 촛불이 인 또는 양인지 합쳐서 돌파 신호 판단을 완료
- 긴 신호와 짧은 신호를 생성
이점 분석
이 전략의 주요 장점은 다음과 같습니다.
- 적응 범위 설정은 시장 변화에 민감합니다.
- 높은 변동성 급증 추세를 포착하고 놓친 거래 비율을 줄이십시오.
- 잘못된 돌파구를 피하기 위해 촛불 모양 판단을 결합
- 구현 및 수정하기 쉽다
- 매개 변수는 다양한 제품에 맞게 조정됩니다.
위험 분석
이 전략은 또한 몇 가지 위험을 안고 있습니다.
- 높은 것을 추구하고 낮은 것을 죽이는 경향이 있습니다, 조절을 위해 매개 변수를 조정해야 합니다
- 큰 사이클 오시일레이션 시장에서 종종 잘못된 신호를 생성 할 수 있습니다.
- 정상과 비정상적인 돌파구를 구별 할 수 없습니다. 판단을 위해 다른 지표 또는 패턴을 통합해야합니다.
- 진입 기회는 하나뿐이고, 진화를 추적할 수 없습니다.
사이클 매개 변수를 조정하고 필터링을 위한 다른 지표를 통합하면 최적화 될 수 있습니다.
최적화 방향
전략은 여러 가지 방법으로 최적화 될 수 있습니다.
- 다양한 시장 주기에 맞게 범위 길이를 조정하기 위해 간격을 늘리십시오.
- 신호를 필터링하기 위해 MA, 볼링거 밴드 등을 포함합니다.
- 잘못된 신호를 피하기 위해 촛불 패턴과 조합을 최적화
- 재입구 및 스톱 손실 모듈을 추가하여 전략이 트렌드를 추적 할 수 있습니다.
요약
이 전략은 전반적으로 간단하고 실용적입니다. 적응 범위와 볼륨 가격 분석을 결합함으로써 일방적인 폭발적인 시장을 효과적으로 포착 할 수 있습니다. 그러나 잘못된 신호의 위험도 있습니다. 최대 영향을 달성하기 전에 적절한 매개 변수 조정과 보완 도구가 필요합니다.
/*backtest
start: 2024-01-01 00:00:00
end: 2024-01-31 23:59:59
period: 1h
basePeriod: 15m
exchanges: [{"eid":"Futures_Binance","currency":"BTC_USDT"}]
*/

// This source code is subject to the terms of the Mozilla Public License 2.0 at https://mozilla.org/MPL/2.0/
// © EvoCrypto

//@version=4
strategy("Ranged Volume Strategy - evo", shorttitle="Ranged Volume", format=format.volume)

// INPUTS {
Range_Length    =   input(5,        title="Range Length",                       minval=1)

Heikin_Ashi     =   input(true,     title="Heikin Ashi Colors")
Display_Bars    =   input(true,     title="Show Bar Colors")
Display_Break   =   input(true,     title="Show Break-Out")
Display_Range   =   input(true,     title="Show Range")
// }

// SETTINGS {
Close           =   Heikin_Ashi ? security(heikinashi(syminfo.tickerid), timeframe.period, close)    : close
Open            =   Heikin_Ashi ? security(heikinashi(syminfo.tickerid), timeframe.period, open)     : open

Positive        =    volume
Negative        =   -volume

Highest         =   highest(volume, Range_Length)
Lowest          =   lowest(-volume, Range_Length)

Up              =   Highest > Highest[1] and Close > Open
Dn              =   Highest > Highest[1] and Close < Open

Volume_Color    =
 Display_Break and Up   ? color.new(#ffeb3b, 0)     :
 Display_Break and Dn   ? color.new(#f44336, 0)     :
 Close > Open           ? color.new(#00c0ff, 60)    :
 Close < Open           ? color.new(#000000, 60)    : na
// }

//PLOTS {
plot(Positive,                      title="Positive Volume",    color=Volume_Color,             style=plot.style_histogram,  linewidth=4)
plot(Negative,                      title="Negative Volume",    color=Volume_Color,             style=plot.style_histogram,  linewidth=4)

plot(Display_Range ? Highest : na,  title="Highest",            color=color.new(#000000, 0),    style=plot.style_line,       linewidth=2)
plot(Display_Range ? Lowest  : na,  title="Lowest",             color=color.new(#000000, 0),    style=plot.style_line,       linewidth=2)

barcolor(Display_Bars ? Volume_Color : na)
// }

if (Up)
    strategy.entry("Long Entry", strategy.long)
if (Dn)
    strategy.entry("Short Entry", strategy.short)
더 많은
- RSI를 기반으로 한 간단한 암호화폐 거래 전략
- SMA와 가격 크로스오버에 기반한 양적 거래 전략
- 스톱 로스와 영업 취득을 가진 이중 이동 평균 크로스오버 전략
- 동력 추적 및 트렌드 전략
- MA 라인업에 기반한 전략을 따르는 경향
- 볼링거 밴드 기반의 트렌드를 따르는 전략
- 변동적 인 돌파구 전략
- 적응적인 이동 평균 거래 전략
- RSI 골든 크로스 쇼트 전략
- 이중 이동 평균과 볼린거 대역 조합 트렌드 추적 전략
- 황소 깃발 탈출 전략
- 이동 평균 크로스오버 거래 전략
- 이동 평균 크로스오버 금 거래 전략
- EMA와 MACD 트렌드 전략
- 이동 평균 크로스오버 MACD 거래 전략
- 슈퍼 트렌드 매일 역전 전략
- 이중 EMA 크로스오버 전략
- RSI 및 ZigZag 지표에 기초한 트렌드 추적 전략
- 이동 평균 크로스오버 브레이크업 전략
- 모멘텀 브레이크오웃 백테스팅 지원 저항 전략