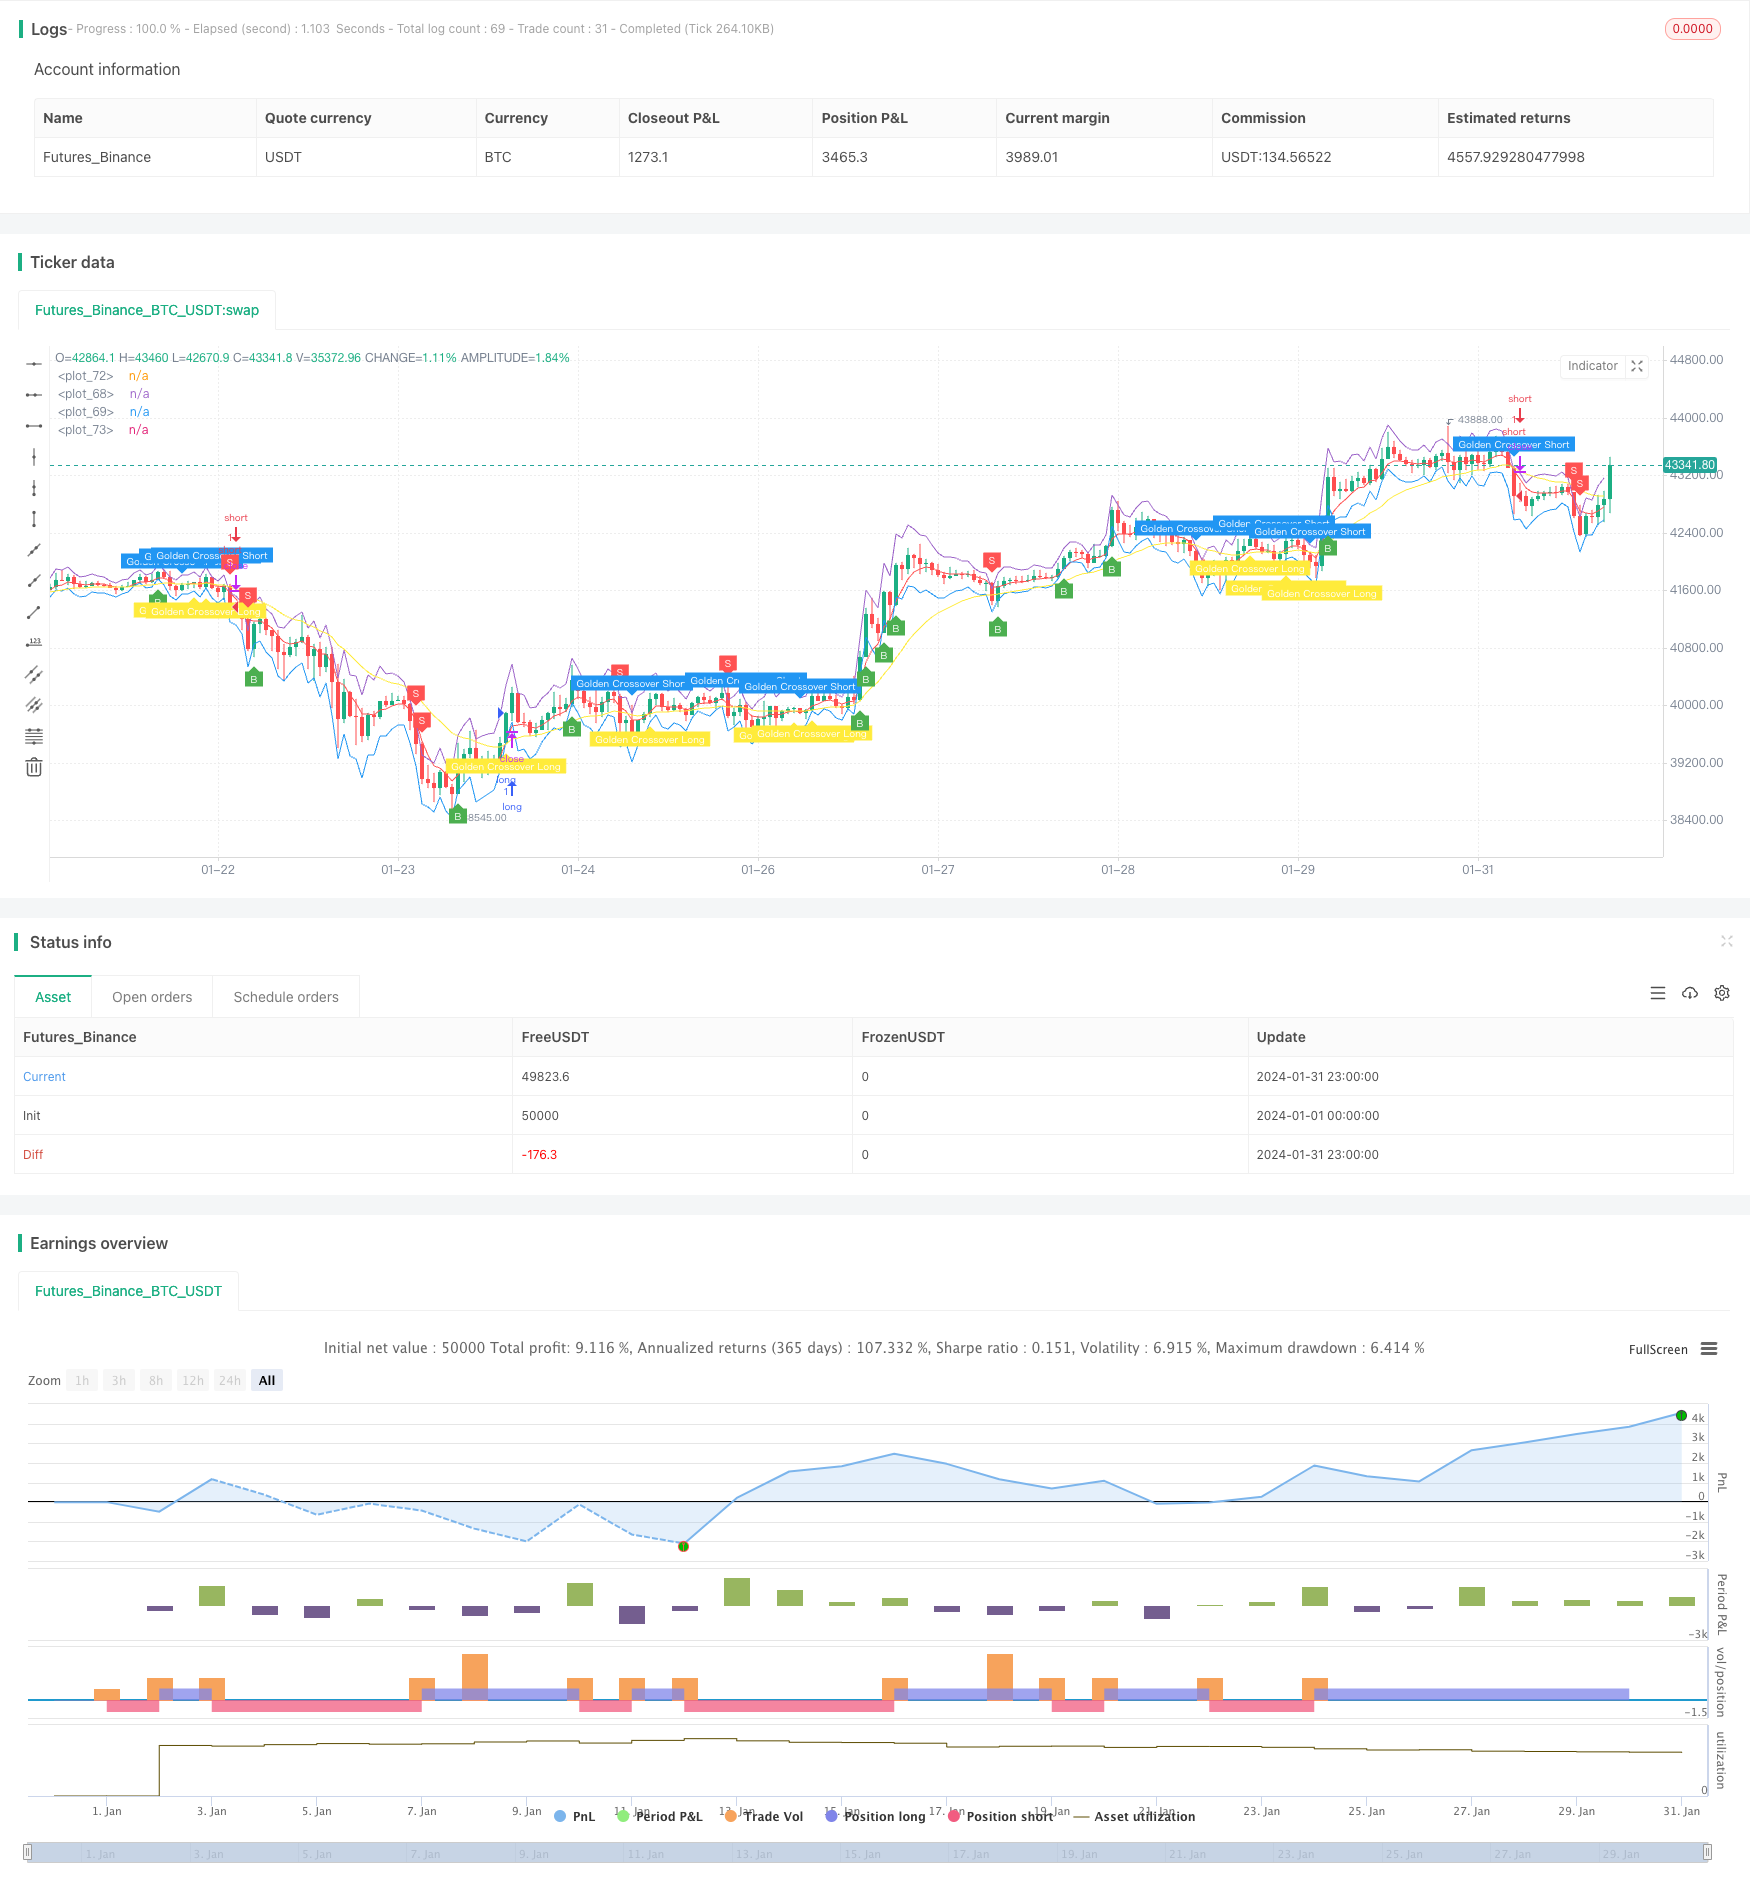
전략 개요
RSI 골드 포크 슈퍼 하위 전략은 ATR 파동, 쌍 RSI 지표 및 EMA 평행선의 골드 포크 데드 포크를 사용하여 트렌드 판단과 엔트리를 수행한다. ATR 파동은 가격이 초매상태에 있는지 여부를 판단하기 위해 사용되며, 쌍 RSI 지표는 가격 트렌드를 확인하기 위해 사용되며, EMA 평평선 하위 전략은 엔트리 기회를 찾기 위해 사용된다. 이 전략은 간단하고 쉽게 구현할 수 있으며, 효율적이고 유연한 하위 전략이다.
2. 전략 원칙
이 전략은 ATR 파장, 쌍 RSI 지표 및 EMA 평균선의 세 가지 구성 요소를 사용하여 엔트리 신호를 구현합니다. 가격이 상위 ATR 파장보다 더 높을 때 우리는 과매매로 판단합니다. 이 시점에 빠른 주기 RSI가 느린 주기 RSI보다 낮으면 추세는 황소 회전으로 나타납니다. 그리고 EMA 평균선의 사각지대가 발생하면 추세는 더 약해집니다.
특히, 오픈 시점의 가격이 ATR의 상단, 즉open>upper_band만약 만족한다면 초고가 될 수 있습니다. 그리고 우리는 빠른 RSI가 느린 RSI보다 낮다는 것을 판단합니다.rsi1<rsi2그리고, 만약 이 EMA가 성립한다면, 이것은 bulls/bears로 변하는 경향을 나타냅니다. 그리고, 마지막으로, EMA의 평균이 사각지대에 부딪히는지 확인합니다.ta.crossover(longSMA, shortSMA)3가지 조건이 모두 충족되면, 우리는 공허 신호를 내보냅니다.
대조적으로, 가격이 열릴 때 ATR의 하위 파동보다 낮고, 빠른 RSI가 느린 RSI보다 높고, EMA 골드포크가 발생하면 더 많은 입문 신호가 발생한다.
이 전략의 주요 혁신은 트렌드 판단을 위해 쌍 RSI 지표를 도입하여 단일 RSI에 비해 신뢰성이 높으며 ATR 대역과 EMA 평행선을 결합하여 신호를 필터링하여 신호를 더 정확하고 신뢰할 수 있도록하는 것입니다. 이것은 전략의 핵심 특징입니다.
세, 전략적 장점
이 전략은 다음과 같은 장점을 가지고 있습니다.
- 쌍 RSI 지표가 트렌드를 더 정확하고 신뢰할 수 있습니다.
- ATR파는 과매도 영역을 판단하여 가짜 돌파구를 피합니다.
- EMA 평균선은 명확한 골드포크/데드포크가 발생했을 때 진입하여 신호의 정확도를 높인다.
- 여러 지표 조합이 상호 검증되어 신뢰성이 높습니다.
- 전략은 간단하고 실행이 가능합니다.
- 이윤을 동시에 얻을 수 있는 양측의 과도한 매매
- 다른 시장에 맞게 조정할 수 있는 더 많은 매개 변수
네, 전략적 위험
이 전략에는 몇 가지 위험도 있습니다.
- EMA 평균선은 잘못된 진단을 유발할 수 있으며, smoothed MA가 더 안정적일 수 있다.
- 지진으로 인한 손실을 감수하기 쉽다.
- 변수를 잘못 설정하면 오류 신호가 증가할 수 있습니다.
- ATR파를 뚫는 것은 너무 이른 시점이고 가짜가 될 수도 있습니다.
위와 같은 위험은 다음의 몇 가지 측면에서 최적화될 수 있습니다.
- 테스트는 EMA 평균선 대신 smoothed MA를 사용합니다.
- 적당히 느슨한 정지폭으로 흔들리는 시장을 자주 정지하지 않도록 한다.
- 최적의 균형을 찾기 위해 변수 조합을 조정합니다.
- 브레이크밴드 때 더 많은 지표를 도입하여 2차 검증
다섯째, 전략적 최적화
이 전략은 다음과 같은 부분에서 더욱 개선될 수 있습니다.
- EMA 평균선 대신 Smoothed MA를 사용하여 잘못된 진단 신호를 줄일 수 있는지 테스트합니다.
- Keltner 통로와 같은 변동률 지표의 2차 검증을 증가시켜 가짜 돌파구를 방지합니다.
- ADX와 같은 더 많은 트렌드 지표를 추가하여 큰 트렌드를 판단합니다.
- 특정 품종 특성에 따라 매개 변수 설정을 조정하여 최적의 조합을 찾습니다.
- 다른 시간 주기 변수에서의 성능을 테스트합니다.
- 기계 학습 알고리즘 자동 최적화 매개 변수를 추가합니다.
이러한 최적화 조치는 전략의 안정성, 유연성 및 수익성을 더욱 높일 수 있습니다.
VI. 결론
RSI 골드 포크 슈퍼 하위 전략은 전체적으로 매우 효율적인 실용적인 단선 하위 전략이다. 그것은 동시에 세 가지 지표의 장점을 활용하여 통합적으로 엔트리 신호를 구현하고, 파라미터를 조정하여 다른 품종과 시장 환경에 적응할 수 있다. 이 전략의 핵심 혁신은 트렌드 전환을 판단하는 쌍 RSI 지표를 사용하여 ATR 파동대 및 EMA 평행선과 상호 검증하여 높은 정확도 엔트리를 형성하는 것이다. 전체적으로 이 전략은 실용성이 매우 강하며 투자자가 적극적으로 사용 할 가치가 있지만, 또한 주의가 필요한 몇 가지 위험 요소가 있습니다. 지속적인 테스트와 최적화를 통해 이 전략은 투자자의 수익 도구가 될 수 있다고 믿습니다.
/*backtest
start: 2024-01-01 00:00:00
end: 2024-01-31 23:59:59
period: 1h
basePeriod: 15m
exchanges: [{"eid":"Futures_Binance","currency":"BTC_USDT"}]
*/

//@version=5
//Revision: Updated script to pine script version 5
//added Double RSI for Long/Short prosition trend confirmation instead of single RSI
strategy("Super Scalper - 5 Min 15 Min", overlay=true)
source = close
atrlen = input.int(14, "ATR Period")
mult = input.float(1, "ATR Multi", step=0.1)
smoothing = input.string(title="ATR Smoothing", defval="WMA", options=["RMA", "SMA", "EMA", "WMA"])

ma_function(source, atrlen) =>
    if smoothing == "RMA"
        ta.rma(source, atrlen)
    else
        if smoothing == "SMA"
            ta.sma(source, atrlen)
        else
            if smoothing == "EMA"
                ta.ema(source, atrlen)
            else
                ta.wma(source, atrlen)

atr_slen = ma_function(ta.tr(true), atrlen)
upper_band = atr_slen * mult + close
lower_band = close - atr_slen * mult

// Create Indicator's
ShortEMAlen = input.int(5, "Fast EMA")
LongEMAlen = input.int(21, "Slow EMA")
shortSMA = ta.ema(close, ShortEMAlen)
longSMA = ta.ema(close, LongEMAlen)
RSILen1 = input.int(40, "Fast RSI Length")
RSILen2 = input.int(60, "Slow RSI Length")
rsi1 = ta.rsi(close, RSILen1)
rsi2 = ta.rsi(close, RSILen2)
atr = ta.atr(atrlen)

//RSI Cross condition
RSILong = rsi1 > rsi2
RSIShort = rsi1 < rsi2

// Specify conditions
longCondition = open < lower_band
shortCondition = open > upper_band
GoldenLong = ta.crossover(shortSMA, longSMA)
Goldenshort = ta.crossover(longSMA, shortSMA)

plotshape(shortCondition, title="Sell Label", text="S", location=location.abovebar, style=shape.labeldown, size=size.tiny, color=color.new(color.red, 0), textcolor=color.white)
plotshape(longCondition, title="Buy Label", text="B", location=location.belowbar, style=shape.labelup, size=size.tiny, color=color.new(color.green, 0), textcolor=color.white)
plotshape(Goldenshort, title="Golden Sell Label", text="Golden Crossover Short", location=location.abovebar, style=shape.labeldown, size=size.tiny, color=color.new(color.blue, 0), textcolor=color.white)
plotshape(GoldenLong, title="Golden Buy Label", text="Golden Crossover Long", location=location.belowbar, style=shape.labelup, size=size.tiny, color=color.new(color.yellow, 0), textcolor=color.white)

// Execute trade if condition is True
if (longCondition)
    stopLoss = low - atr * 1
    takeProfit = high + atr * 4
    if (RSILong)
        strategy.entry("long", strategy.long)

if (shortCondition)
    stopLoss = high + atr * 1
    takeProfit = low - atr * 4
    if (RSIShort)
        strategy.entry("short", strategy.short)

// Plot ATR bands to chart

////ATR Up/Low Bands
plot(upper_band)
plot(lower_band)

// Plot Moving Averages
plot(shortSMA, color=color.red)
plot(longSMA, color=color.yellow)