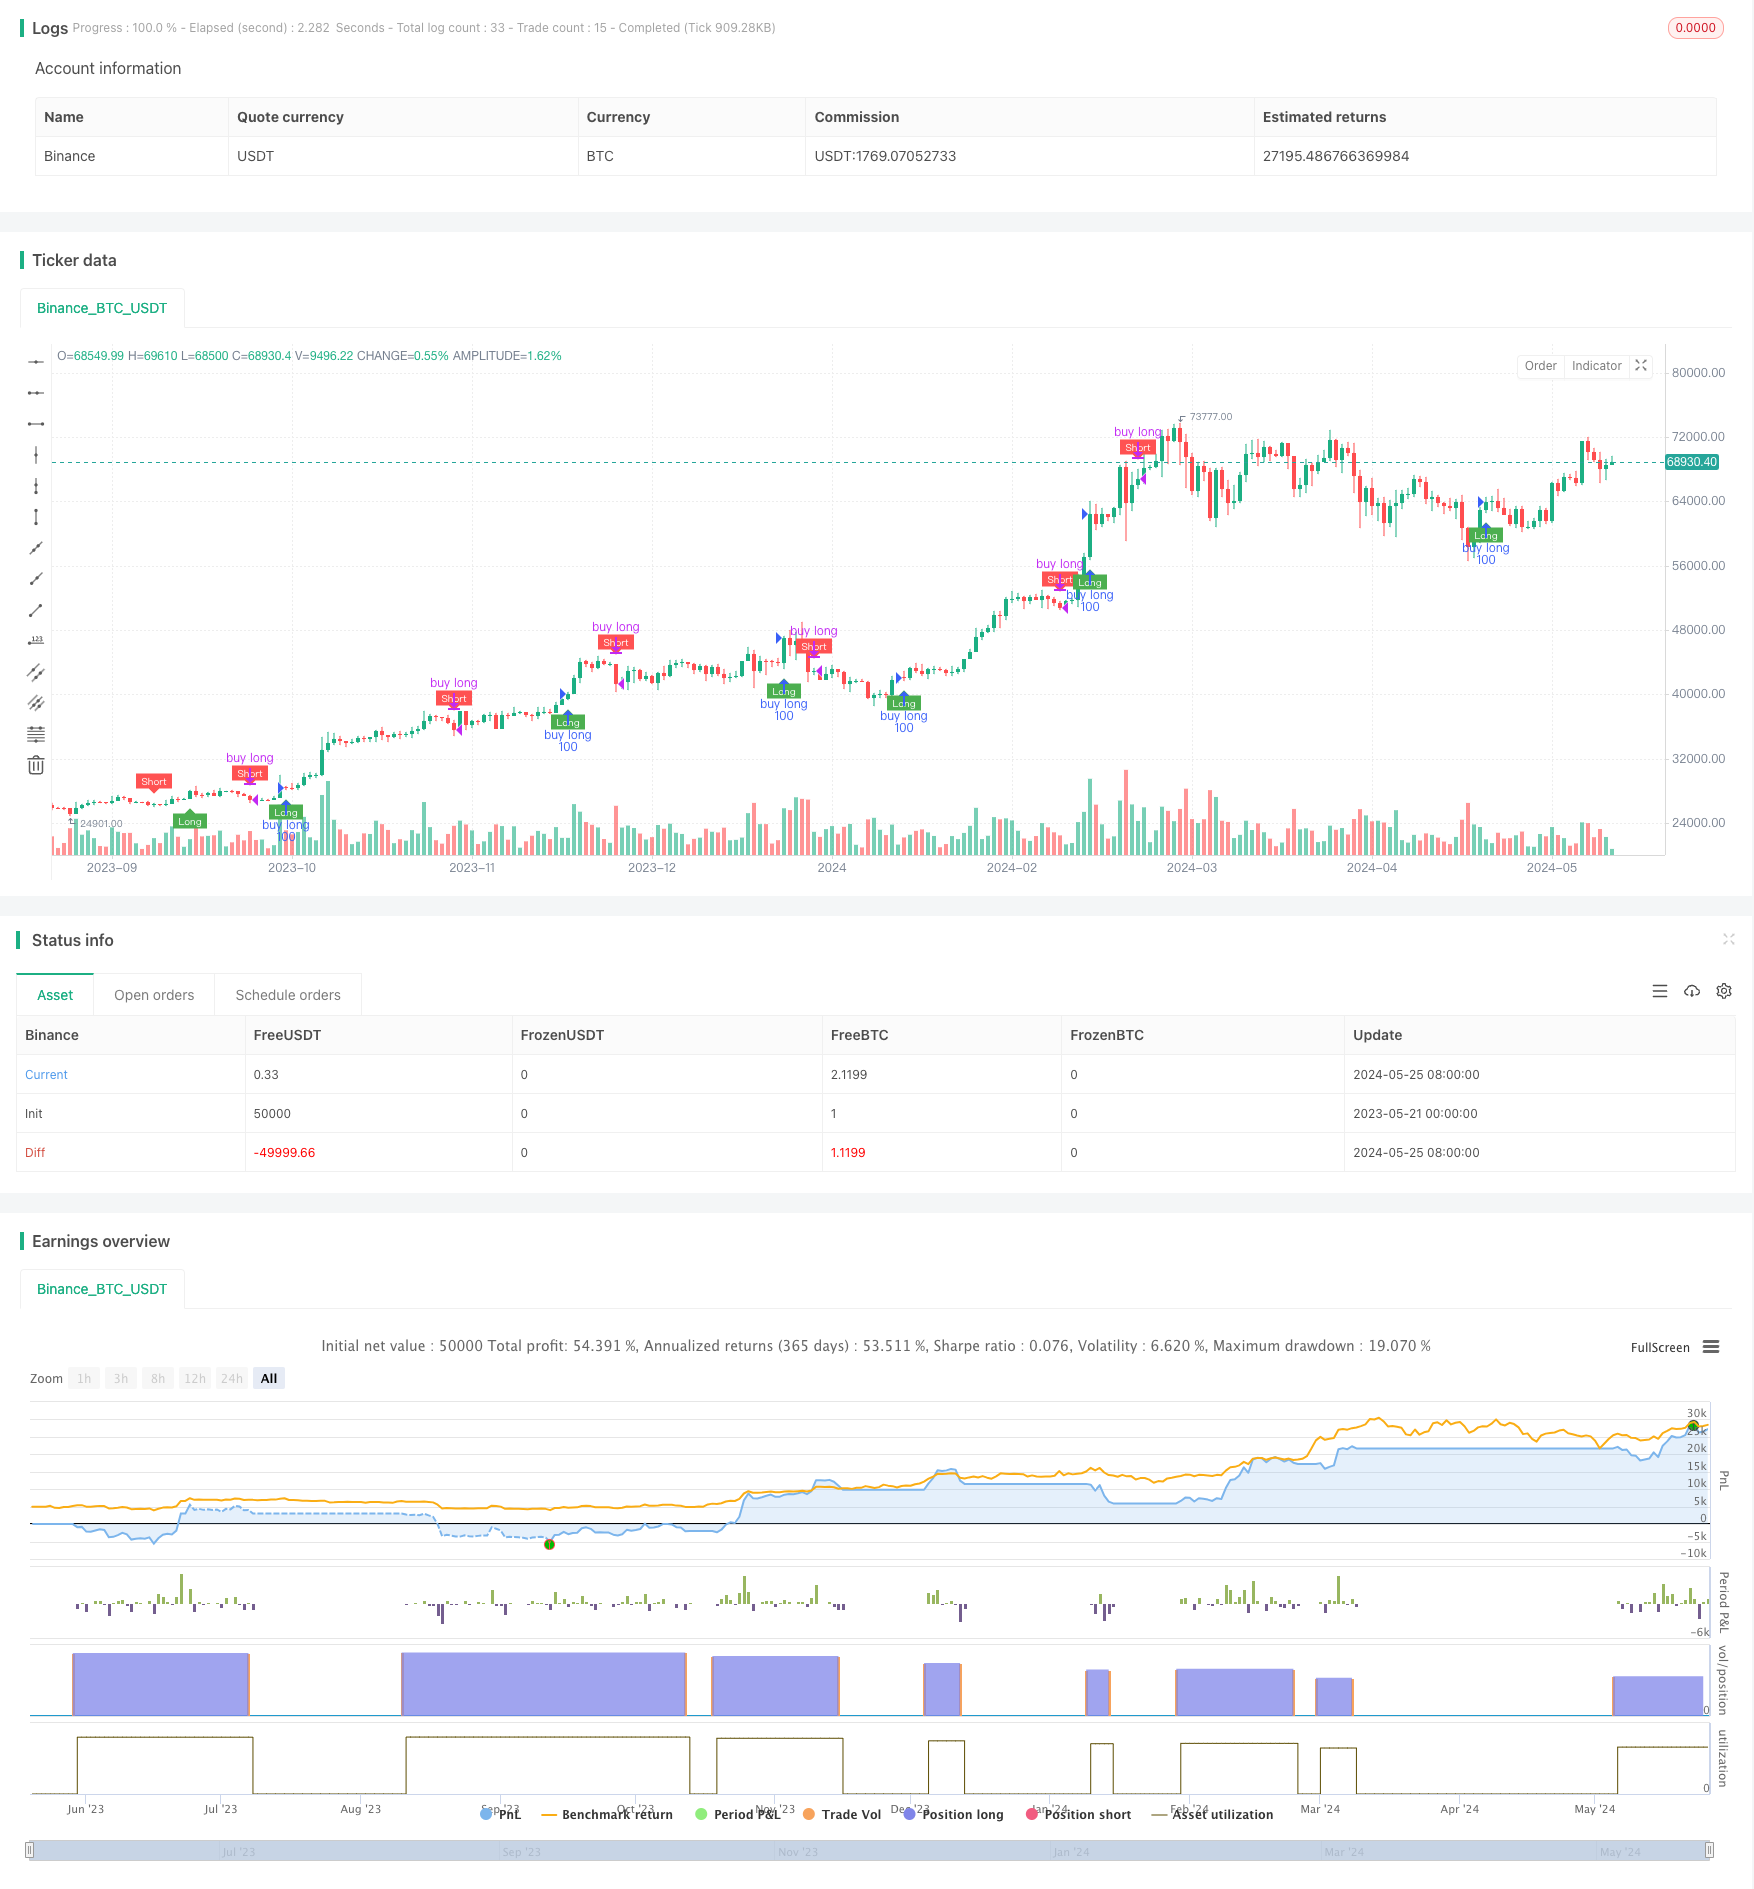
개요
이 전략은 QQE 지표와 RSI 지표를 기반으로 RSI 지표의 평평한 이동 평균과 동적 흔들림의 폭을 계산하여 다중 공백 신호 영역을 구성한다. RSI 지표가 경로를 돌파 할 때 다중 신호가 발생하고 경로를 돌파 할 때 공백 신호가 발생한다. 전략의 주요 아이디어는 RSI 지표의 추세 특성과 QQE 지표의 변동 특성을 활용하여 시장의 추세 변화와 변동 기회를 포착하는 것이다.
전략 원칙
- RSI 지표의 평평한 이동 평균 RsiMa를 계산하여 트렌드를 판단합니다.
- RSI 지표의 절대적 편차값인 AtrRsi를 계산하고, MaAtrRsi의 평평한 이동 평균을 계산하여, 변동성을 판단하는 기초로 사용한다.
- QQE 인자에 따라 동적 진동폭 dar를 계산하고, RsiMa와 결합하여 다공간 신호 영역의 longband과 shortband을 구성한다.
- RSI 지표와 다공간 신호 간격의 관계를 판단하기 위해, RSI 지표 상단에서 롱밴드를 통과하면 다공간 신호가 발생하고, 하단에서 쇼트밴드를 통과하면 공백 신호가 발생한다.
- 다중 공백 신호에 따라 거래하고, 다중 신호가 발생했을 때 입장을 열고, 공백 신호가 발생했을 때 입장을 평정한다.
전략적 이점
- RSI와 QQE의 특성을 결합하여 시장의 추세와 변동 기회를 더 잘 포착할 수 있습니다.
- 동적인 진동의 진폭을 사용하여 신호 범위를 구성하여 시장의 변동률 변화에 적응 할 수 있습니다.
- RSI 지표와 변동의 폭을 부드럽게 처리하여 잡음 방해와 빈번한 거래를 효과적으로 줄입니다.
- 논리가 명확하고, 변수가 적어서, 추가적인 최적화와 개선에 적합하다.
전략적 위험
- 이 전략은 불안정한 시장과 낮은 변동률의 시장에서는 이상적으로 작동하지 않을 수 있습니다.
- 시장이 급격히 뒤집어질 경우, 명확한 손해 방지 장치가 없기 때문에 더 큰 철수 위험에 직면할 수 있습니다.
- 매개 변수 설정은 전략 성능에 큰 영향을 미치며, 다른 시장과 품종에 따라 조정할 필요가 있다.
전략 최적화 방향
- 철회 위험을 통제하기 위해 고정 비율 상쇄, ATR 상쇄와 같은 명확한 상쇄 메커니즘을 도입하십시오.
- 최적화 파라미터 설정, 유전 알고리즘, 격자 검색 등의 방법을 통해 최적의 파라미터 조합을 찾을 수 있다.
- 거래량, 지분량 등의 다른 지표를 도입하여 거래 신호를 풍부하게하고 전략의 안정성을 높이는 것을 고려하십시오.
- 충격적인 시장의 경우, 범위를 거래하거나 파급 동작의 논리를 도입하여 전략의 적응성을 강화하는 것이 고려될 수 있다.
요약하다
이 전략은 RSI 지표와 QQE 지표에 기반하여 다공간 신호를 구축하고, 트렌드 캡처 및 변동 파악의 특징을 가지고 있다. 전략 논리는 명확하고, 파라미터가 적으며, 추가 최적화 및 개선에 적합하다. 그러나 전략에는 철회 제어, 파라미터 설정 등과 같은 특정 위험이 있습니다.
전략 소스 코드
/*backtest
start: 2023-05-21 00:00:00
end: 2024-05-26 00:00:00
period: 1d
basePeriod: 1h
exchanges: [{"eid":"Binance","currency":"BTC_USDT"}]
*/

//@version=4
// modified by swigle
// thanks colinmck

strategy("QQE signals bot", overlay=true)


RSI_Period = input(14, title='RSI Length')
SF = input(5, title='RSI Smoothing')
QQE = input(4.236, title='Fast QQE Factor')
ThreshHold = input(10, title="Thresh-hold")

src = close
Wilders_Period = RSI_Period * 2 - 1

Rsi = rsi(src, RSI_Period)
RsiMa = ema(Rsi, SF)
AtrRsi = abs(RsiMa[1] - RsiMa)
MaAtrRsi = ema(AtrRsi, Wilders_Period)
dar = ema(MaAtrRsi, Wilders_Period) * QQE

longband = 0.0
shortband = 0.0
trend = 0

DeltaFastAtrRsi = dar
RSIndex = RsiMa
newshortband = RSIndex + DeltaFastAtrRsi
newlongband = RSIndex - DeltaFastAtrRsi
longband := RSIndex[1] > longband[1] and RSIndex > longband[1] ? max(longband[1], newlongband) : newlongband
shortband := RSIndex[1] < shortband[1] and RSIndex < shortband[1] ? min(shortband[1], newshortband) : newshortband
cross_1 = cross(longband[1], RSIndex)
trend := cross(RSIndex, shortband[1]) ? 1 : cross_1 ? -1 : nz(trend[1], 1)
FastAtrRsiTL = trend == 1 ? longband : shortband

// Find all the QQE Crosses

QQExlong = 0
QQExlong := nz(QQExlong[1])
QQExshort = 0
QQExshort := nz(QQExshort[1])
QQExlong := FastAtrRsiTL < RSIndex ? QQExlong + 1 : 0
QQExshort := FastAtrRsiTL > RSIndex ? QQExshort + 1 : 0

//Conditions

qqeLong = QQExlong == 1 ? FastAtrRsiTL[1] - 50 : na
qqeShort = QQExshort == 1 ? FastAtrRsiTL[1] - 50 : na

// Plotting

plotshape(qqeLong, title="QQE long", text="Long", textcolor=color.white, style=shape.labelup, location=location.belowbar, color=color.green, size=size.tiny)
plotshape(qqeShort, title="QQE short", text="Short", textcolor=color.white, style=shape.labeldown, location=location.abovebar, color=color.red, size=size.tiny)

// trade

//if qqeLong > 0
strategy.entry("buy long", strategy.long, 100, when=qqeLong)

if qqeShort > 0
    strategy.close("buy long")
    // strategy.exit("close_position", "buy long", loss=1000)
    // strategy.entry("sell", strategy.short, 1, when=strategy.position_size > 0)