Cryptocurrency Futures Multi-Symbol ART Strategy (Pengajaran)
Penulis:Ninabadass, Dicipta: 2022-04-07 11:09:42, Dikemas kini: 2022-04-07 16:15:14Cryptocurrency Futures Multi-Symbol ART Strategy (Pengajaran)
Baru-baru ini, sesetengah pengguna platform kami sangat berharap untuk memindahkan strategi Mylanguage ke dalam strategi JavaScript, supaya banyak idea pengoptimuman dapat ditambah dengan fleksibel. Mereka bahkan ingin memperluaskan strategi ke dalam versi pelbagai simbol. Kerana strategi Mylanguage biasanya strategi trend, dan banyak yang dilaksanakan dalam model harga yang dekat. Strategi-strategi tersebut meminta antara muka API platform tidak terlalu kerap, yang lebih sesuai untuk memindahkan ke dalam versi strategi pelbagai simbol. Dalam artikel ini, kami mengambil strategi Mylanguage yang mudah sebagai contoh dan memindahkannya ke dalam versi bahasa JavaScript yang mudah. Tujuan utama adalah untuk mengajar, backtest dan penyelidikan. Jika anda ingin menjalankan strategi, anda mungkin perlu menambah beberapa butiran (seperti jumlah pesanan, ketepatan, jumlah pesanan, kawalan status pesanan mengikut aset, nisbah maklumat bot dan sebagainya), juga perlu menjalankan ujian tik sebenar.
Strategi Mylangauge akan dipindahkan
TR:=MAX(MAX((H-L),ABS(REF(C,1)-H)),ABS(REF(C,1)-L));
ATR:=EMA(TR,LENGTH2);

MIDLINE^^EMA((H + L + C)/3,LENGTH1);
UPBAND^^MIDLINE + N*ATR;
DOWNBAND^^MIDLINE - N*ATR;


BKVOL=0 AND C>=UPBAND AND REF(C,1)<REF(UPBAND,1),BPK;
SKVOL=0 AND C<=DOWNBAND AND REF(C,1)>REF(DOWNBAND,1),SPK;

BKVOL>0 AND C<=MIDLINE,SP(BKVOL);
SKVOL>0 AND C>=MIDLINE,BP(SKVOL);
// stop loss
C>=SKPRICE*(1+SLOSS*0.01),BP;
C<=BKPRICE*(1-SLOSS*0.01),SP;
AUTOFILTER;
Logik strategi adalah sangat mudah. Pertama, mengikut parameter, mengira ATR, dan kemudian mengira nilai purata harga tertinggi, terendah, tutup dan terbuka semua BAR K-line, yang mana penunjuk EMA akan dikira. Akhirnya, berdasarkan ATR dan nisbah N dalam parameter, mengira upBand dan downBand.
Posisi terbuka dan kebalikan adalah berdasarkan harga penutupan yang memecahkan upBand dan downBand. Kembali melalui upBand (apabila memegang pendek), buka panjang; kebalikan melalui downBand, buka pendek. Apabila harga penutupan mencapai garis tengah, kedudukan penutupan; apabila harga penutupan mencapai harga stop loss, kedudukan penutupan (mengikut SLOSS untuk menghentikan kerugian; apabila SLOSS adalah 1, ia bermaksud 0.01, iaitu 1%). Strategi ini dilaksanakan dalam model harga dekat.
Setelah memahami keperluan strategi dan pemikiran Mylanguage, kita boleh mula berporting.
Prototaip Strategi Pelabuhan dan Reka Bentuk
Kod prototaip strategi tidak terlalu panjang, hanya 1 hingga 200 baris. untuk anda mudah mempelajari idea-idea penulisan strategi, saya langsung menulis komen dalam kod strategi.
// parse params, from string to object
var arrParam = JSON.parse(params)

// the function creates the chart configuration
function createChartConfig(symbol, atrPeriod, emaPeriod, index) {   // symbol: trading pair; atrPeriod: ATR parameter period;  emaPeriod: EMA parameter period; index: index of the corresponding exchange object
    var chart = {
        __isStock: true,
        extension: {
                layout: 'single',
                height: 600,
        },
        title : { text : symbol},
        xAxis: { type: 'datetime'},
        series : [
            {
                type: 'candlestick',    // K-line data series
                name: symbol,
                id: symbol + "-" + index,
                data: []
            }, {
                type: 'line',           // EMA
                name: symbol + ',EMA:' + emaPeriod,
                data: [],
            }, {
                type: 'line',           // upBand
                name: symbol + ',upBand' + atrPeriod,
                data: []
            }, {
                type: 'line',           // downBand
                name: symbol + ',downBand' + atrPeriod,
                data: []
            }, {
                type: 'flags',
                onSeries: symbol + "-" + index,
                data: [],
            }
        ]
    }
    return chart
}

// main logic
function process(e, kIndex, c) {    // e is the exchange object, such as exchanges[0] ... ; kIndex is the data series of K-line data in the chart; c is the chart object
    // obtain K-line data
    var r = e.GetRecords(e.param.period)
    if (!r || r.length < e.param.atrPeriod + 2 || r.length < e.param.emaPeriod + 2) {
        // if K-line data length is insufficient, return
        return
    }

    // calculate ATR indicator
    var atr = TA.ATR(r, e.param.atrPeriod)
    var arrAvgPrice = []
    _.each(r, function(bar) {
        arrAvgPrice.push((bar.High + bar.Low + bar.Close) / 3)
    })
    // calculate EMA indicator
    var midLine = TA.EMA(arrAvgPrice, e.param.emaPeriod)
    // calculate upBand and downBand
    var upBand = []
    var downBand = []
    _.each(midLine, function(mid, index) {
        if (index < e.param.emaPeriod - 1 || index < e.param.atrPeriod - 1) {
            upBand.push(NaN)
            downBand.push(NaN)
            return
        }
        upBand.push(mid + e.param.trackRatio * atr[index])
        downBand.push(mid - e.param.trackRatio * atr[index])
    })

    // plot
    for (var i = 0 ; i < r.length ; i++) {
        if (r[i].Time == e.state.lastBarTime) {
            // update
            c.add(kIndex, [r[i].Time, r[i].Open, r[i].High, r[i].Low, r[i].Close], -1)
            c.add(kIndex + 1, [r[i].Time, midLine[i]], -1)
            c.add(kIndex + 2, [r[i].Time, upBand[i]], -1)
            c.add(kIndex + 3, [r[i].Time, downBand[i]], -1)
        } else if (r[i].Time > e.state.lastBarTime) {
            // add
            e.state.lastBarTime = r[i].Time
            c.add(kIndex, [r[i].Time, r[i].Open, r[i].High, r[i].Low, r[i].Close])
            c.add(kIndex + 1, [r[i].Time, midLine[i]])
            c.add(kIndex + 2, [r[i].Time, upBand[i]])
            c.add(kIndex + 3, [r[i].Time, downBand[i]])
        }
    }

    // detect position
    var pos = e.GetPosition()
    if (!pos) {
        return
    }
    var holdAmount = 0
    var holdPrice = 0
    if (pos.length > 1) {
        throw "Long and short positions are detected simultaneously!"
    } else if (pos.length != 0) {
        holdAmount = pos[0].Type == PD_LONG ? pos[0].Amount : -pos[0].Amount
        holdPrice = pos[0].Price
    }

    if (e.state.preBar == -1) {
        e.state.preBar = r[r.length - 1].Time
    }
    // detect signal
    if (e.state.preBar != r[r.length - 1].Time) {   // close price model
        if (holdAmount <= 0 && r[r.length - 3].Close < upBand[upBand.length - 3] && r[r.length - 2].Close > upBand[upBand.length - 2]) {   // close price up cross the upBand
            if (holdAmount < 0) {   // holding short, close position
                Log(e.GetCurrency(), "close short position", "#FF0000")
                $.CoverShort(e, e.param.symbol, Math.abs(holdAmount))
                c.add(kIndex + 4, {x: r[r.length - 2].Time, color: 'red', shape: 'flag', title: 'close', text: "close short position"})
            }
            // open long
            Log(e.GetCurrency(), "open long position", "#FF0000")
            $.OpenLong(e, e.param.symbol, 10)
            c.add(kIndex + 4, {x: r[r.length - 2].Time, color: 'red', shape: 'flag', title: 'long', text: "open long position"})
        } else if (holdAmount >= 0 && r[r.length - 3].Close > downBand[downBand.length - 3] && r[r.length - 2].Close < downBand[downBand.length - 2]) {  // close price down cross the downBand
            if (holdAmount > 0) {   // holding long, close position
                Log(e.GetCurrency(), "close long position", "#FF0000")
                $.CoverLong(e, e.param.symbol, Math.abs(holdAmount))
                c.add(kIndex + 4, {x: r[r.length - 2].Time, color: 'green', shape: 'flag', title: 'close', text: "close long position"})
            }
            // open short
            Log(e.GetCurrency(), "open short position", "#FF0000")
            $.OpenShort(e, e.param.symbol, 10)
            c.add(kIndex + 4, {x: r[r.length - 2].Time, color: 'green', shape: 'flag', title: 'short', text: "open short position"})
        } else {
            // close position
            if (holdAmount > 0 && (r[r.length - 2].Close <= holdPrice * (1 - e.param.stopLoss) || r[r.length - 2].Close <= midLine[midLine.length - 2])) {   // if holding long position, close price is equal to or less than midline, stop loss according to open position price
                Log(e.GetCurrency(), "if midline is triggered or stop loss, close long position", "#FF0000")
                $.CoverLong(e, e.param.symbol, Math.abs(holdAmount))
                c.add(kIndex + 4, {x: r[r.length - 2].Time, color: 'green', shape: 'flag', title: 'close', text: "close long position"})
            } else if (holdAmount < 0 && (r[r.length - 2].Close >= holdPrice * (1 + e.param.stopLoss) || r[r.length - 2].Close >= midLine[midLine.length - 2])) {  // if holding short position, close price is equal to or more than midline, stop loss according to open position price
                Log(e.GetCurrency(), "if midline is triggered or stop loss, close short position", "#FF0000")
                $.CoverShort(e, e.param.symbol, Math.abs(holdAmount))
                c.add(kIndex + 4, {x: r[r.length - 2].Time, color: 'red', shape: 'flag', title: 'close', text: "close short position"})
            }
        }
        e.state.preBar = r[r.length - 1].Time
    }
}

function main() {
    var arrChartConfig = []
    if (arrParam.length != exchanges.length) {
        throw "The parameter and the exchange object do not match!"
    }
    var arrState = _G("arrState")
    _.each(exchanges, function(e, index) {
        if (e.GetName() != "Futures_Binance") {
            throw "The platform is not supported!"
        }
        e.param = arrParam[index]
        e.state = {lastBarTime: 0, symbol: e.param.symbol, currency: e.GetCurrency()}
        if (arrState) {
            if (arrState[index].symbol == e.param.symbol && arrState[index].currency == e.GetCurrency()) {
                Log("Recover:", e.state)
                e.state = arrState[index]
            } else {
                throw "The recovered data and the current setting do not match!"
            }
        }
        e.state.preBar = -1   // initially set -1
        e.SetContractType(e.param.symbol)
        Log(e.GetName(), e.GetLabel(), "Set contract:", e.param.symbol)
        arrChartConfig.push(createChartConfig(e.GetCurrency(), e.param.atrPeriod, e.param.emaPeriod, index))
    })
    var chart = Chart(arrChartConfig)
    chart.reset()

    while (true) {
        _.each(exchanges, function(e, index) {
            process(e, index + index * 4, chart)
            Sleep(500)
        })
    }
}

function onexit() {
    // record e.state
    var arrState = []
    _.each(exchanges, function(e) {
        arrState.push(e.state)
    })
    Log("Record:", arrState)
    _G("arrState", arrState)
}
Parameter strategi:
var params = '[{
        "symbol" : "swap",    // contract code
        "period" : 86400,     // K-line period; 86400 seconds indicates 1 day
        "stopLoss" : 0.07,    // ratio of stoploss; 0.07 means 7%
        "atrPeriod" : 10,     // ATR indicator parameter
        "emaPeriod" : 10,     // EMA indicator parameter
        "trackRatio" : 1,     // ratio of upBand or downBand
        "openRatio" : 0.1     // ratio of reserved open position (temporarily not supported)
    }, {
        "symbol" : "swap",
        "period" : 86400,
        "stopLoss" : 0.07,
        "atrPeriod" : 10,
        "emaPeriod" : 10,
        "trackRatio" : 1,
        "openRatio" : 0.1
    }]'
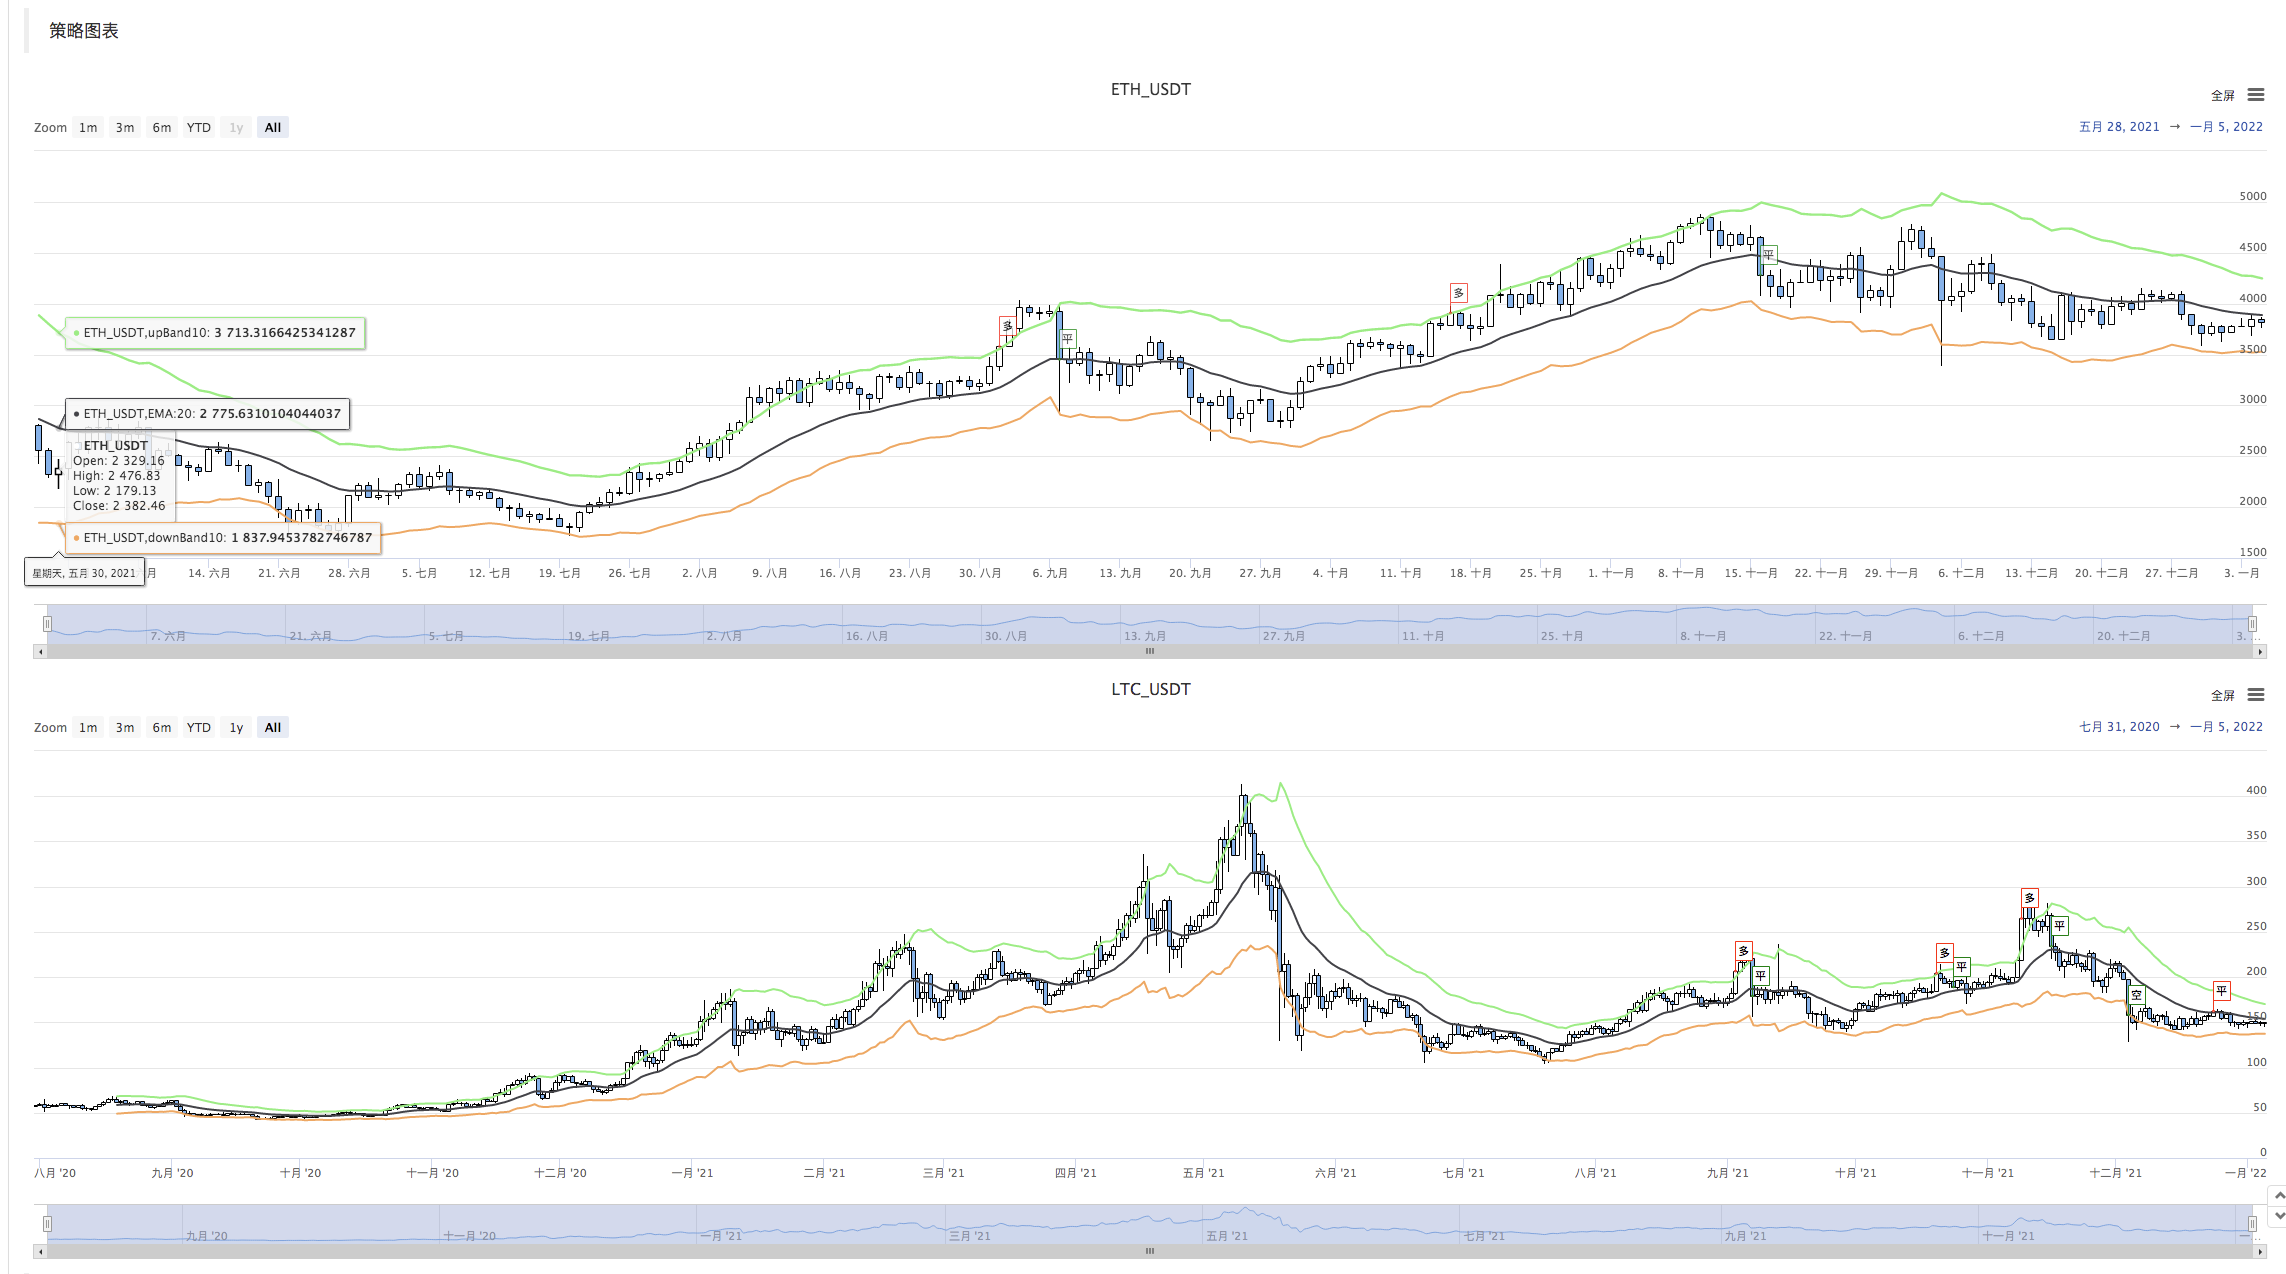
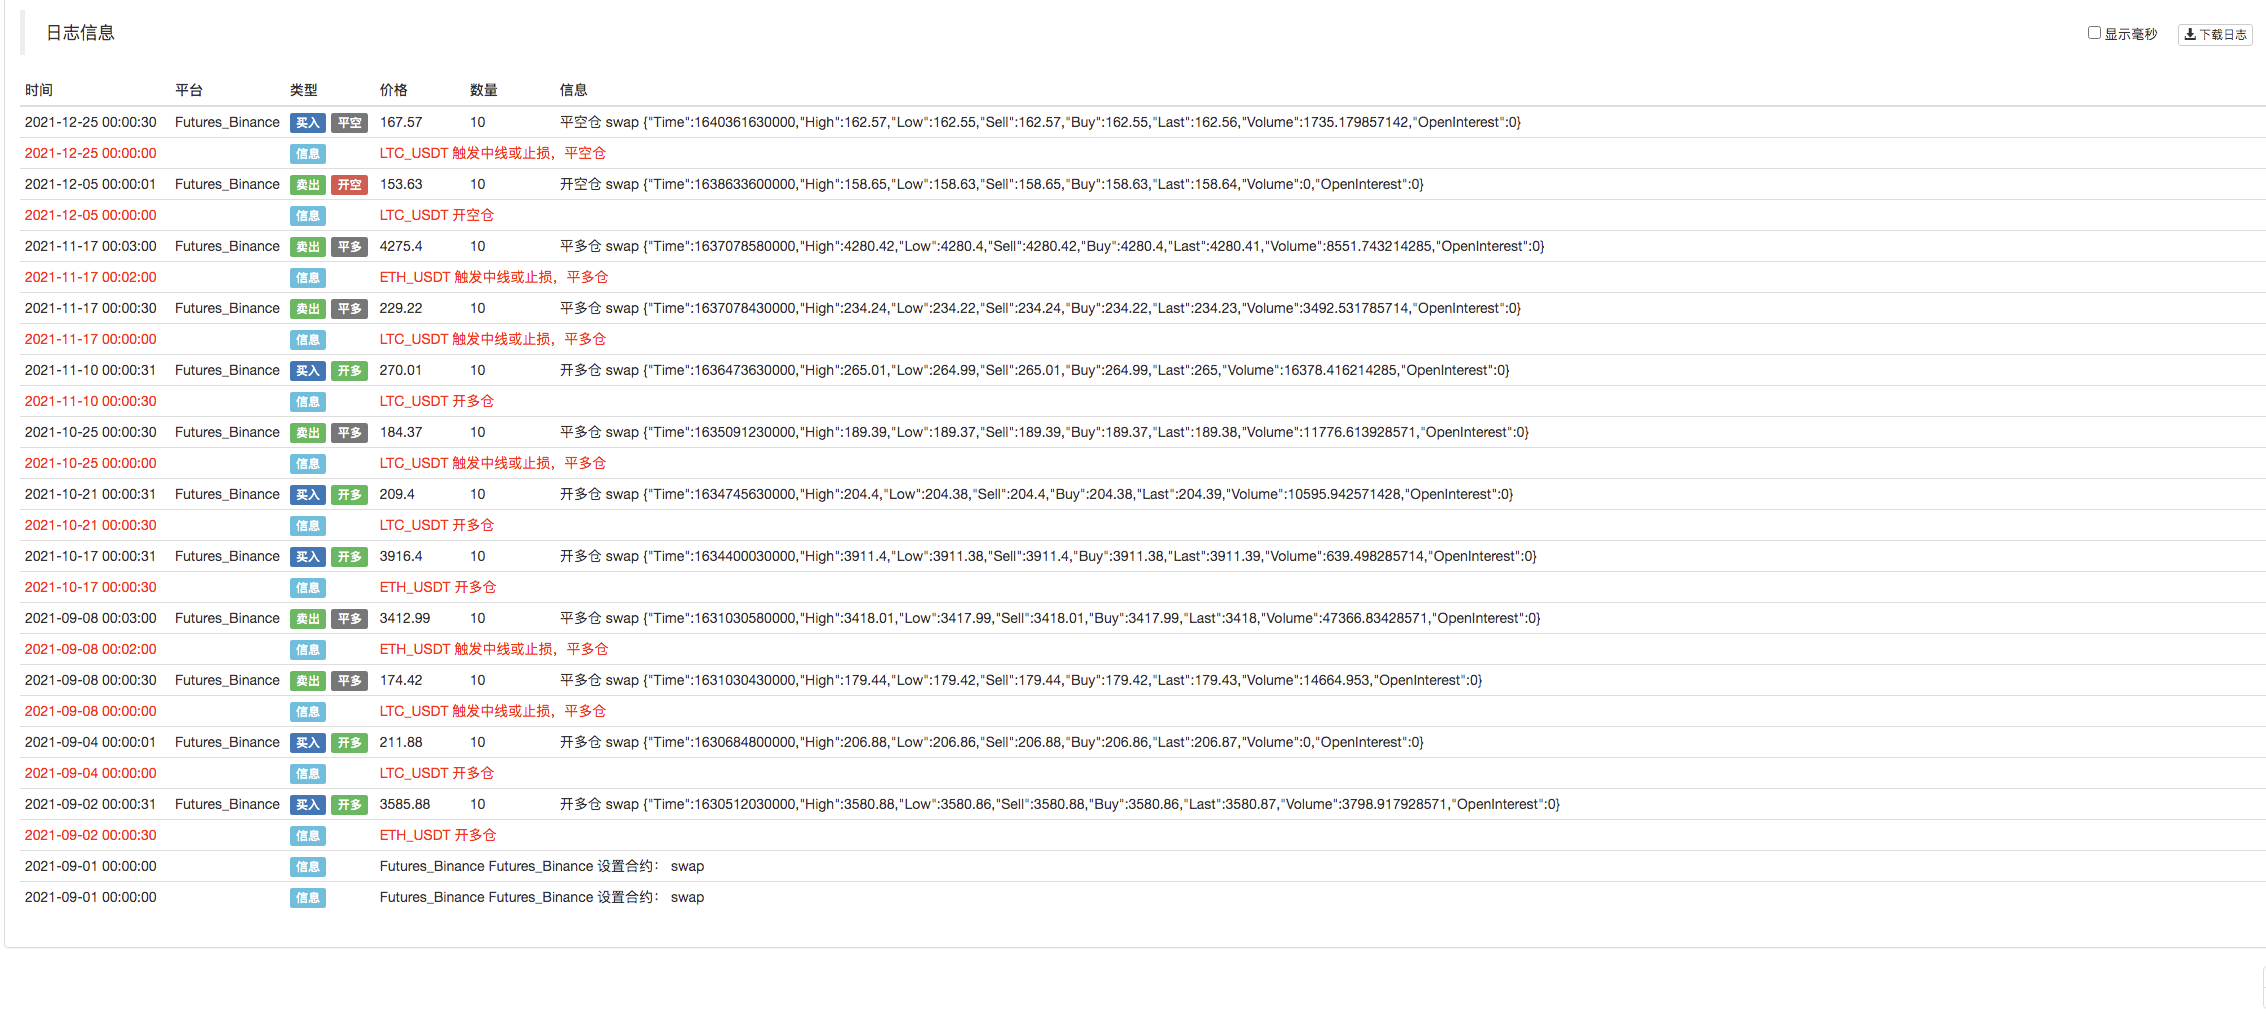
Ujian belakang


Kod Sumber Strategi:https://www.fmz.com/strategy/339344
Strategi ini hanya digunakan untuk komunikasi dan kajian; untuk kegunaan praktikal, anda perlu mengubah suai, menyesuaikan dan mengoptimumkannya sendiri.
- Masalah nilai muka
- Contoh Reka Bentuk Strategi dYdX
- Penjelajahan Awal Menggunakan Python Crawler di FMZ
Penjelajahan Kandungan Pengumuman Binance - Penyelidikan Reka Bentuk Strategi Hedge & Contoh Perintah Tunggu Spot dan Masa Depan
- Keadaan terkini dan operasi disyorkan strategi kadar pembiayaan
- Strategi titik pemutusan purata bergerak berganda niaga hadapan cryptocurrency (Pengajaran)
- Cryptocurrency Spot Multi-Symbol Dual Moving Average Strategy (Pengajaran)
- Mencapai Fisher Indicator dalam JavaScript & Plotting pada FMZ
- Pengurus
- 2021 Ulasan TAQ Cryptocurrency & Strategi Termudah yang Terlewatkan Peningkatan 10 Kali
- Peningkatan! Cryptocurrency Futures Strategi Martingale
- Fungsi Getrecords tidak dapat mendapatkan grafik K dalam unit saat
- Reka bentuk Sistem Pengurusan Sinkron Berasaskan Perintah FMZ (2)
- Data Volume yang dikembalikan oleh Getticker adalah salah.
- Reka bentuk Sistem Pengurusan Sinkron berdasarkan Perintah FMZ (1)
- Merancang Perpustakaan Plot Berbilang Carta
- Kawasan piringan analog
- Kod 60 baris mewujudkan satu pemikiran - Kontrak memancing bawah
- Pengumuman Peningkatan & Penyesuaian Sistem Bil FMZ
- Notis untuk Strategi Ghostwriting di FMZ