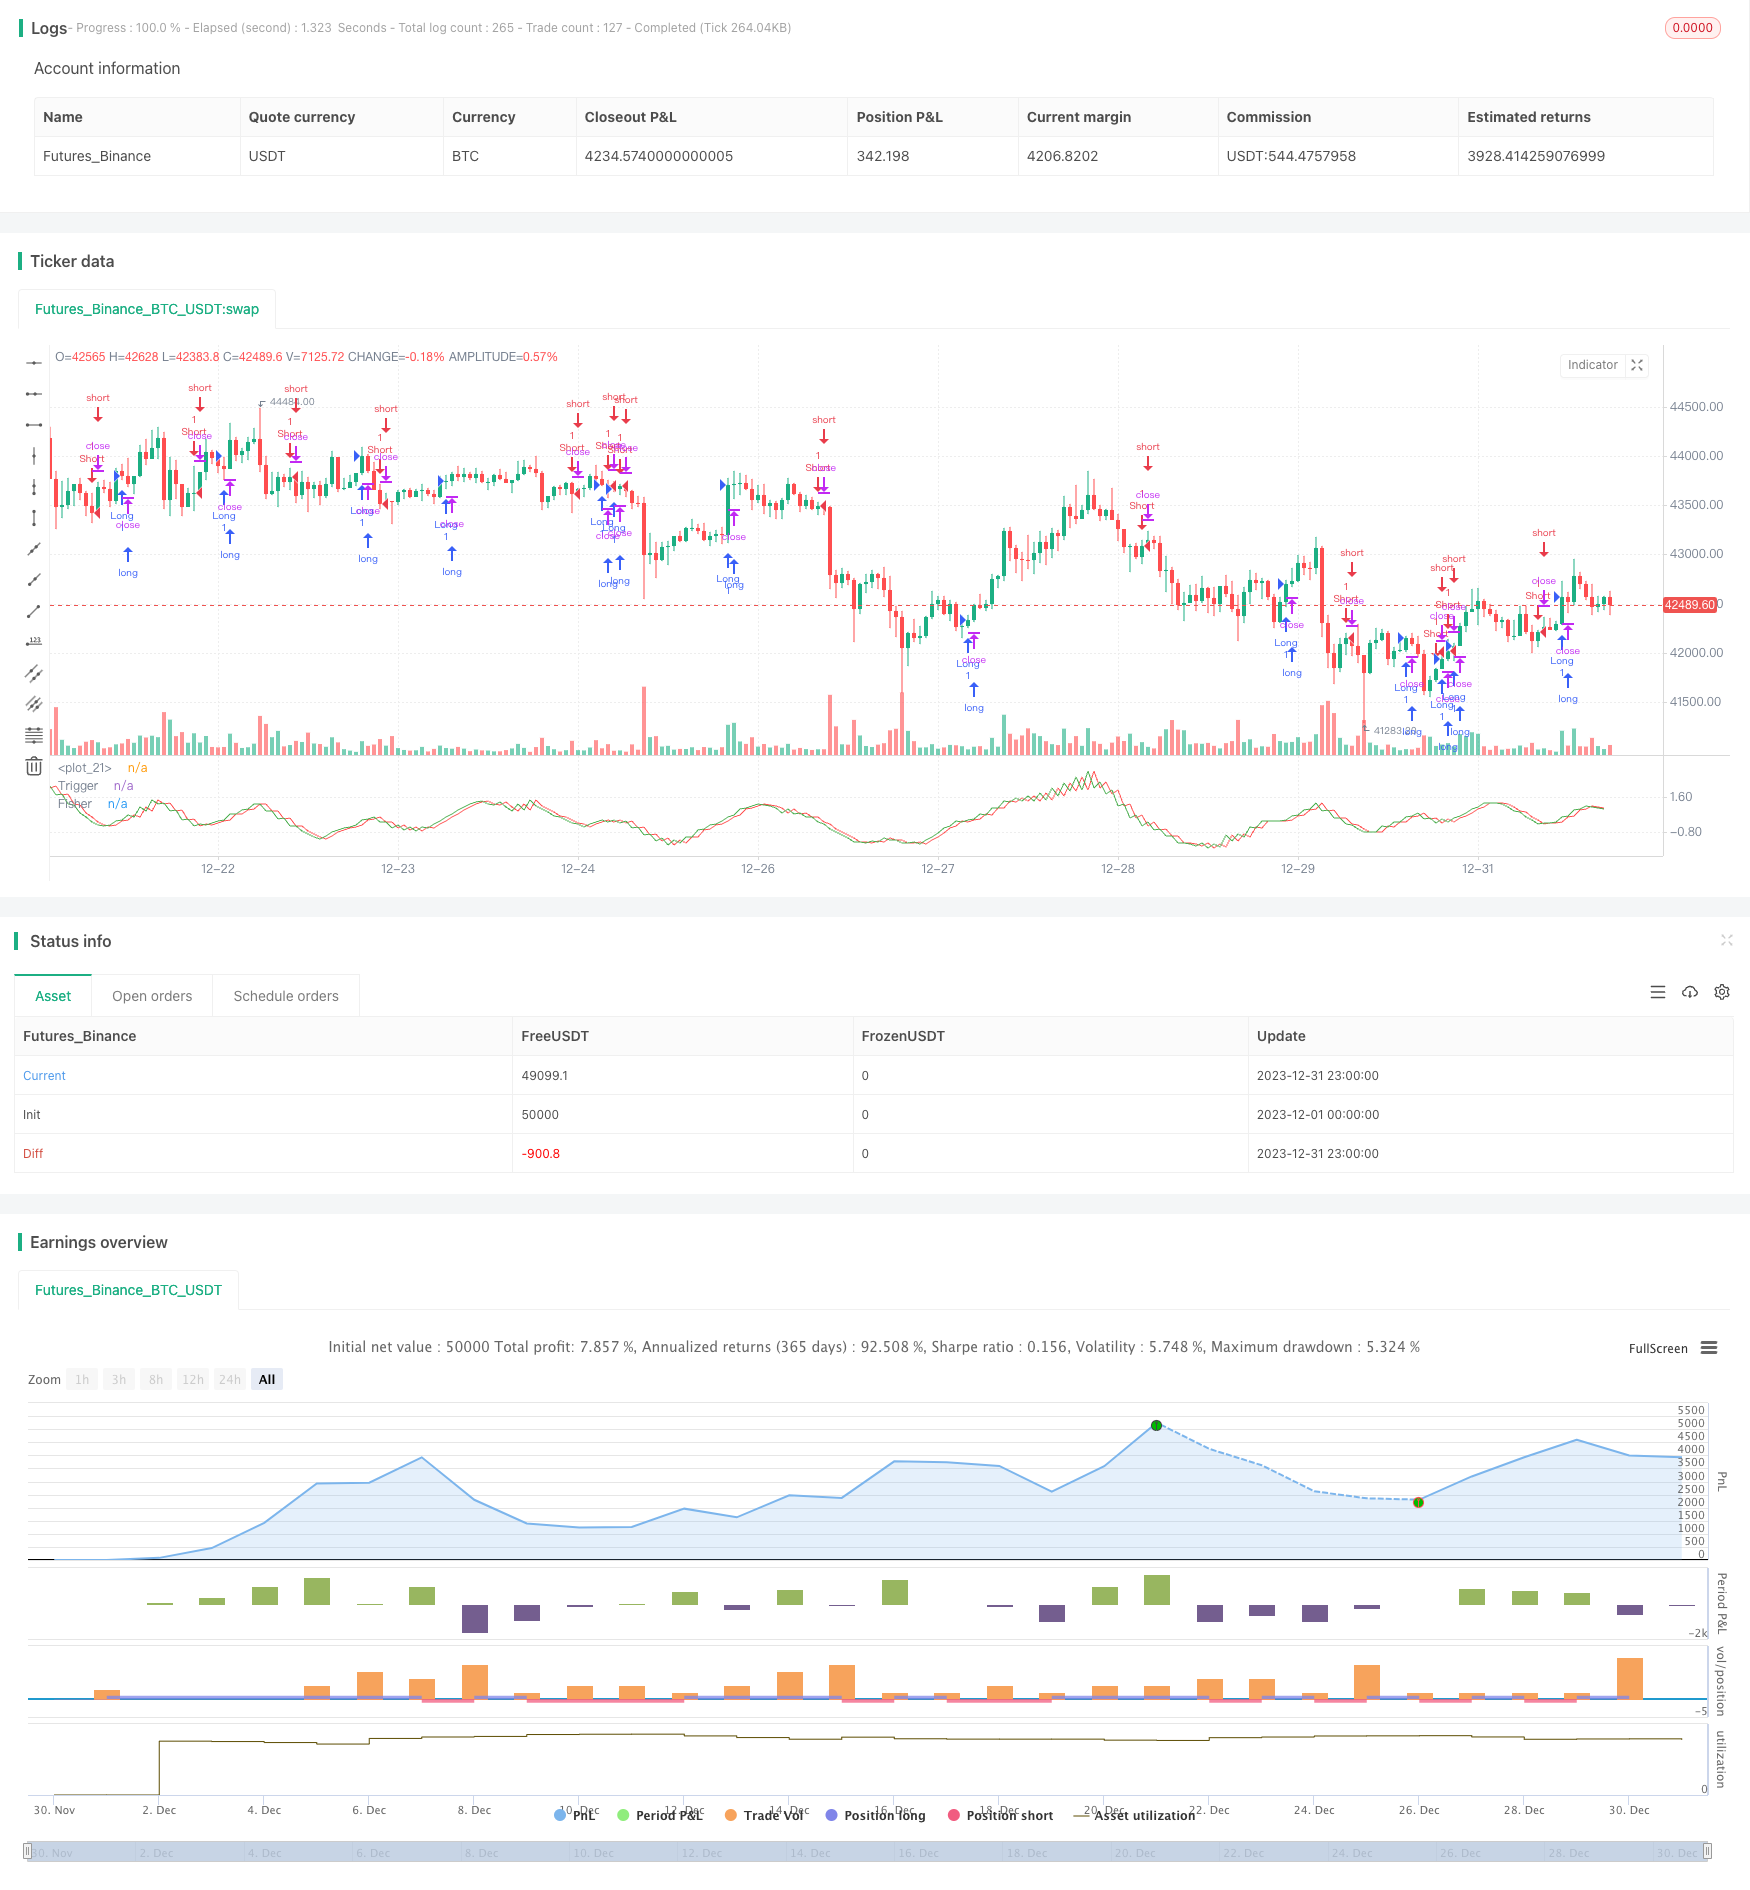
Fisher Transform Indicator Backtesting Strategy

Gambaran keseluruhan
Strategi ini adalah strategi pengulangan berdasarkan indikator Fisher Conversion. Formula Fisher Conversion dapat mengubah data harga menjadi sebaran normal, yang digunakan untuk mengenal pasti titik-titik harga dan titik-titik perubahan. Strategi ini digabungkan dengan indikator Fisher Conversion untuk menentukan trend harga, untuk mewujudkan perdagangan automatik.
Prinsip Strategi
- Pengiraan HL2
- HAL2 dalam tempoh Length terkini xMaxH dan xMinL
- Mengira Indeks Perubahan Fisher:
- nValue1 ialah 0.33 × ((HL2 standard) + 0.67 × nValue1 pada satu kitaran sebelumnya
- nValue2 had nValue1 antara -0.99 dan 0.99
- Penukaran nFish ke fungsi logarithmik nValue2
- Periksa apakah nFish adalah positif atau negatif dan tentukan arah kedudukan
- Isyarat Posisi Possig, jika ditetapkan untuk berdagang ke belakang, kedudukan akan ditarik balik
- Kemasukan: Possig = 1 buat lebih, possig =-1 buat kosong
Analisis kelebihan strategi
- Indeks Fisher Conversion dapat mengenal pasti titik puncak dan titik perubahan harga dan menentukan trend dengan tepat
- Menambah kadar kemenangan dengan penapisan HL2
- Perdagangan terbalik boleh diatur untuk menyesuaikan diri dengan keadaan pasaran yang berbeza
- Automasi urus niaga, mengurangkan kos urus niaga
Analisis risiko
- Indeks Pertukaran Fisher terlewat, mungkin terlepas perubahan harga garis pendek
- Kemerosotan tren gempa bumi berisiko tinggi
- Pengaturan perdagangan terbalik yang tidak betul boleh menyebabkan perdagangan yang salah secara sistematik
- Tidak mengambil kira pengesahan jangka masa, terdapat risiko positif palsu tertentu
Penyelesaian risiko:
- Menyesuaikan parameter dengan betul untuk mengurangkan kelewatan
- Meningkatkan markah stop loss dan mengawal kerugian tunggal
- Optimumkan penapisan reverse trading dengan penunjuk lain
- Menambah trend, peringkat harga, dan pelbagai pengesahan
Arah pengoptimuman strategi
- Penapisan indikator trend untuk memastikan trend besar konsisten
- Menambah penunjuk gelombang untuk meningkatkan ketepatan penilaian harga
- Semakan berkala untuk mengelakkan positif palsu
- Dinamika penyesuaian stop loss
- Parameter pengoptimuman, kemenangan maksimum dan faktor keuntungan
Strategi pengoptimuman di atas dapat meningkatkan lagi peluang kemenangan strategi, mengunci keuntungan, dan mengawal risiko, sehingga menghasilkan hasil perdagangan yang lebih stabil dan cekap.
ringkaskan
Strategi pengesanan kembali indikator Fisher yang mengintegrasikan indikator Fisher yang mengubah untuk menentukan titik perubahan harga dan arah trend. Strategi ini membuat keputusan yang tepat, tahap automasi yang tinggi, hasil perdagangan yang stabil dan cekap dapat diperoleh melalui pengoptimuman parameter. Tetapi ada juga risiko tertentu seperti ketinggalan, positif palsu, dan lain-lain, yang memerlukan pengenalan mekanisme pengesahan berulang dan cara penyesuaian dinamik yang lebih dioptimumkan untuk menjadikan strategi lebih fleksibel dan kasar.
/*backtest
start: 2023-12-01 00:00:00
end: 2023-12-31 23:59:59
period: 1h
basePeriod: 15m
exchanges: [{"eid":"Futures_Binance","currency":"BTC_USDT"}]
*/

//@version = 2
////////////////////////////////////////////////////////////
//  Copyright by HPotter v2.0 22/12/2016
// 	Market prices do not have a Gaussian probability density function
// 	as many traders think. Their probability curve is not bell-shaped.
// 	But trader can create a nearly Gaussian PDF for prices by normalizing
// 	them or creating a normalized indicator such as the relative strength
// 	index and applying the Fisher transform. Such a transformed output
// 	creates the peak swings as relatively rare events.
// 	Fisher transform formula is: y = 0.5 * ln ((1+x)/(1-x))
// 	The sharp turning points of these peak swings clearly and unambiguously
// 	identify price reversals in a timely manner.
//
//  For signal used zero.
// You can change long to short in the Input Settings
// Please, use it only for learning or paper trading. Do not for real trading.
////////////////////////////////////////////////////////////
strategy(title="Fisher Transform Indicator by Ehlers Backtest", shorttitle="Fisher Transform Indicator by Ehlers")
Length = input(10, minval=1)
reverse = input(false, title="Trade reverse")
hline(1, color=white)
xHL2 = hl2
xMaxH = highest(xHL2, Length)
xMinL = lowest(xHL2,Length)
nValue1 = 0.33 * 2 * ((xHL2 - xMinL) / (xMaxH - xMinL) - 0.5) + 0.67 * nz(nValue1[1])
nValue2 =   iff(nValue1 > .99,  .999,
	         iff(nValue1 < -.99, -.999, nValue1))
nFish = 0.5 * log((1 + nValue2) / (1 - nValue2)) + 0.5 * nz(nFish[1])
pos = iff(nFish > 0, 1,
	   iff(nFish < 0, -1, nz(pos[1], 0)))
possig = iff(reverse and pos == 1, -1,
          iff(reverse and pos == -1, 1, pos))
if (possig == 1)
    strategy.entry("Long", strategy.long)
if (possig == -1)
    strategy.entry("Short", strategy.short)
// barcolor(possig == -1 ? red: possig == 1 ? green : blue )
plot(nFish, color=green, title="Fisher")
plot(nz(nFish[1]), color=red, title="Trigger")