Тенденция после стратегии, основанной на динамическом стоп-лосе двойного кроссовера EMA
Автор:Чао Чжан, Дата: 2024-01-29 09:57:20Тэги:

Обзор
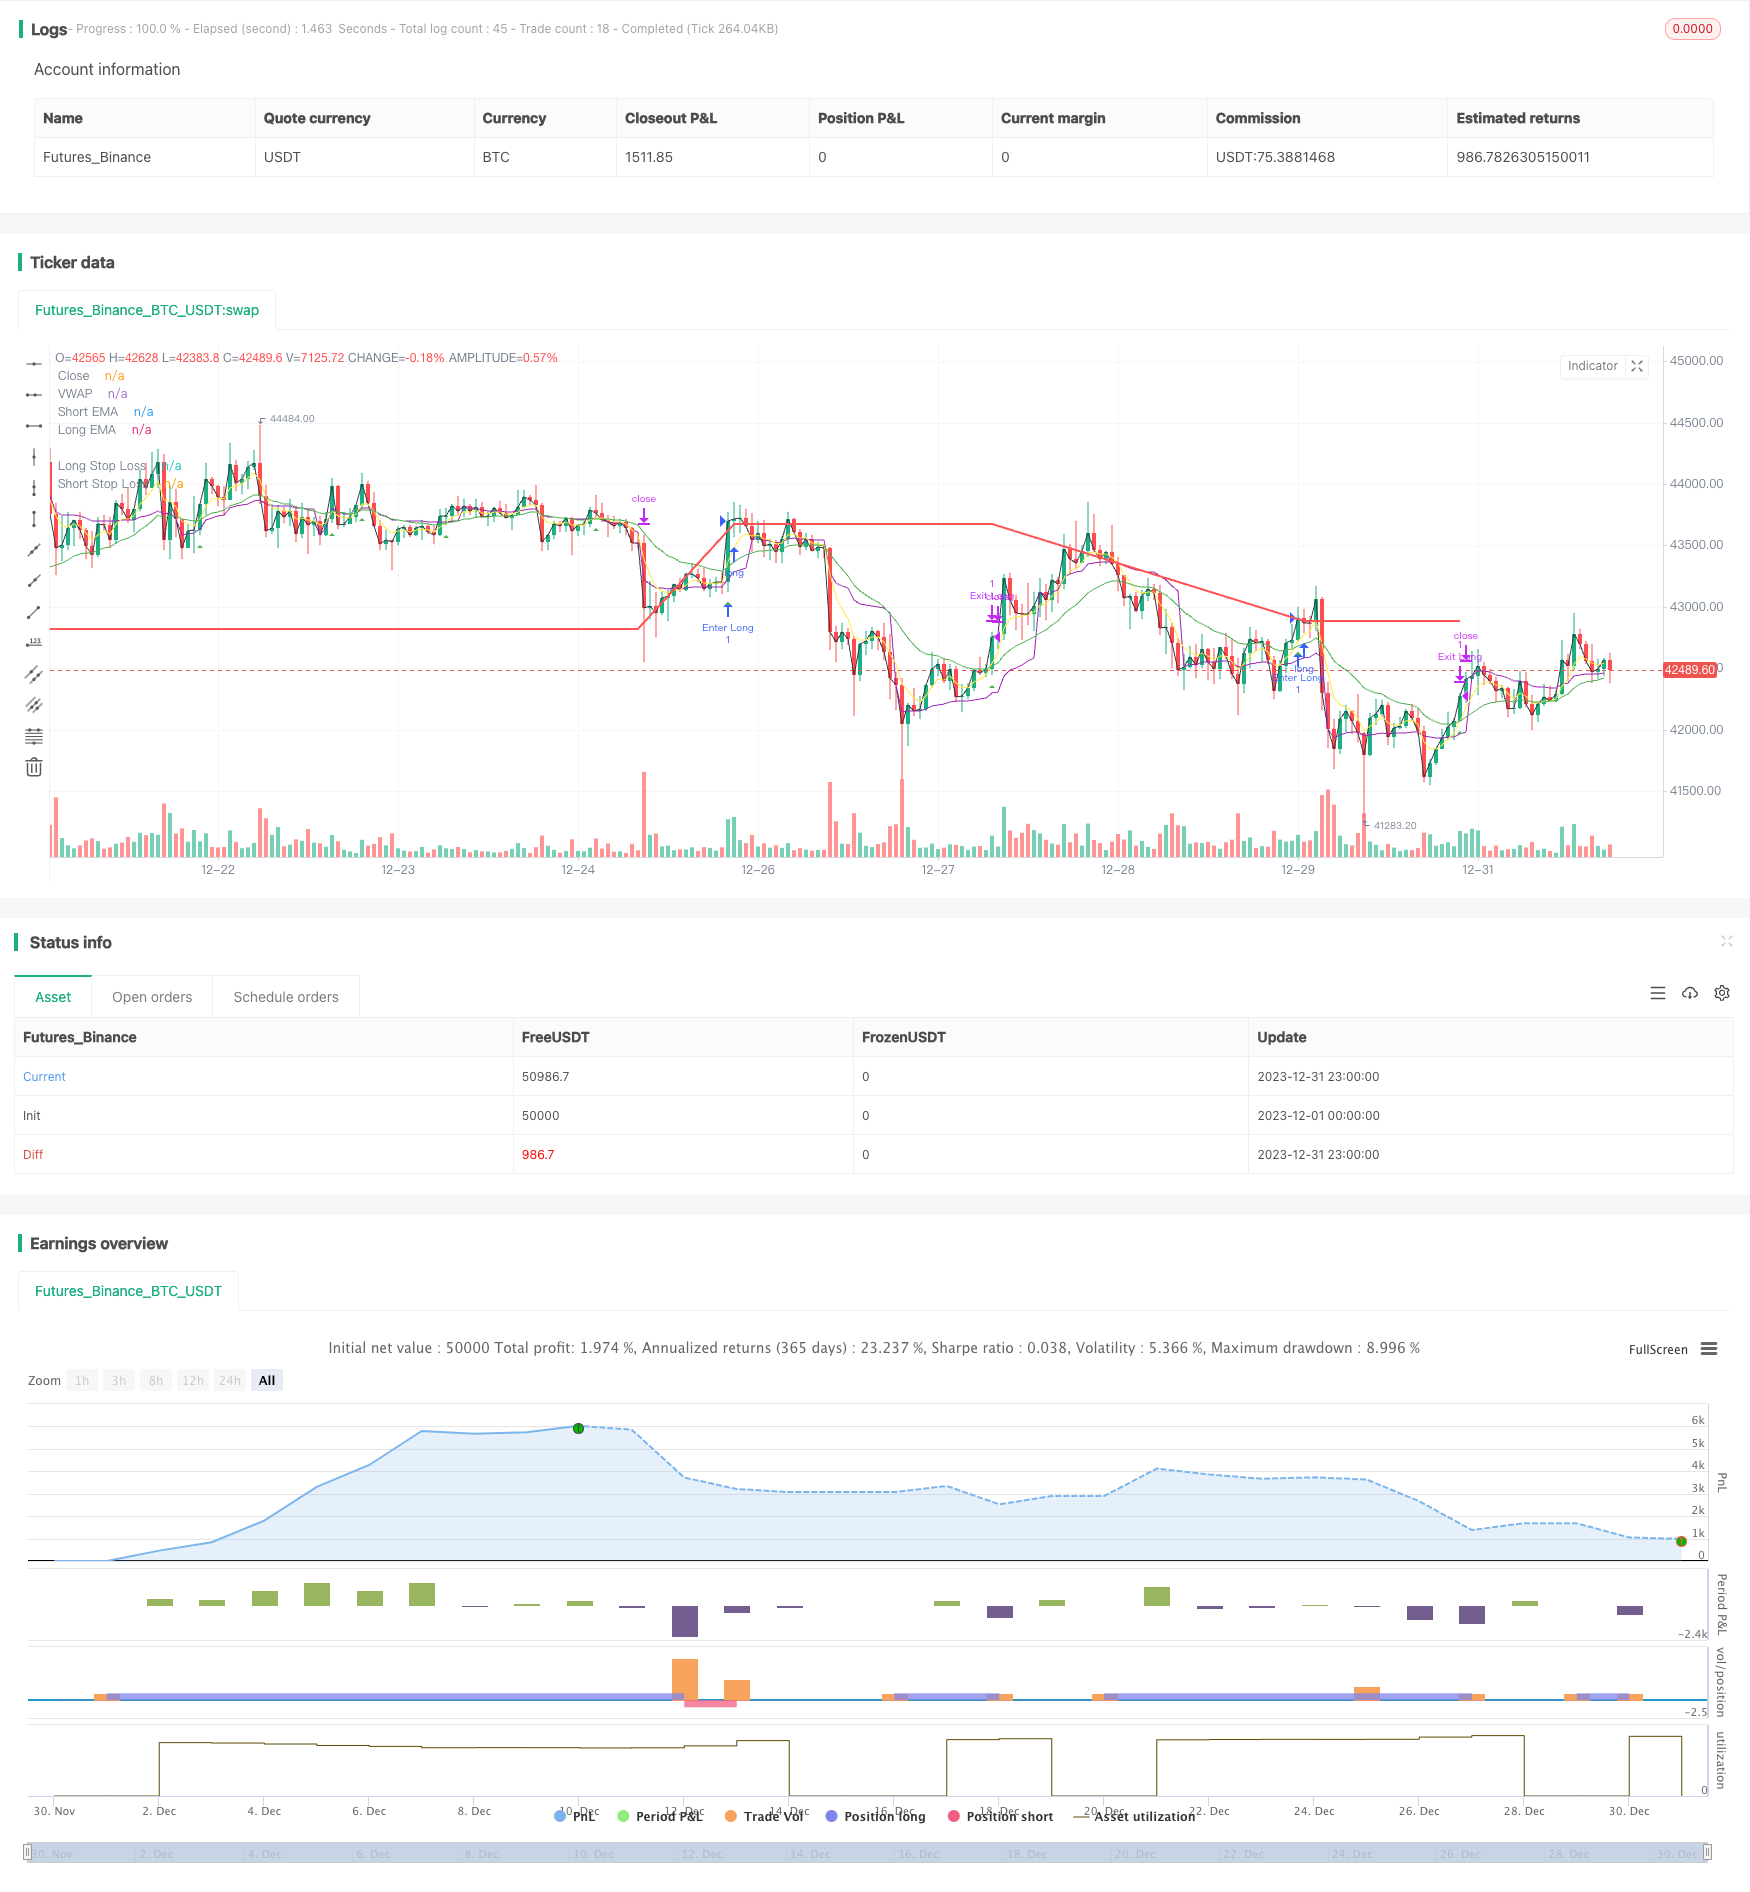
Эта стратегия использует золотой крест и мертвый крест линий EMA для двустороннего следования тренду и устанавливает динамические линии остановки потерь для длинных и коротких позиций для улавливания движений тренда на рынке.
Логика стратегии
- Вычислить линию быстрой EMA (5-дневная) и линию медленной EMA (20-дневная)
- Идите длинный, когда быстрая линия пересекает над медленной линией снизу; Идите короткий, когда быстрая линия пересекает ниже медленной линии сверху
- После длинного входа установить динамический стоп-лосс по цене входа * (1 - процент длинного стоп-лосса); после короткого входа установить динамический стоп-лосс по цене входа * (1 + процент короткого стоп-лосса)
- Позиция выхода со стоп-лосом после того, как цена достигнет уровня стоп-лосса
Анализ преимуществ
- Линии EMA имеют более сильные возможности в отслеживании тенденций.
- Динамические стоп-лосс движется вместе с прибылью, максимизируя тренд ловить прибыль
- Дополнительный фильтр с vwap избегает попадания в ловушку и улучшает качество сигнала
Анализ рисков
- В качестве чисто тенденционной стратегии, она уязвима для различных рынков с
- Слишком свободные стоп-потери могут привести к увеличению потерь
- Отставание сигналов EMA может привести к потере лучших входных точек
Улучшения, такие как управление рисками на основе ATR, оптимизация правил остановки потерь, добавление фильтровых индикаторов и т. д., могут помочь улучшить стратегию.
Руководство по улучшению
- Включить динамические индикаторы остановки потери, такие как ATR или DONCH, чтобы установить лучшие адаптивные остановки
- Добавьте больше индикаторов фильтрации, таких как MACD, KDJ, чтобы избежать плохих сделок
- Оптимизировать параметры для поиска лучшей комбинации длин EMA
- Использование методов машинного обучения для обнаружения оптимальных параметров
Заключение
В заключение, это очень типичный тренд, следующий за стратегией. Двойной перекресток EMA с динамической остановкой потери может эффективно блокировать прибыль от тренда. Тем временем риски, такие как отстающие сигналы и широкомасштабные остановки, все еще существуют. Благодаря настройке параметров, управлению рисками, добавлению фильтров и т. Д., Дальнейшее усовершенствование может привести к лучшим результатам.
/*backtest
start: 2023-12-01 00:00:00
end: 2023-12-31 23:59:59
period: 1h
basePeriod: 15m
exchanges: [{"eid":"Futures_Binance","currency":"BTC_USDT"}]
*/

//@version=5

strategy("EMA Crossover Strategy", shorttitle="EMAC", overlay=true,calc_on_every_tick=true)

// Input parameters
shortEmaLength = input(5, title="Short EMA Length")
longEmaLength = input(20, title="Long EMA Length")
priceEmaLength = input(1, title="Price EMA Length")

// Set stop loss level with input options (optional)
longLossPerc = input.float(0.05, title="Long Stop Loss (%)",
     minval=0.0, step=0.1) * 0.01

shortLossPerc = input.float(0.05, title="Short Stop Loss (%)",
     minval=0.0, step=0.1) * 0.01

// Calculating indicators
shortEma = ta.ema(close, shortEmaLength)
longEma = ta.ema(close, longEmaLength)
//priceEma = ta.ema(close, priceEmaLength)
vwap = ta.vwap(close)

// Long entry conditions
longCondition = ta.crossover(shortEma, longEma) and close > vwap
// Short entry conditions
shortCondition = ta.crossunder(shortEma, longEma) and close > vwap

// STEP 2:
// Determine stop loss price
longStopPrice  = strategy.position_avg_price * (1 - longLossPerc)
shortStopPrice = strategy.position_avg_price * (1 + shortLossPerc)


if (longCondition)
    strategy.entry("Enter Long", strategy.long)
    strategy.exit("Exit Long",from_entry = "Enter Long",stop= longStopPrice)
plotshape(series=longCondition, title="Long Signal", color=color.green, style=shape.triangleup, location=location.belowbar)


if (shortCondition)
    strategy.entry("Enter Short", strategy.short)
    strategy.exit("Exit Short", from_entry = "Enter Short",stop = shortStopPrice)
plotshape(series=shortCondition, title="Short Signal", color=color.red, style=shape.triangledown, location=location.abovebar)

// Stop loss levels
//longStopLoss = (1 - stopLossPercent) * close
//shortStopLoss = (1 + stopLossPercent) * close

// Exit conditions
//strategy.exit("Long", from_entry="Long", loss=longStopLoss)
//strategy.exit("Short", from_entry="Short", loss=shortStopLoss)

// Plotting indicators on the chart
plot(shortEma, color=color.yellow, title="Short EMA")
plot(longEma, color=color.green, title="Long EMA")
plot(close, color=color.black, title="Close")
plot(vwap, color=color.purple, title="VWAP")

// Plot stop loss values for confirmation
plot(strategy.position_size > 0 ? longStopPrice : na,
     color=color.red, style=plot.style_line,
     linewidth=2, title="Long Stop Loss")

plot(strategy.position_size < 0 ? shortStopPrice : na,
     color=color.blue, style=plot.style_line,
     linewidth=2, title="Short Stop Loss")
// Plotting stop loss lines
//plot(longStopLoss, color=color.red, title="Long Stop Loss", linewidth=2, style=plot.style_line)
//plot(shortStopLoss, color=color.aqua, title="Short Stop Loss", linewidth=2, style=plot.style_line)
- Стратегия межциклического арбитража, основанная на нескольких показателях
- Стратегия прорыва полосы Боллинджера - это долгосрочная стратегия преследования импульса.
- Беспрецедентная стратегию количественной торговли на основе двойных BB-индикаторов и RSI
- Стратегия стоп-лосса и прибыли, основанная на РСИ
- Стратегия прорыва перемещающегося среднего канала
- Стратегия тестирования с фиксированным временным отрывом
- Время и пространство Оптимизированная многовременная стратегия MACD
- Количественная стратегия торговли, основанная на РСИ акций и МФИ
- Многопоказательная комплексная стратегия торговли
- Краткосрочная стратегия торговли через ЕМА
- Стратегия выхода на бычий рынок
- Стратегия относительной динамики
- Волновая тенденция и тенденция, основанная на VWMA в соответствии со стратегией Quant
- Стратегия комбинации двойной скользящей средней и средней Уильямса
- Стратегия перекрестного использования скользящей средней
- Многопоказательная количественная стратегия торговли
- Ключевая стратегия обратного теста
- Три стратегии EMA по стохастическому RSI Crossover Golden Cross