جائزہ
اس کیمیائی حکمت عملی میں بنیادی طور پر پیرا لائیو SAR اشارے ((PSAR) اور اشاریہ منتقل اوسط ((EMA) کے کراس سگنل کا استعمال کیا جاتا ہے ، جس میں متعدد اپنی مرضی کے مطابق شرائط شامل ہیں ، جو خریدنے اور فروخت کرنے کے سگنل پیدا کرتی ہیں۔ حکمت عملی کا بنیادی نظریہ یہ ہے کہ: جب پی ایس اے آر نیچے سے ای ایم اے کو توڑتا ہے اور کچھ شرائط کو پورا کرتا ہے تو خریدنے کا سگنل پیدا ہوتا ہے۔ جب پی ایس اے آر اوپر سے ای ایم اے کو توڑتا ہے اور کچھ شرائط کو پورا کرتا ہے تو فروخت کا سگنل پیدا ہوتا ہے۔
حکمت عملی کا اصول
- پی ایس اے آر اور 30 سیکنڈ ای ایم اے کا حساب لگائیں
- پی ایس اے آر اور ای ایم اے کے مابین کراس ریلیشن کا فیصلہ کریں اور اس کے مطابق نشان لگائیں
- پی ایس اے آر اور ای ایم اے کے مقام کے تعلقات ، کے لائن کے رنگ وغیرہ کے ساتھ ، آئی جی سی (آئیڈیل گرین موم بتی) اور آئی آر سی (آئیڈیل ریڈ موم بتی) کی وضاحت کریں
- آئی جی سی اور آئی آر سی کے ذریعہ خرید و فروخت کے سگنل کا تعین
- اسٹاپ اور اسٹاپ نقصان کی حد مقرر کریں ، اسٹاپ نقصان کی حد خرید قیمت کا 8٪ ، 16٪ اور 32٪ ہے ، اسٹاپ نقصان کی حد خرید قیمت کا 16٪ ہے ، فروخت قیمت کا 8٪ ، 16٪ اور 32٪ ہے ، اور اسٹاپ نقصان کی حد فروخت قیمت کا 16٪ ہے
- تجارت کے وقت اور پوزیشن ہولڈنگ کی حیثیت کے مطابق خرید و فروخت یا پوزیشن پر عملدرآمد
اسٹریٹجک فوائد
- متعدد اشارے اور شرائط کے ساتھ مل کر ، سگنل کی وشوسنییتا میں اضافہ
- ایک سے زیادہ سٹاپ اور سٹاپ نقصان کے ساتھ، لچکدار خطرے اور منافع کو کنٹرول کرنے کے لئے
- مختلف مارکیٹ کے حالات کے لئے خرید و فروخت کے فلٹرنگ کے حالات کو ترتیب دیں ، حکمت عملی کی موافقت کو بہتر بنائیں
- اعلی ماڈیولر کوڈ ، آسانی سے سمجھنے اور ترمیم کرنے کے لئے
اسٹریٹجک رسک
- حکمت عملی کے پیرامیٹرز کی ترتیبات تمام مارکیٹ کے حالات کے لئے موزوں نہیں ہوسکتی ہیں اور انہیں حقیقی حالات کے مطابق ایڈجسٹ کرنے کی ضرورت ہے۔
- ہلچل والی منڈیوں میں ، اس حکمت عملی سے بار بار ٹریڈنگ سگنل ہوسکتے ہیں ، جس سے تجارت کی لاگت میں اضافہ ہوتا ہے۔
- اس حکمت عملی میں مارکیٹ کے رجحانات کا اندازہ لگانے کا فقدان ہے ، جس سے مضبوط رجحانات والے بازاروں میں مواقع ضائع ہوسکتے ہیں۔
- اسٹاپ نقصان کی پوزیشنوں کو مکمل طور پر انتہائی رجحانات کے خطرے سے بچنے کے لئے ممکن نہیں ہے
حکمت عملی کی اصلاح کی سمت
- سگنل کی درستگی اور وشوسنییتا کو بہتر بنانے کے لئے مزید تکنیکی اشارے یا مارکیٹ کے جذبات کے اشارے متعارف کروائیں
- سٹاپ اور سٹاپ نقصان کی ترتیبات کو بہتر بنانے کے لئے، متحرک سٹاپ نقصان یا اتار چڑھاؤ کی بنیاد پر سٹاپ نقصان متعارف کرانے پر غور کیا جا سکتا ہے
- مارکیٹ کی مختلف حالتوں کے لئے مختلف ٹریڈنگ پیرامیٹرز اور قواعد مرتب کریں ، حکمت عملی کو بہتر بنائیں
- فنڈ مینجمنٹ ماڈیول میں شامل ہونا ، اکاؤنٹ میں ایکویٹی تناسب توازن جیسے عوامل کے مطابق پوزیشنوں اور خطرے کی نمائش کو متحرک طور پر ایڈجسٹ کرنا
خلاصہ کریں۔
پی ایس اے آر اور ای ایم اے کے اشارے پر مبنی ، ایک سے زیادہ اپنی مرضی کے مطابق شرائط اور قواعد کے ذریعہ خرید و فروخت کے اشارے پیدا کرنے والی ایک مقداری حکمت عملی۔ حکمت عملی میں کچھ لچک اور لچک ہے ، اور اس کے ساتھ ساتھ خطرے کو کنٹرول کرنے کے لئے اسٹاپ نقصان کی پوزیشن بھی رکھی گئی ہے۔ تاہم ، حکمت عملی کے پیرامیٹرز کی ترتیب اور خطرے کو کنٹرول کرنے کے لئے اصلاح کی گنجائش ہے۔ مجموعی طور پر ، یہ حکمت عملی ایک بنیادی نمونہ کے طور پر کام کر سکتی ہے ، جس میں مزید اصلاح اور بہتری کے ساتھ ، ایک مستحکم تجارتی حکمت عملی بننے کا امکان ہے۔
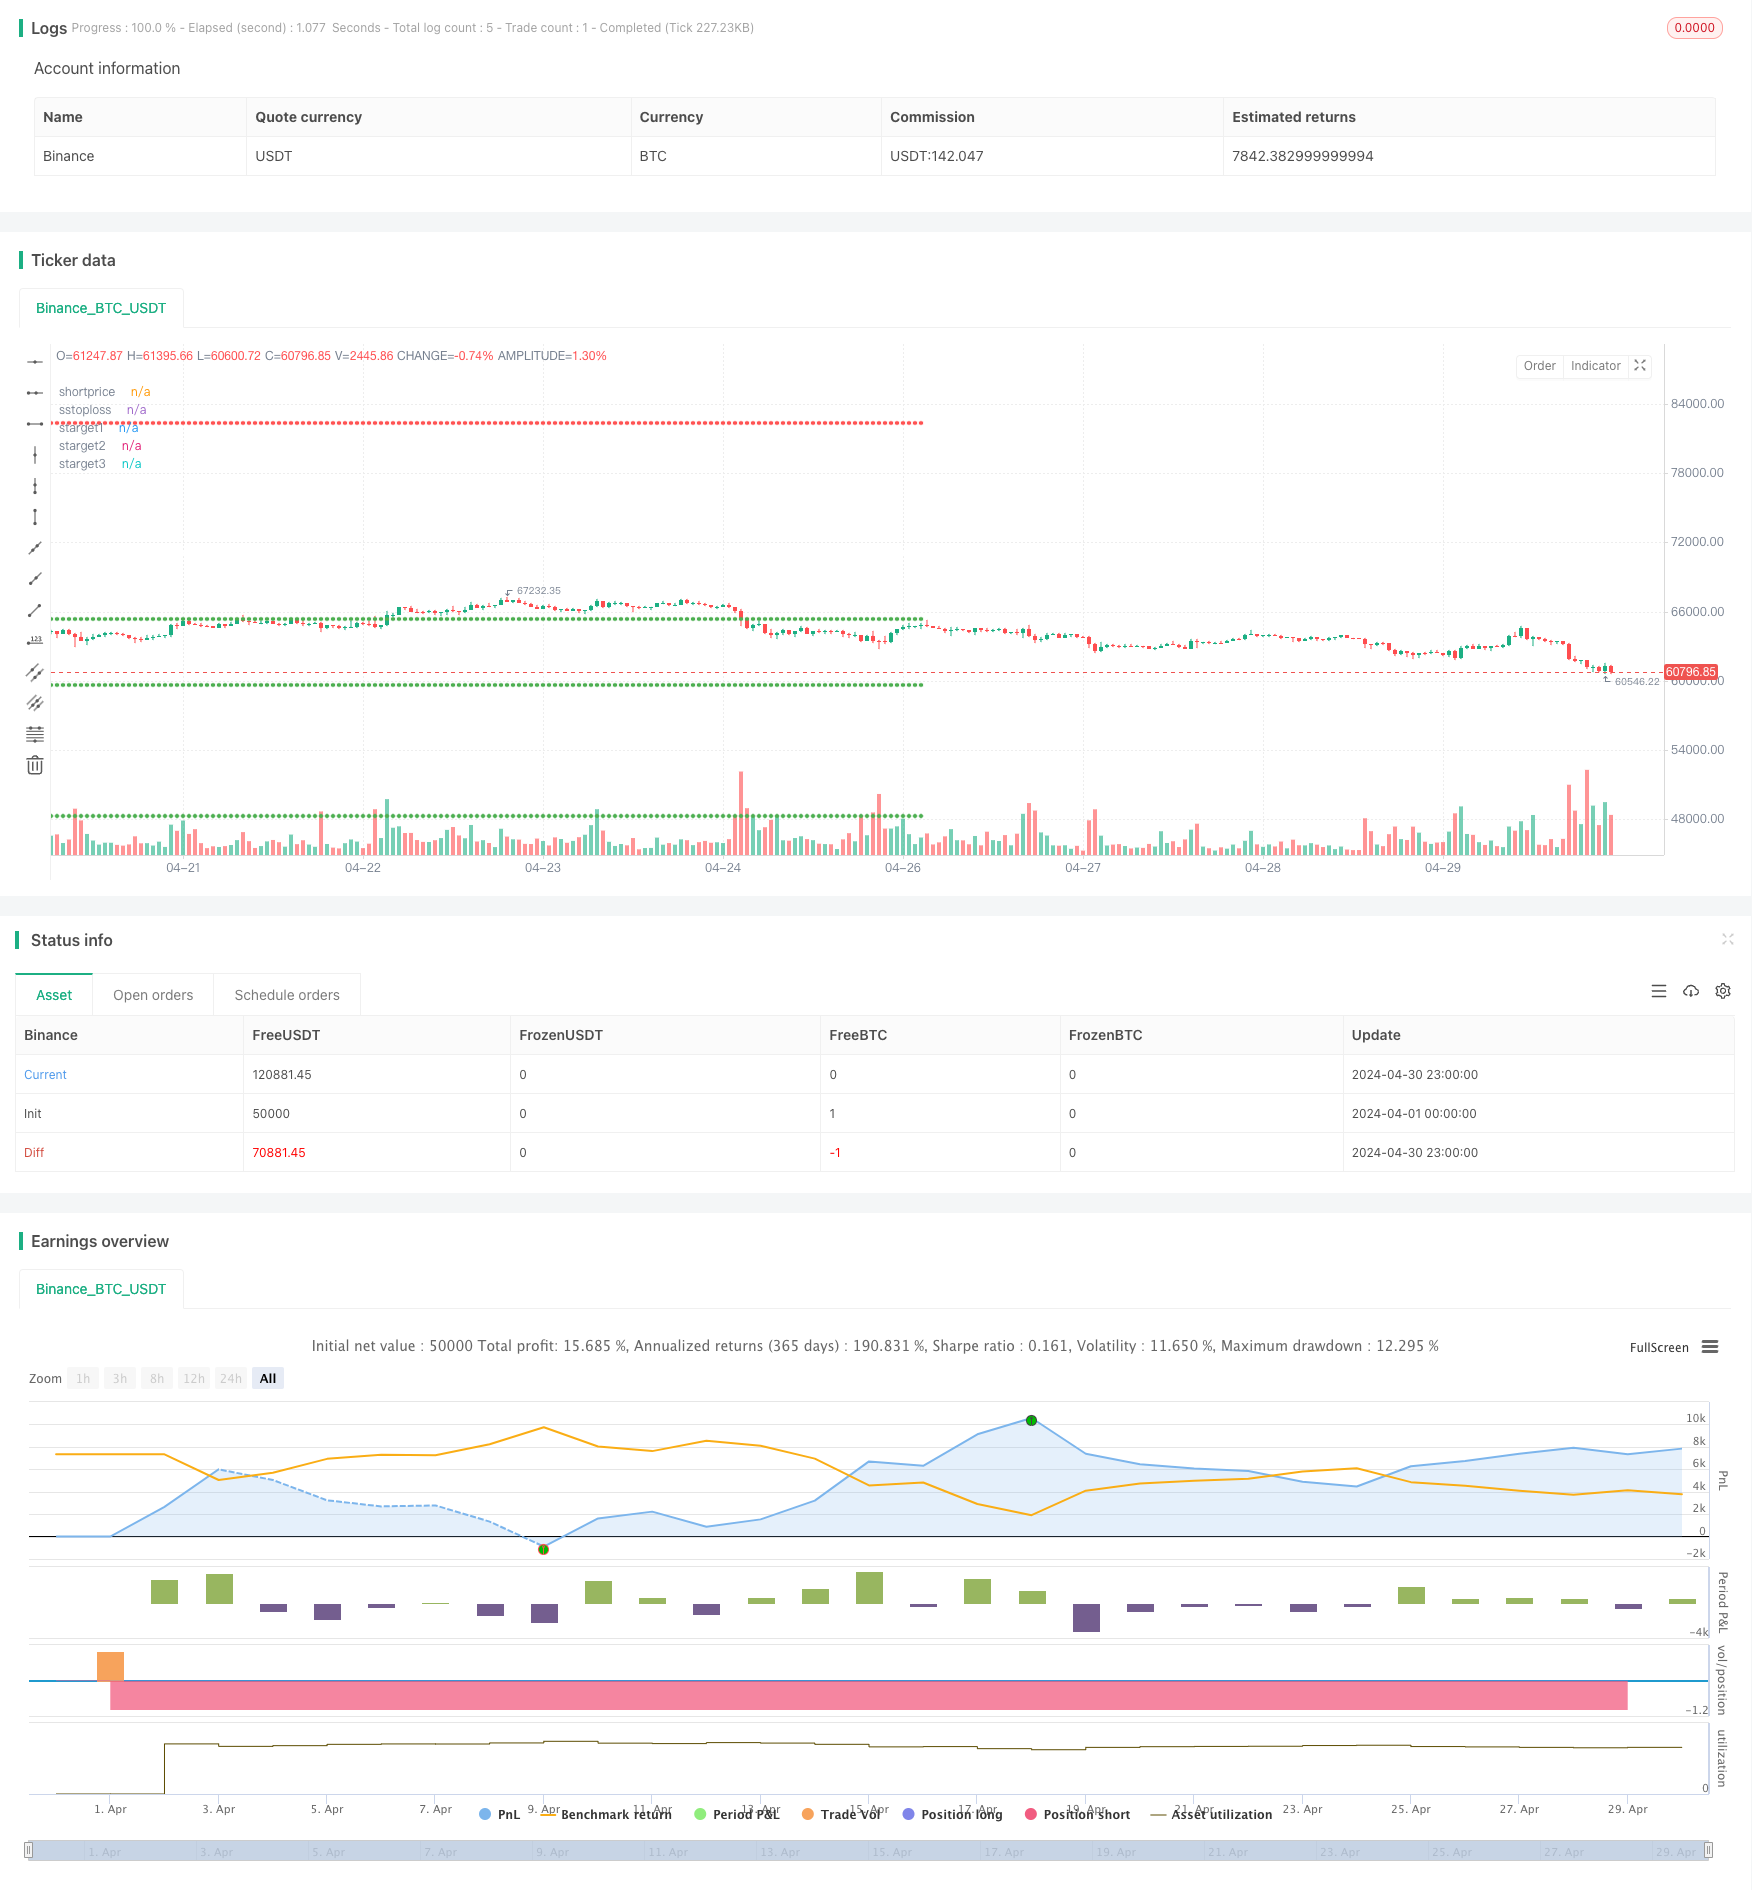
/*backtest
start: 2024-04-01 00:00:00
end: 2024-04-30 23:59:59
period: 1h
basePeriod: 15m
exchanges: [{"eid":"Binance","currency":"BTC_USDT"}]
*/

// This Pine Script™ code is subject to the terms of the Mozilla Public License 2.0 at https://mozilla.org/MPL/2.0/
// © SwapnilRaykar

//@version=5
strategy("aj sir second project", overlay=true, margin_long=100, margin_short=100)

start=input("0915-1515","session time")
st11=time(timeframe.period,start)
st=st11>0
et= not st

psar=ta.sar(0.02,0.02,0.2)
emared=ta.ema(close,30)
//plot(psar,"psar",color.yellow,style = plot.style_cross)
//plot(emared,"emared",color.red)
var crodownflag=0
var croupflag=0

var igcflag=0

var ircflag=0

cdown1=ta.crossunder(psar,emared)  and not (psar<close and psar[1]>close[1])
cup1=ta.crossover(psar,emared) and not (psar>close and psar[1]<close[1])

cdown=ta.crossunder(psar,emared)
cup=ta.crossover(psar,emared)


green_candle=close>open
red_candle=close<open

if ta.crossunder(psar,emared) and crodownflag==0  and not (psar<close and psar[1]>close[1])
    crodownflag:=1
else if cdown and crodownflag==1
    crodownflag:=0


if crodownflag==1 and green_candle and igcflag==0
    igcflag:=1
else if cdown and igcflag==1
    igcflag:=0

//plot(igcflag,"igcflag",color.lime)

if ta.crossover(psar,emared) and croupflag==0 and not (psar>close and psar[1]<close[1])
    croupflag:=1
else if cdown and croupflag==1
    croupflag:=0

//plot(crodownflag,"crodownflag",color.white)
irc_cond=croupflag==1 or cup

if (croupflag==1 and red_candle and ircflag==0)
    ircflag:=1
else if cup and croupflag==1
    ircflag:=0

igc_candle1=(igcflag==1 and igcflag[1]==0) or (cdown1 and green_candle)
irc_candle1=(ircflag==1 and ircflag[1]==0) or (cup1 and red_candle)
///////////////////////////
dm=dayofmonth(time)
newday=dm!=dm[1]
dmc=dm==ta.valuewhen(bar_index==last_bar_index,dm,0)

///////////////////////////////////////////
var irc_there=0

if irc_candle1[1] and irc_there==0
    irc_there:=1
else if cdown and irc_there==1
    irc_there:=0

irc_candle=irc_candle1 and irc_there==0// and dmc

var igc_there=0

if igc_candle1[1] and igc_there==0
    igc_there:=1
else if cup and igc_there ==1
    igc_there:=0

igc_candle=igc_candle1 and igc_there==0// and dmc
/////////// to get rid of irc being valid even after crossdown
var valid_igc_low=0
var valid_irc_high=0

if irc_candle[1] and valid_irc_high==0
    valid_irc_high:=1
else if igc_candle and valid_irc_high==1
    valid_irc_high:=0

if igc_candle and valid_igc_low==0
    valid_igc_low:=1
else if irc_candle and valid_igc_low==1
    valid_igc_low:=0


igc_low=ta.valuewhen(igc_candle,low,0)
irc_high=ta.valuewhen(irc_candle,high,0)
//////////////////////////////
//plot(irc_high,"irc_high",color.red)

//plot(valid_irc_high,"valid_irc_high",color.purple)

buy12=ta.crossunder(close,igc_low) and valid_igc_low==1
buy1=buy12[1]

short12=ta.crossover(close,irc_high) and valid_irc_high==1
short1=short12[1]
//plotshape(short12,"short12",shape.arrowdown,color=color.purple)

// plotshape(igc_candle,"igc_candle",shape.arrowdown,color=color.green)
// plotshape(irc_candle,"irc_candle",shape.arrowdown,color=color.red)
//plotshape((psar<close and psar[1]>close[1]) ,"croup",shape.arrowdown,color=color.red)
//plotshape(cup ,"croup",shape.arrowdown,color=color.orange)

buyprice=ta.valuewhen(buy1 and strategy.position_size[1]==0,open,0)
shortprice=ta.valuewhen(short1 and strategy.position_size[1]==0,open,0)

btarget1=buyprice+(buyprice*0.08)
btarget2=buyprice+(buyprice*0.16)
btarget3=buyprice+(buyprice*0.32)
bstoploss=buyprice-(buyprice*0.16)

starget1=shortprice-(shortprice*0.08)
starget2=shortprice-(shortprice*0.16)
starget3=shortprice-(shortprice*0.32)
sstoploss=shortprice+(shortprice*0.16)

if buy12 and strategy.position_size==0 and st11
    strategy.entry("buy",strategy.long)

if strategy.position_size >0
    strategy.exit("sell",from_entry = "buy",stop=bstoploss,limit=btarget3)

if short12 and strategy.position_size==0 and st11
    strategy.entry("short",strategy.short)

if strategy.position_size<0
    strategy.exit("cover",from_entry = "short",stop = sstoploss,limit = starget3)

if et
    strategy.close_all(comment = "timeover")

plot(strategy.position_size>0?buyprice:na,"buyprice",color.white, style=plot.style_circles )
plot(strategy.position_size>0?bstoploss:na,"bstoploss",color.red, style=plot.style_circles )
plot(strategy.position_size>0?btarget1:na,"btarget1",color.green, style=plot.style_circles )
plot(strategy.position_size>0?btarget2:na,"btarget2",color.green, style=plot.style_circles )
plot(strategy.position_size>0?btarget3:na,"btarget3",color.green, style=plot.style_circles )

plot(strategy.position_size<0?shortprice:na,"shortprice",color.white, style=plot.style_circles )
plot(strategy.position_size<0?sstoploss:na,"sstoploss",color.red, style=plot.style_circles )
plot(strategy.position_size<0?starget1:na,"starget1",color.green, style=plot.style_circles )
plot(strategy.position_size<0?starget2:na,"starget2",color.green, style=plot.style_circles )
plot(strategy.position_size<0?starget3:na,"starget3",color.green, style=plot.style_circles )