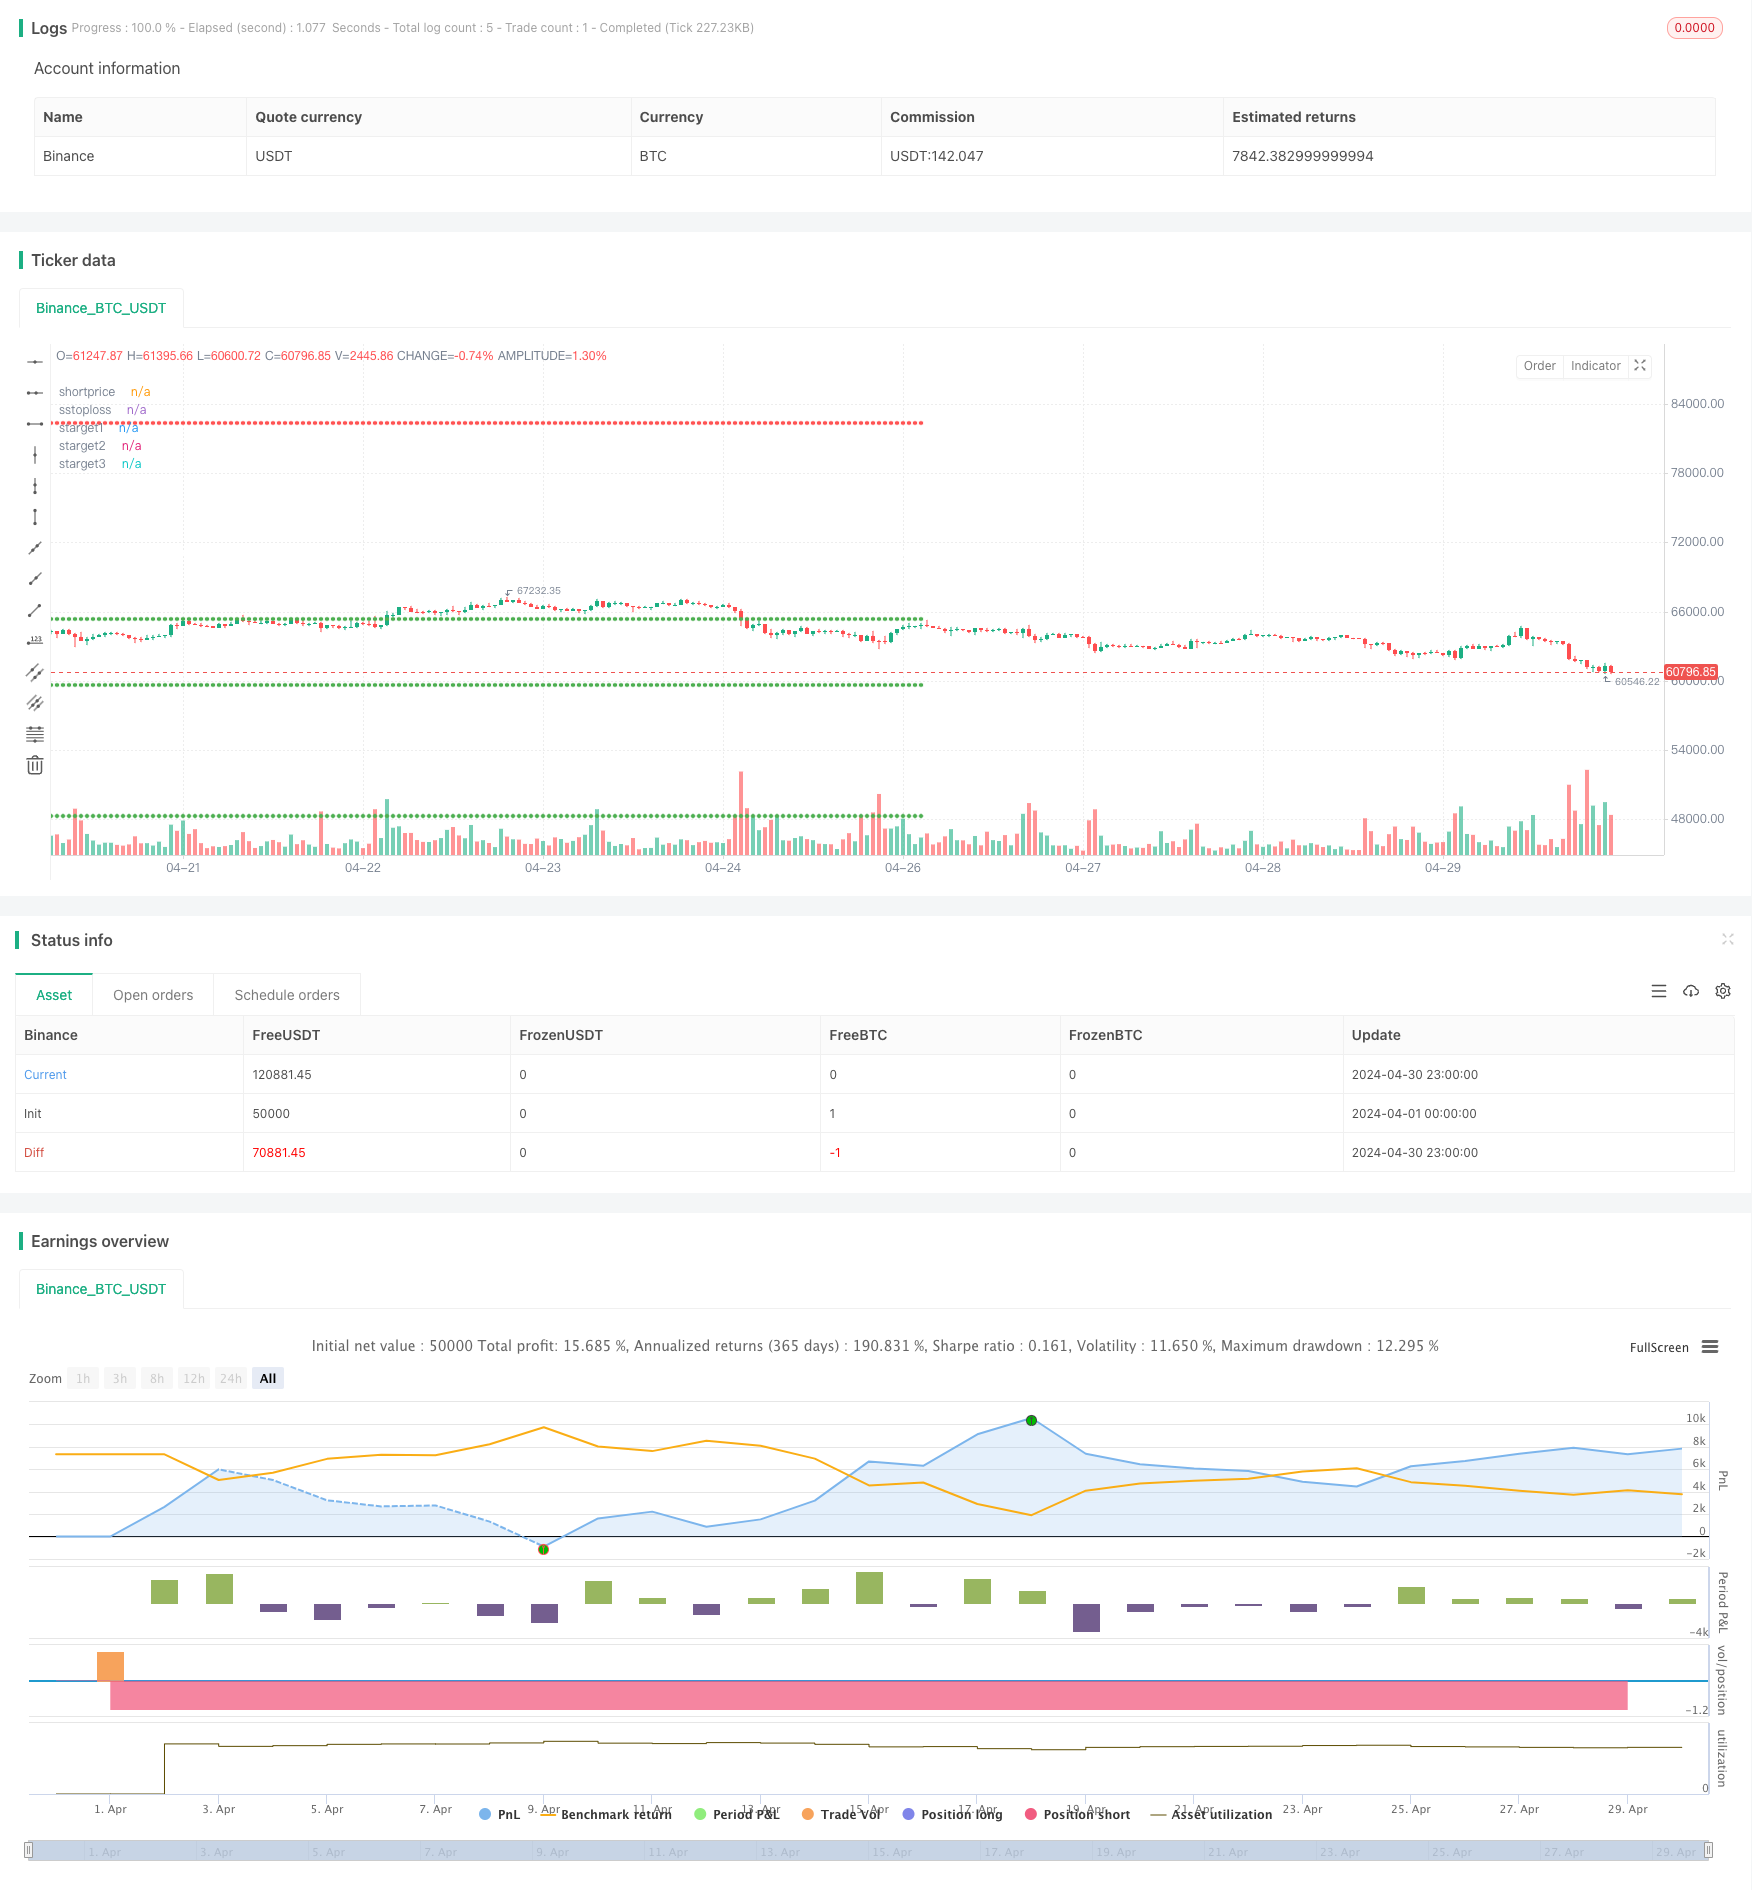
Tổng quan
Chiến lược định lượng này chủ yếu sử dụng tín hiệu chéo của các chỉ số SAR parallax ((PSAR) và đường trung bình di chuyển của chỉ số ((EMA) kết hợp với nhiều điều kiện tùy chỉnh để tạo ra tín hiệu mua và bán. Ý tưởng chính của chiến lược là: PSAR sẽ tạo ra tín hiệu mua khi nó phá vỡ EMA từ dưới và đáp ứng một số điều kiện nhất định; PSAR sẽ tạo ra tín hiệu bán khi nó phá vỡ EMA từ trên và đáp ứng một số điều kiện nhất định.
Nguyên tắc chiến lược
- Tính toán chỉ số PSAR và 30 chu kỳ EMA
- Xác định mối quan hệ chéo giữa PSAR và EMA và đặt dấu hiệu tương ứng
- Kết hợp các điều kiện như mối quan hệ vị trí của PSAR với EMA, màu của đường K, xác định IGC (Ideal Green Candle) và IRC (Ideal Red Candle)
- Sự xuất hiện của IGC và IRC để đánh giá các tín hiệu mua và bán
- Thiết lập Stop Stop và Stop Loss, Stop Stop là 8%, 16% và 32% giá mua; Stop Loss là 16% giá bán; Stop Loss là 16% giá bán
- Hoạt động mua, bán hoặc bán tháo tùy theo thời điểm giao dịch và tình trạng giữ vị trí
Lợi thế chiến lược
- Kết hợp nhiều chỉ số và điều kiện, tăng độ tin cậy của tín hiệu
- Có nhiều điểm dừng và điểm dừng để kiểm soát rủi ro và lợi nhuận một cách linh hoạt
- Điều kiện lọc mua và bán được thiết lập cho các tình huống thị trường khác nhau, giúp cải thiện khả năng thích ứng của chiến lược
- Mã có mức độ mô-đun cao, dễ hiểu và sửa đổi
Rủi ro chiến lược
- Cài đặt tham số của chiến lược có thể không phù hợp với tất cả các môi trường thị trường và cần điều chỉnh theo thực tế
- Trong một thị trường bất ổn, chiến lược này có thể dẫn đến các tín hiệu giao dịch thường xuyên, dẫn đến tăng chi phí giao dịch.
- Chiến lược này thiếu sự phán đoán về xu hướng thị trường và có thể bỏ lỡ cơ hội trong một thị trường có xu hướng mạnh
- Các thiết lập dừng lỗ có thể không hoàn toàn tránh được rủi ro từ các hoạt động cực đoan
Hướng tối ưu hóa chiến lược
- Tiếp tục giới thiệu nhiều chỉ số kỹ thuật hoặc chỉ số cảm xúc thị trường để tăng độ chính xác và độ tin cậy của tín hiệu
- Tối ưu hóa các thiết lập dừng và dừng lỗ, có thể xem xét giới thiệu dừng động hoặc dừng lỗ dựa trên tỷ lệ dao động
- Tăng khả năng thích ứng của chiến lược, thiết lập các tham số và quy tắc giao dịch khác nhau cho các tình trạng thị trường khác nhau
- Thêm mô-đun quản lý tài chính, điều chỉnh vị trí và rủi ro theo các yếu tố như cân bằng tỷ lệ vốn chủ sở hữu tài khoản
Tóm tắt
Chiến lược định lượng này dựa trên các chỉ số PSAR và EMA, tạo ra tín hiệu mua và bán thông qua nhiều điều kiện và quy tắc tùy chỉnh. Chiến lược có một số khả năng thích ứng và linh hoạt, đồng thời cũng thiết lập điểm dừng để kiểm soát rủi ro. Tuy nhiên, vẫn còn không gian tối ưu hóa về thiết lập tham số và kiểm soát rủi ro của chiến lược.
/*backtest
start: 2024-04-01 00:00:00
end: 2024-04-30 23:59:59
period: 1h
basePeriod: 15m
exchanges: [{"eid":"Binance","currency":"BTC_USDT"}]
*/

// This Pine Script™ code is subject to the terms of the Mozilla Public License 2.0 at https://mozilla.org/MPL/2.0/
// © SwapnilRaykar

//@version=5
strategy("aj sir second project", overlay=true, margin_long=100, margin_short=100)

start=input("0915-1515","session time")
st11=time(timeframe.period,start)
st=st11>0
et= not st

psar=ta.sar(0.02,0.02,0.2)
emared=ta.ema(close,30)
//plot(psar,"psar",color.yellow,style = plot.style_cross)
//plot(emared,"emared",color.red)
var crodownflag=0
var croupflag=0

var igcflag=0

var ircflag=0

cdown1=ta.crossunder(psar,emared)  and not (psar<close and psar[1]>close[1])
cup1=ta.crossover(psar,emared) and not (psar>close and psar[1]<close[1])

cdown=ta.crossunder(psar,emared)
cup=ta.crossover(psar,emared)


green_candle=close>open
red_candle=close<open

if ta.crossunder(psar,emared) and crodownflag==0  and not (psar<close and psar[1]>close[1])
    crodownflag:=1
else if cdown and crodownflag==1
    crodownflag:=0


if crodownflag==1 and green_candle and igcflag==0
    igcflag:=1
else if cdown and igcflag==1
    igcflag:=0

//plot(igcflag,"igcflag",color.lime)

if ta.crossover(psar,emared) and croupflag==0 and not (psar>close and psar[1]<close[1])
    croupflag:=1
else if cdown and croupflag==1
    croupflag:=0

//plot(crodownflag,"crodownflag",color.white)
irc_cond=croupflag==1 or cup

if (croupflag==1 and red_candle and ircflag==0)
    ircflag:=1
else if cup and croupflag==1
    ircflag:=0

igc_candle1=(igcflag==1 and igcflag[1]==0) or (cdown1 and green_candle)
irc_candle1=(ircflag==1 and ircflag[1]==0) or (cup1 and red_candle)
///////////////////////////
dm=dayofmonth(time)
newday=dm!=dm[1]
dmc=dm==ta.valuewhen(bar_index==last_bar_index,dm,0)

///////////////////////////////////////////
var irc_there=0

if irc_candle1[1] and irc_there==0
    irc_there:=1
else if cdown and irc_there==1
    irc_there:=0

irc_candle=irc_candle1 and irc_there==0// and dmc

var igc_there=0

if igc_candle1[1] and igc_there==0
    igc_there:=1
else if cup and igc_there ==1
    igc_there:=0

igc_candle=igc_candle1 and igc_there==0// and dmc
/////////// to get rid of irc being valid even after crossdown
var valid_igc_low=0
var valid_irc_high=0

if irc_candle[1] and valid_irc_high==0
    valid_irc_high:=1
else if igc_candle and valid_irc_high==1
    valid_irc_high:=0

if igc_candle and valid_igc_low==0
    valid_igc_low:=1
else if irc_candle and valid_igc_low==1
    valid_igc_low:=0


igc_low=ta.valuewhen(igc_candle,low,0)
irc_high=ta.valuewhen(irc_candle,high,0)
//////////////////////////////
//plot(irc_high,"irc_high",color.red)

//plot(valid_irc_high,"valid_irc_high",color.purple)

buy12=ta.crossunder(close,igc_low) and valid_igc_low==1
buy1=buy12[1]

short12=ta.crossover(close,irc_high) and valid_irc_high==1
short1=short12[1]
//plotshape(short12,"short12",shape.arrowdown,color=color.purple)

// plotshape(igc_candle,"igc_candle",shape.arrowdown,color=color.green)
// plotshape(irc_candle,"irc_candle",shape.arrowdown,color=color.red)
//plotshape((psar<close and psar[1]>close[1]) ,"croup",shape.arrowdown,color=color.red)
//plotshape(cup ,"croup",shape.arrowdown,color=color.orange)

buyprice=ta.valuewhen(buy1 and strategy.position_size[1]==0,open,0)
shortprice=ta.valuewhen(short1 and strategy.position_size[1]==0,open,0)

btarget1=buyprice+(buyprice*0.08)
btarget2=buyprice+(buyprice*0.16)
btarget3=buyprice+(buyprice*0.32)
bstoploss=buyprice-(buyprice*0.16)

starget1=shortprice-(shortprice*0.08)
starget2=shortprice-(shortprice*0.16)
starget3=shortprice-(shortprice*0.32)
sstoploss=shortprice+(shortprice*0.16)

if buy12 and strategy.position_size==0 and st11
    strategy.entry("buy",strategy.long)

if strategy.position_size >0
    strategy.exit("sell",from_entry = "buy",stop=bstoploss,limit=btarget3)

if short12 and strategy.position_size==0 and st11
    strategy.entry("short",strategy.short)

if strategy.position_size<0
    strategy.exit("cover",from_entry = "short",stop = sstoploss,limit = starget3)

if et
    strategy.close_all(comment = "timeover")

plot(strategy.position_size>0?buyprice:na,"buyprice",color.white, style=plot.style_circles )
plot(strategy.position_size>0?bstoploss:na,"bstoploss",color.red, style=plot.style_circles )
plot(strategy.position_size>0?btarget1:na,"btarget1",color.green, style=plot.style_circles )
plot(strategy.position_size>0?btarget2:na,"btarget2",color.green, style=plot.style_circles )
plot(strategy.position_size>0?btarget3:na,"btarget3",color.green, style=plot.style_circles )

plot(strategy.position_size<0?shortprice:na,"shortprice",color.white, style=plot.style_circles )
plot(strategy.position_size<0?sstoploss:na,"sstoploss",color.red, style=plot.style_circles )
plot(strategy.position_size<0?starget1:na,"starget1",color.green, style=plot.style_circles )
plot(strategy.position_size<0?starget2:na,"starget2",color.green, style=plot.style_circles )
plot(strategy.position_size<0?starget3:na,"starget3",color.green, style=plot.style_circles )