概述
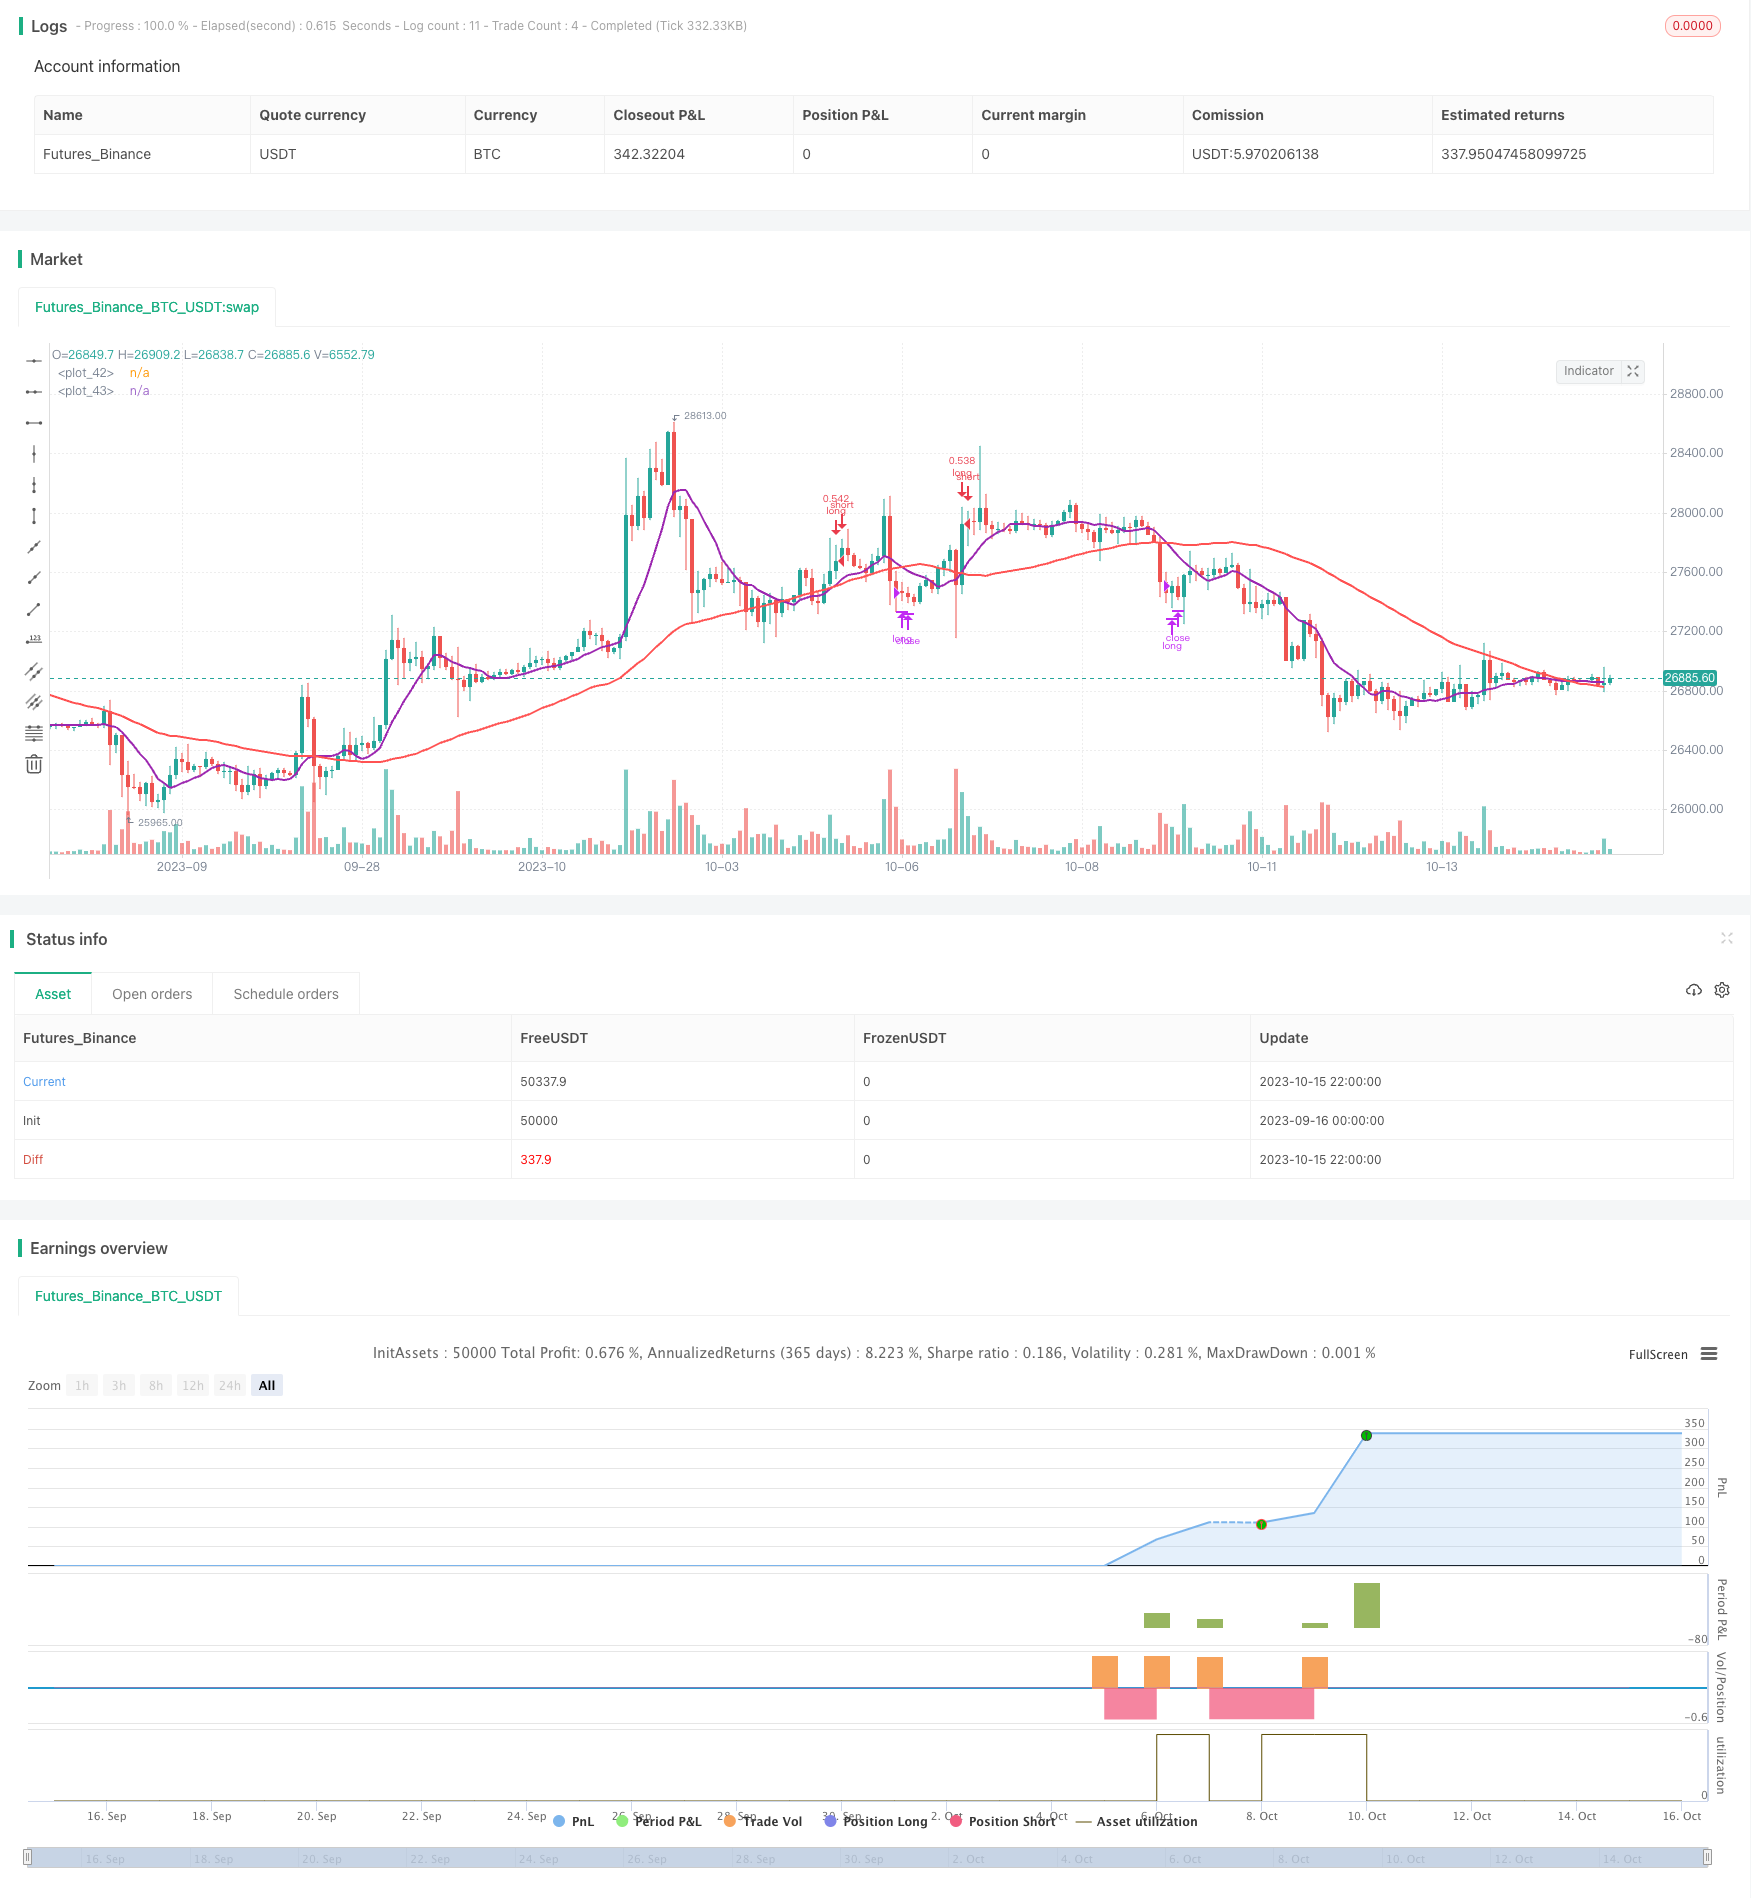
该策略运用两个不同周期的移动平均线的交叉来进行交易,属于趋势追踪型策略。策略利用短期和长期移动平均线交叉买入信号和卖出信号,在趋势行情中进行交易。
策略原理
该策略使用9周期的短期移动平均线SMA和50周期的长期移动平均线LMA。当短期移动平均线从下方上穿越长期移动平均线时,产生买入信号;当短期移动平均线从上方下穿长期移动平均线时,产生卖出信号。
同时,策略还引入RSI指标判断趋势强度。只有当RSI大于设定阈值(默认55)时,才会产生交易信号。这可以避免RSI处于超卖区间时产生错误信号。
策略每次交易资金占总资金的30%,每次只开一个订单。考虑了0.1%的交易费用。
优势分析
- 该策略利用移动平均线交叉形成的趋势信号,能够有效跟踪趋势行情。
- 引入RSI指标判断趋势强度,可以避免趋势受阻时产生错误信号。
- 默认参数经过优化,可以在多种市场中获得较稳定的收益。
- 资金管理合理,避免单笔损失过大。
风险分析
- 当市场处于震荡调整时,该策略容易产生错误信号,无法获利。
- 跟踪趋势策略,无法在没有明确趋势时获得收益。
- 参数设置不当可能导致交易频繁,增加交易费用。
- 未考虑突发事件的影响,可能导致止损不及时。
可通过优化参数,组合其他指标判断获利机会,严格资金管理,设置止损来减小风险。
优化方向
- 可以测试不同移动平均线组合,寻找最优参数。
- 可以引入其他指标判断趋势,如MACD等。
- 可以设置动态止损来控制单笔损失。
- 可以根据不同市场调整资金管理比例。
- 可以结合交易量指标来判断趋势强弱。
总结
该策略通过简单的移动平均线交叉系统捕捉趋势机会。默认参数经过优化,收益稳定,适合自动化交易。可通过引入其他辅助指标、优化参数、完善止损进一步提高策略稳定性和收益率。总体来说,该策略利用趋势交叉信号进行交易,在趋势明显的市场中效果较好。
策略源码
/*backtest
start: 2023-09-16 00:00:00
end: 2023-10-16 00:00:00
period: 2h
basePeriod: 15m
exchanges: [{"eid":"Futures_Binance","currency":"BTC_USDT"}]
*/

// This source code is subject to the terms of the Mozilla Public License 2.0 at https://mozilla.org/MPL/2.0/
// © relevantLeader16058

//@version=4
strategy(shorttitle='Maximized Moving Average Crossing ',title='Maximized Moving Average Crossing (by Coinrule)', overlay=true, initial_capital=1000,  default_qty_type = strategy.percent_of_equity, default_qty_value = 30, commission_type=strategy.commission.percent, commission_value=0.1)

//Backtest dates
fromMonth = input(defval = 1,    title = "From Month",      type = input.integer, minval = 1, maxval = 12)
fromDay   = input(defval = 1,    title = "From Day",        type = input.integer, minval = 1, maxval = 31)
fromYear  = input(defval = 2020, title = "From Year",       type = input.integer, minval = 1970)
thruMonth = input(defval = 1,    title = "Thru Month",      type = input.integer, minval = 1, maxval = 12)
thruDay   = input(defval = 1,    title = "Thru Day",        type = input.integer, minval = 1, maxval = 31)
thruYear  = input(defval = 2112, title = "Thru Year",       type = input.integer, minval = 1970)

showDate  = input(defval = true, title = "Show Date Range", type = input.bool)

start     = timestamp(fromYear, fromMonth, fromDay, 00, 00)        // backtest start window
finish    = timestamp(thruYear, thruMonth, thruDay, 23, 59)        // backtest finish window
window()  => time >= start and time <= finish ? true : false       // create function "within window of time"

//MA inputs and calculations
inlong=input(50, title='MA long period')
inshort=input(9, title='MA short period')

MAlong = sma(close, inlong)
MAshort= sma(close, inshort)

// RSI inputs and calculations
lengthRSI = (14)

RSI = rsi(close, lengthRSI)
RSI_Signal = input(55, title = 'RSI Trigger', minval=1)

//Entry and Exit
bullish = crossover(MAshort, MAlong)
bearish = crossunder(MAshort, MAlong)

strategy.entry(id="long", long = true, when = bullish and RSI > RSI_Signal and window())
strategy.close(id="long", when = bearish and window())


plot(MAshort, color=color.purple, linewidth=2)
plot(MAlong, color=color.red, linewidth=2)
更多内容