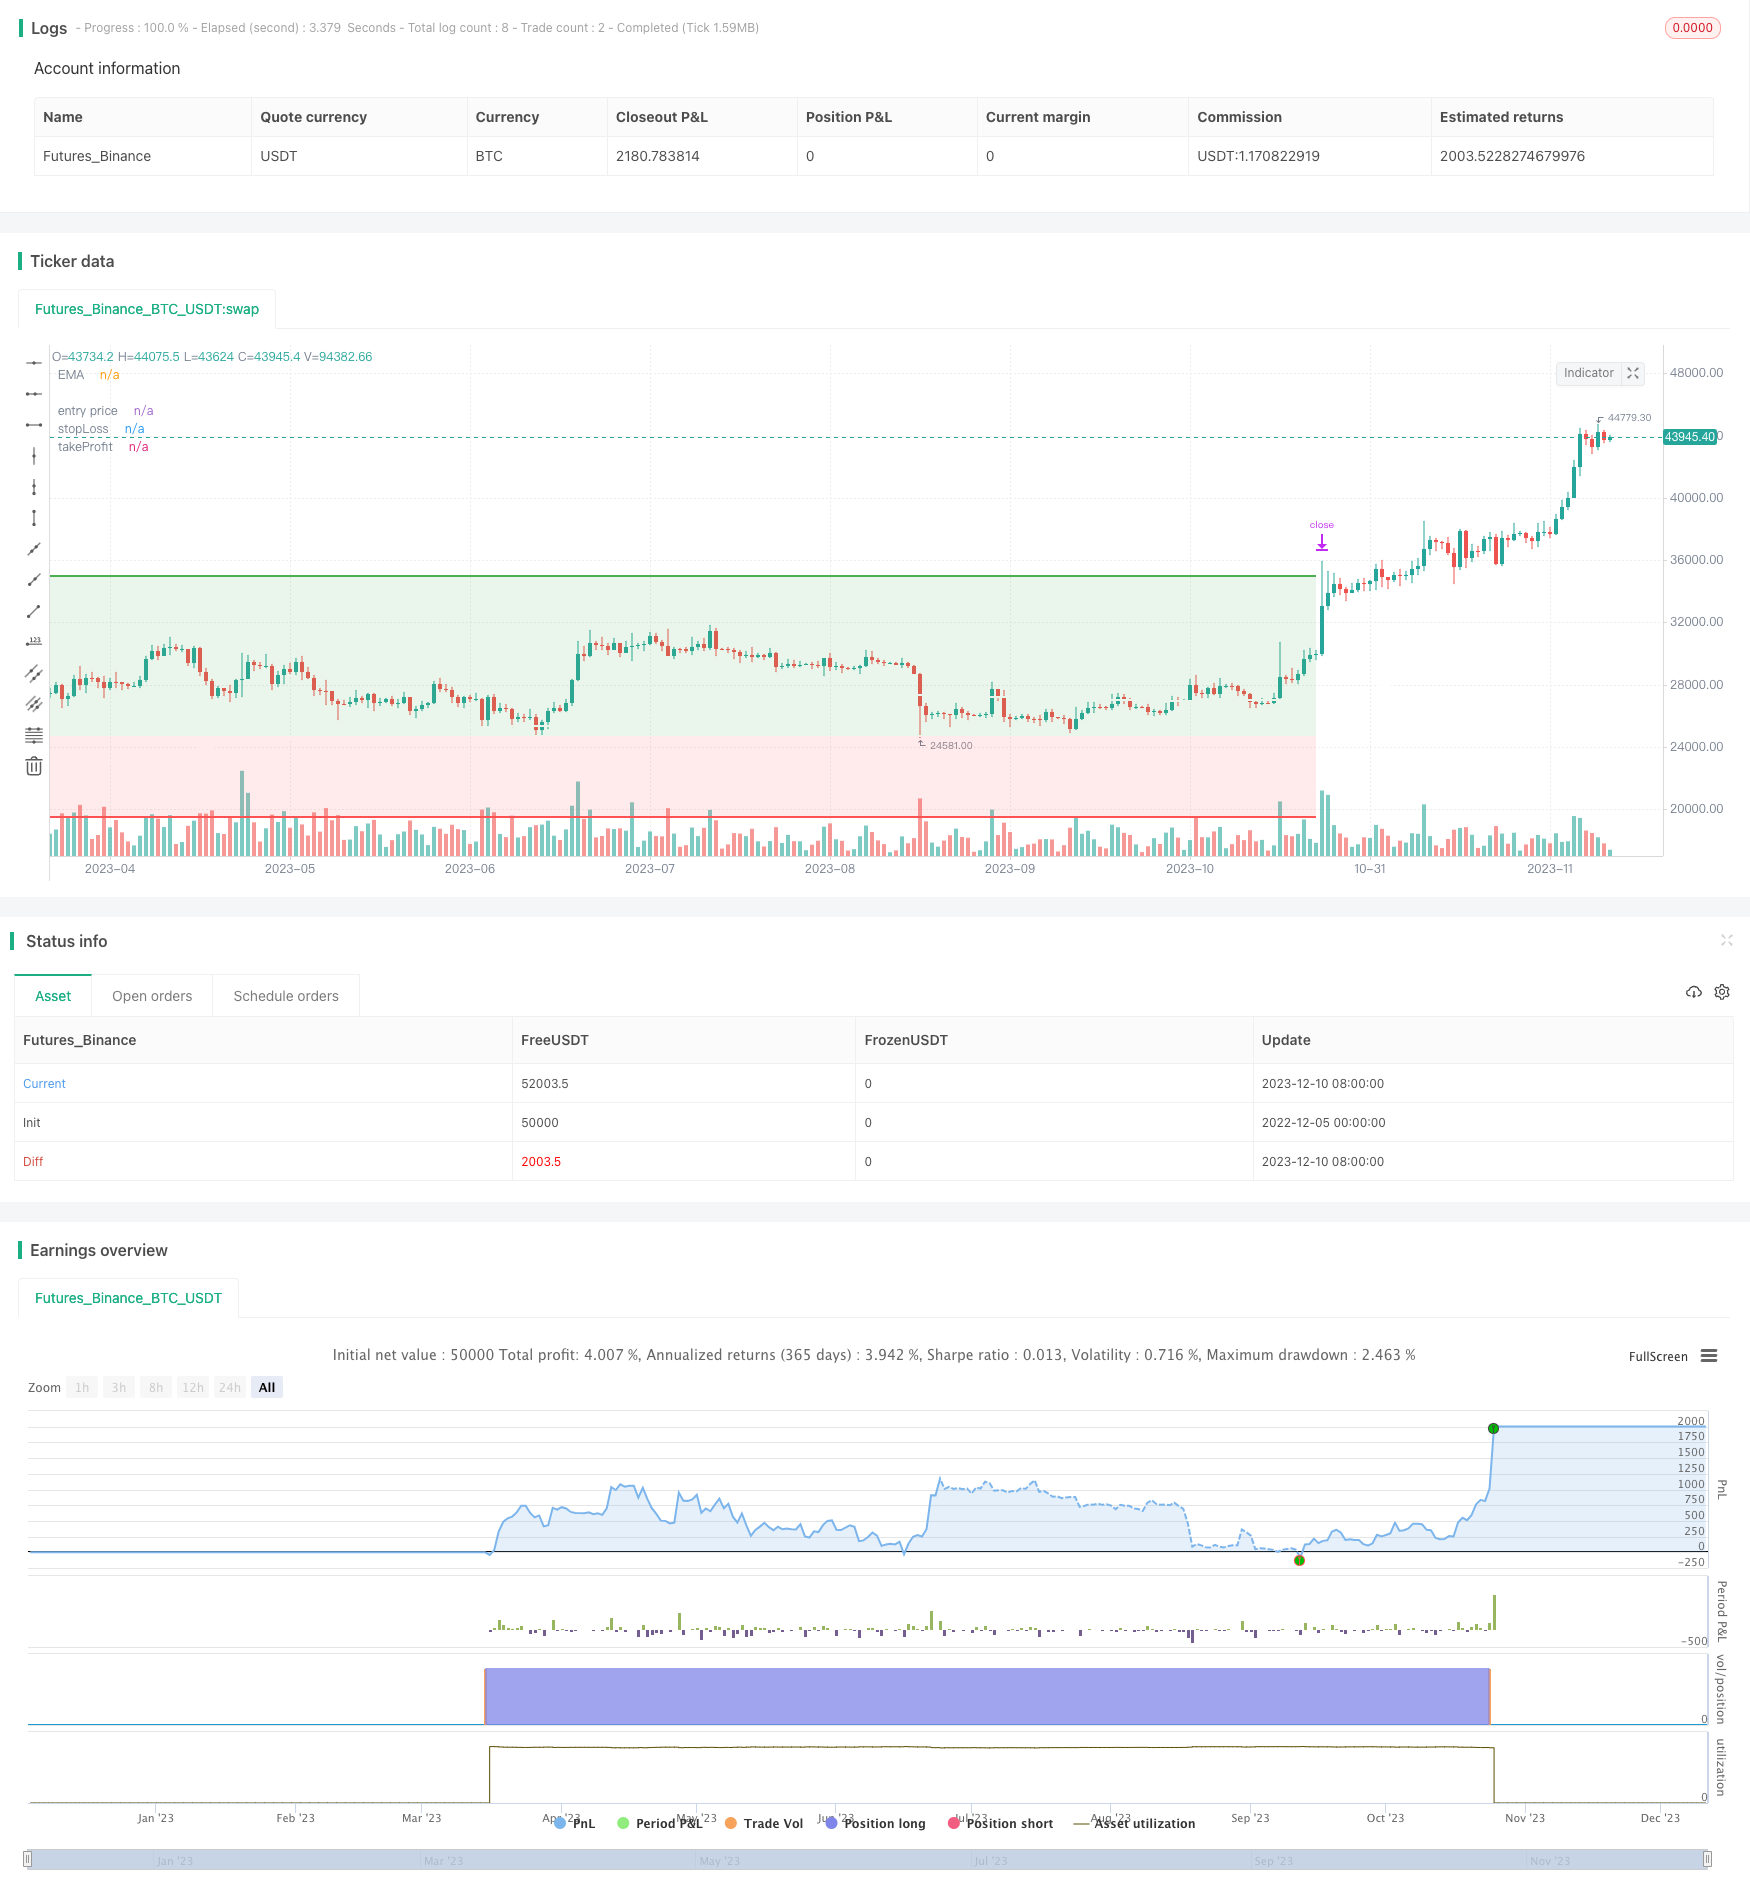
概述
该策略运用移动平均线指标(MACD)构建多空信号,在趋势好的条件下进行反转交易,通过动态设置离场位获取收益。
策略原理
该策略主要基于MACD指标的金叉做多信号、死叉做空信号。具体来说,当MACD线从下向上穿过信号线时产生金叉做多信号;当MACD线从上向下穿过信号线时产生死叉做空信号。
在金叉信号来时,如果收盘价高于EMA均线,则做多;在死叉信号来时,如果收盘价低于EMA均线,则做空。这样可以保证大趋势下进行反转交易。
入场后,策略利用止损位和止盈位进行动态止盈止损。具体来说,多单止损位设置为入场价(1-最大跌幅);止盈位设置为入场价(1+TARGET_STOP_RATIO*最大跌幅)。空单设置相反。其中最大跌幅动态计算,表示swing low到收盘价的百分比下跌空间;TARGET_STOP_RATIO默认为2,表示盈亏比为2。
这样设置离场位的优点是,能够根据市场波动情况来动态调整盈亏比和止损位。在大幅波动中离场快速止损,在小幅波动中追踪止盈。
策略优势
利用MACD指标构建多空信号,可以有效判断价格反转时机。
结合EMA均线做过滤器,进场时选择趋势向上状态,避免逆势交易。
动态离场控制系统,能够实时调整盈亏比、止损点,追求高盈利同时控制风险。
由于考量市场波动,离场速度快,可以减少盯市时间,较为适合忙碌投资者使用。
策略风险及解决
MACD指标在横盘整理的市场中会频繁造成虚假信号。解决方法是加入均线作为过滤器,避免逆势交易。
极端大幅波动的市场中,DYNAMIC STOP会造成过于宽松的止损,但在大部分场景中表现较好。如果遇到极端行情,可以考虑固定盈亏比。
盈利空间有限,需要频繁交易追求利润。这需要投资者有一定的心理承受能力和时间投入。如果无暇操作,可以考虑调整到高周期。
优化方向
根据具体品种特点,调整MACD参数,优化金叉死叉交易效果。
测试不同的移动平均线作为趋势判断指标,寻找更佳的过滤器。
对TARGET_STOP_RATIO、最大跌幅计算方法进行测试,优化止盈止损策略。
增加其他条件判断,如交易量变化、波动率等,提高信号质量。
尝试机器学习算法提炼更多特征,建立动态多因子模型,实现更智能的止盈止损。
总结
该策略整体具有较强的实用性。以MACD为核心交易信号,增加趋势判断和动态离场控制两个辅助模块,可以显著提高MACD本身的交易效果。止盈止损策略是策略优化的重点方向,本策略在这方面进行了大量创新,值得进一步研究与应用。
/*backtest
start: 2022-12-05 00:00:00
end: 2023-12-11 00:00:00
period: 1d
basePeriod: 1h
exchanges: [{"eid":"Futures_Binance","currency":"BTC_USDT"}]
*/

// This source code is subject to the terms of the Mozilla Public License 2.0 at https://mozilla.org/MPL/2.0/
// © maxencetajet

//@version=5
strategy("MACD Strategy", overlay=true, initial_capital=1000, slippage=25)

src = input(title="Source", defval=close)
target_stop_ratio = input.float(title='Risk/Reward', defval=2, minval=0.5, maxval=100)
risk = input.float(2, title="Risk per Trade %")

riskt = risk / 100 + 1

useDateFilter = input.bool(true, title="Filter Date Range of Backtest",
     group="Backtest Time Period")
backtestStartDate = input(timestamp("5 June 2022"),
     title="Start Date", group="Backtest Time Period",
     tooltip="This start date is in the time zone of the exchange " +
     "where the chart's instrument trades. It doesn't use the time " +
     "zone of the chart or of your computer.")
backtestEndDate = input(timestamp("5 July 2022"),
     title="End Date", group="Backtest Time Period",
     tooltip="This end date is in the time zone of the exchange " +
     "where the chart's instrument trades. It doesn't use the time " +
     "zone of the chart or of your computer.")

inTradeWindow =  true
emaV = input.int(200, title="Length", group="EMA")
swingHighV = input.int(7, title="Swing High", group="number of past candles")
swingLowV = input.int(7, title="Swing Low", group="number of past candles")

ema = ta.ema(src, emaV)

fast_length = input(title="Fast Length", defval=12, group="MACD")
slow_length = input(title="Slow Length", defval=26, group="MACD")
signal_length = input.int(title="Signal Smoothing",  minval = 1, maxval = 50, defval = 9, group="MACD")
sma_source = input.string(title="Oscillator MA Type",  defval="EMA", options=["SMA", "EMA"], group="MACD")
sma_signal = input.string(title="Signal Line MA Type", defval="EMA", options=["SMA", "EMA"], group="MACD")

fast_ma = sma_source == "SMA" ? ta.sma(src, fast_length) : ta.ema(src, fast_length)
slow_ma = sma_source == "SMA" ? ta.sma(src, slow_length) : ta.ema(src, slow_length)
macd = fast_ma - slow_ma
signal = sma_signal == "SMA" ? ta.sma(macd, signal_length) : ta.ema(macd, signal_length)
hist = macd - signal

longcondition = close > ema and ta.crossover(macd, signal) and macd < 0
shortcondition = close < ema and ta.crossunder(macd, signal) and macd > 0

float risk_long = na
float risk_short = na
float stopLoss = na
float takeProfit = na
float entry_price = na

risk_long := risk_long[1]
risk_short := risk_short[1]

swingHigh = ta.highest(high, swingHighV)
swingLow = ta.lowest(low, swingLowV)

lotB = (strategy.equity*riskt-strategy.equity)/(close - swingLow)
lotS = (strategy.equity*riskt-strategy.equity)/(swingHigh - close)

if strategy.position_size == 0 and longcondition and inTradeWindow
    risk_long := (close - swingLow) / close
    strategy.entry("long", strategy.long, qty=lotB)

if strategy.position_size == 0 and shortcondition and inTradeWindow
    risk_short := (swingHigh - close) / close
    strategy.entry("short", strategy.short, qty=lotS)

if strategy.position_size > 0

    stopLoss := strategy.position_avg_price * (1 - risk_long)
    takeProfit := strategy.position_avg_price * (1 + target_stop_ratio * risk_long)
    entry_price := strategy.position_avg_price
    strategy.exit("long exit", "long", stop = stopLoss, limit = takeProfit)

if strategy.position_size < 0

    stopLoss := strategy.position_avg_price * (1 + risk_short)
    takeProfit := strategy.position_avg_price * (1 - target_stop_ratio * risk_short)
    entry_price := strategy.position_avg_price
    strategy.exit("short exit", "short", stop = stopLoss, limit = takeProfit)

plot(ema, color=color.white, linewidth=2, title="EMA")
p_ep = plot(entry_price, color=color.new(color.white, 0), linewidth=2, style=plot.style_linebr, title='entry price')
p_sl = plot(stopLoss, color=color.new(color.red, 0), linewidth=2, style=plot.style_linebr, title='stopLoss')
p_tp = plot(takeProfit, color=color.new(color.green, 0), linewidth=2, style=plot.style_linebr, title='takeProfit')
fill(p_sl, p_ep, color.new(color.red, transp=85))
fill(p_tp, p_ep, color.new(color.green, transp=85))