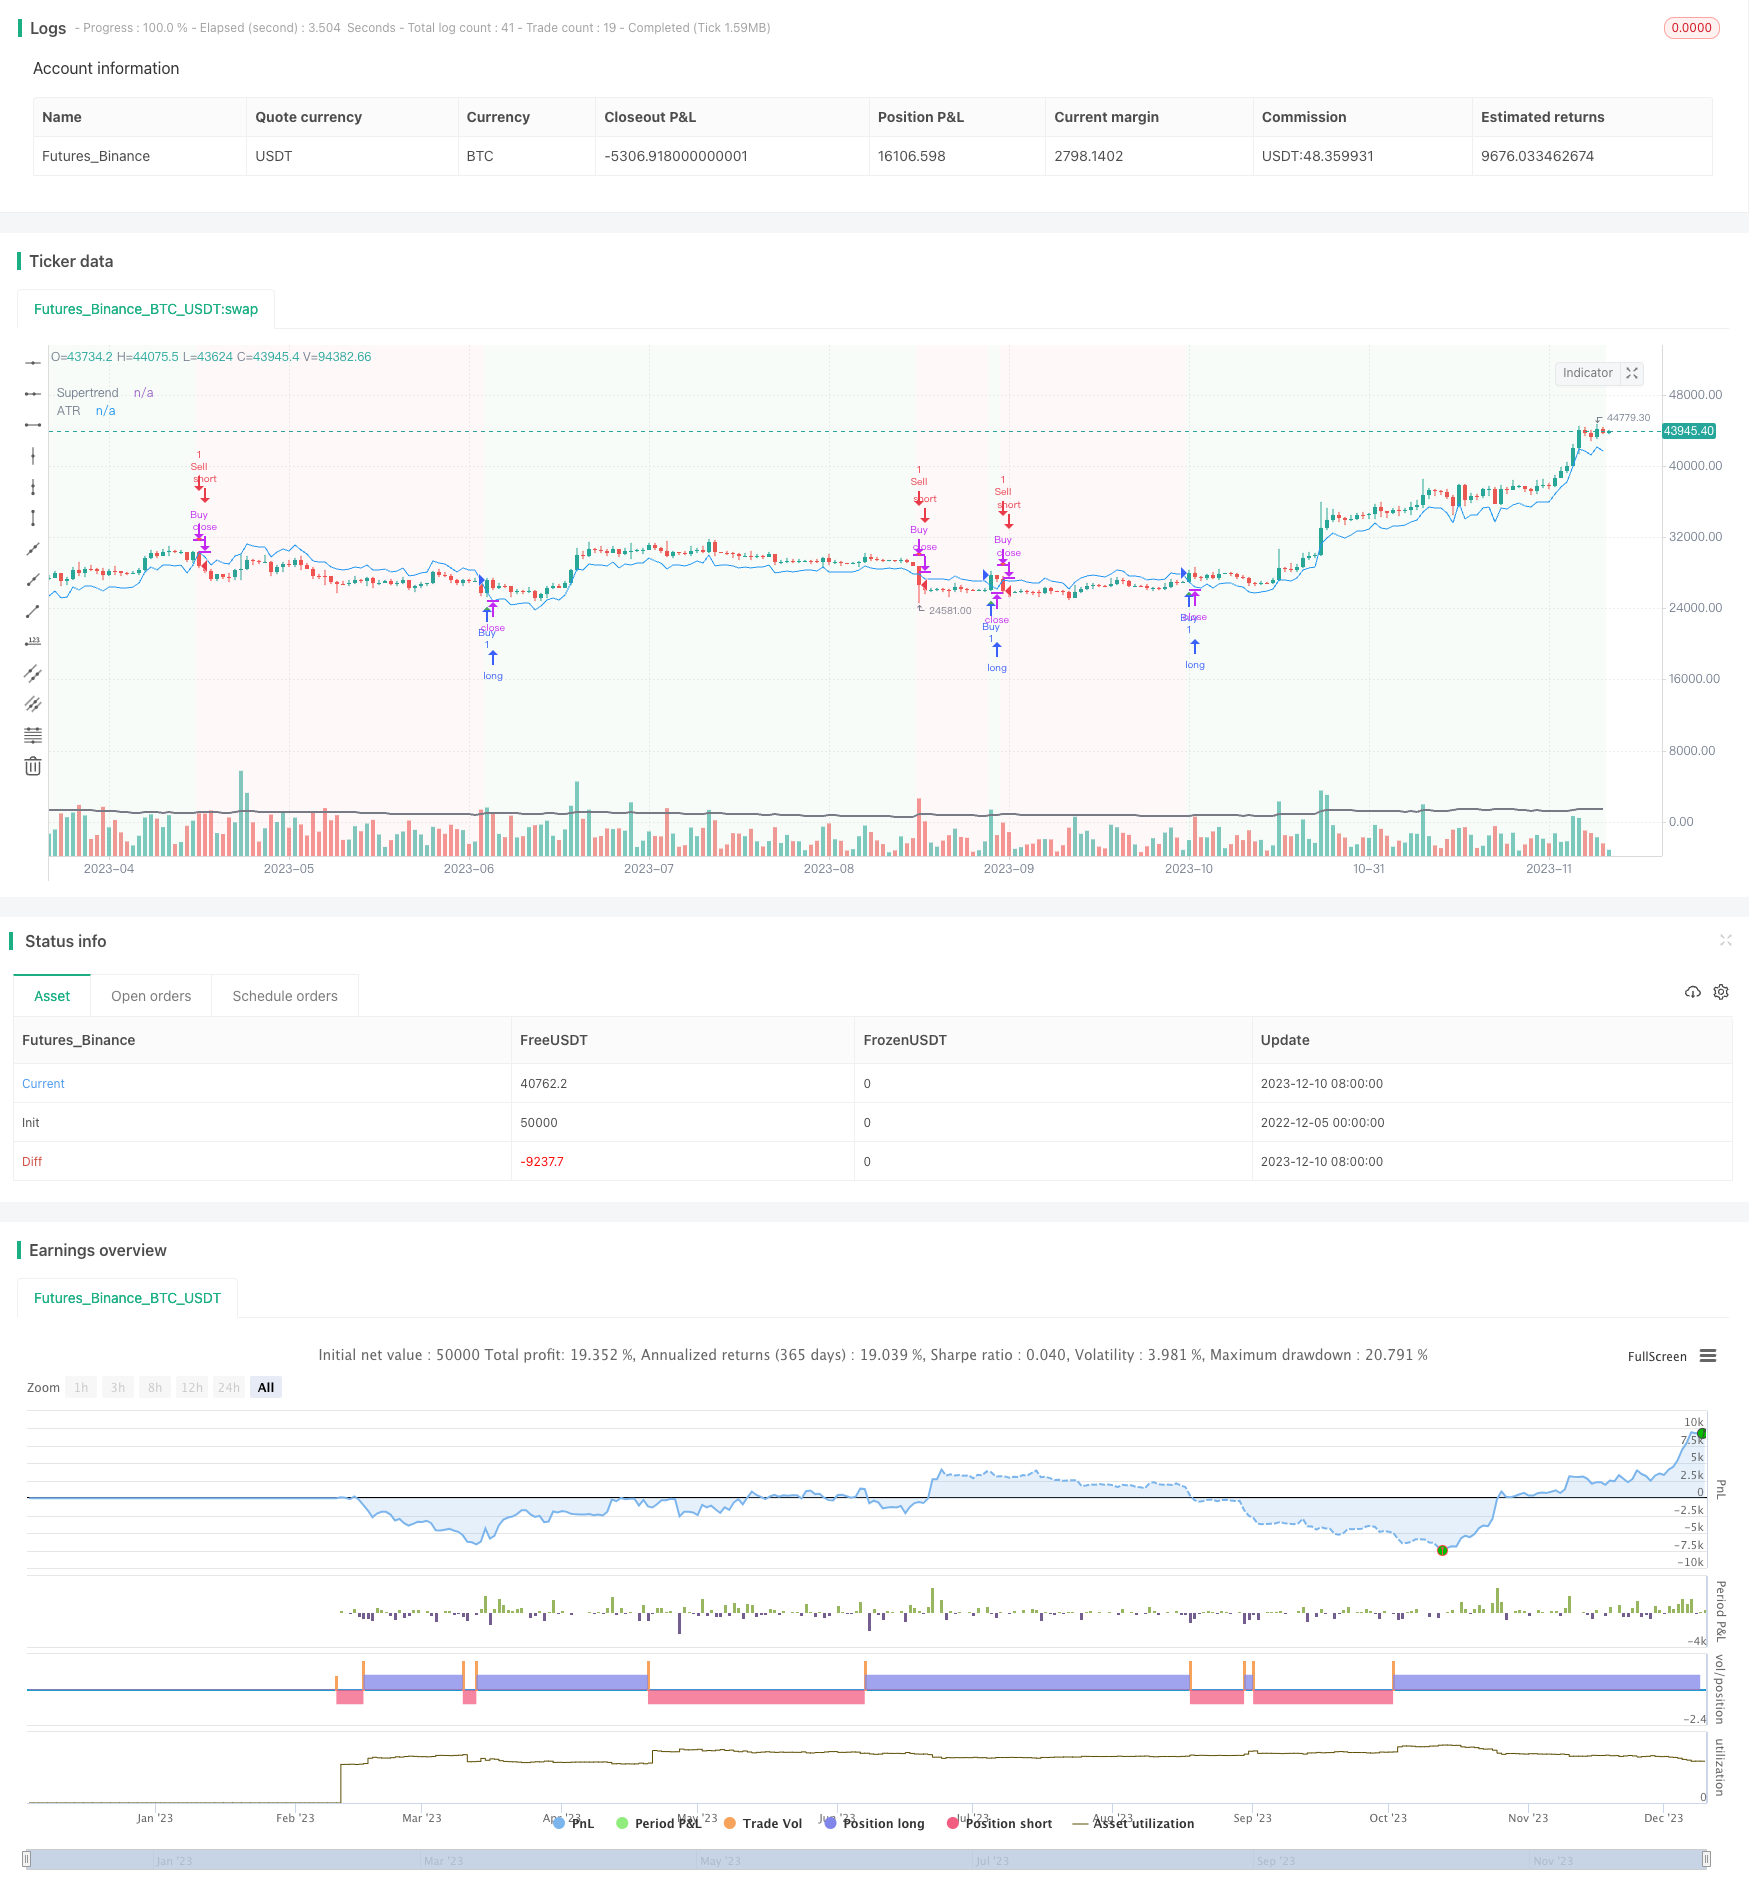
基于SuperTrend指标的趋势跟踪策略。该策略利用SuperTrend指标判断趋势方向,结合ATR指标设定止损止盈,实现低风险趋势跟踪。
策略原理
该策略的核心指标是SuperTrend,SuperTrend指标结合ATR,根据价格的突破来判断趋势方向。具体计算方法如下:
上轨线:上轨线=当前价-(ATR乘以乘数) 下轨线:下轨线=当前价+(ATR乘以乘数)
当价格高于上轨线时,为看涨趋势;当价格低于下轨线时,为看跌趋势。
策略基于SuperTrend指标判断趋势方向,在看涨趋势时做多,看跌趋势时做空。同时,策略利用ATR指标的平均波动范围来设置止损止盈位置,控制风险。
策略优势
- 利用SuperTrend指标判断趋势,可准确捕捉市场趋势
- ATR止损止盈,有效控制单笔损失
- 结合趋势和止损,整体实现高胜率交易
- 容易入市容易止损,适合短线跟踪
策略风险
- SuperTrend指标存在repaint问题,不能完全依赖信号入市
- ATR指标对剧烈行情无法完全适应,止损过密容易被止损
- 策略本身无法判断趋势质量,需要人工校验趋势
风险解决方法: 1)人工校验趋势质量,避免在假突破上做反向操作 2)适当宽松止损点,防止在正常波动中被小幅止损
策略优化方向
- 增加多因子校验,判断趋势质量
- 结合波动率指标动态调整ATR参数
- 增加机器学习模型辅助判断交易时机
- 优化止损机制,防止正常波动被止损
总结:本策略利用SuperTrend指标判断趋势方向,ATR指标设置止损止盈,实现低风险趋势跟踪交易。策略思路清晰易于理解,可根据自身风险偏好调整参数,是一种通用型的趋势跟踪策略。但策略本身无法判断趋势质量,建议与其他指标或模型配合使用,降低误操作风险。
策略源码
/*backtest
start: 2022-12-05 00:00:00
end: 2023-12-11 00:00:00
period: 1d
basePeriod: 1h
exchanges: [{"eid":"Futures_Binance","currency":"BTC_USDT"}]
*/

//@version=5
strategy("Advanced Trend Strategy", overlay=true)

// Input parameters
length = input(14, title="ATR Length")
multiplier = input(1.5, title="Multiplier")
src = close

// Calculate ATR
atr_value = ta.atr(length)

// Calculate Supertrend
upst = src - multiplier * atr_value
downst = src + multiplier * atr_value

var float supertrend = na
var float trend_direction = na

if (na(supertrend))
    supertrend := upst

if (src > supertrend)
    supertrend := upst

if (src < supertrend)
    supertrend := downst

// Buy and Sell conditions
buyCondition = ta.crossover(src, supertrend)
sellCondition = ta.crossunder(src, supertrend)

// Execute Buy and Sell orders
if (buyCondition)
    strategy.entry("Buy", strategy.long)

if (sellCondition)
    strategy.close("Buy")  // Close the long position

if (sellCondition)
    strategy.entry("Sell", strategy.short)

if (buyCondition)
    strategy.close("Sell")  // Close the short position

// Plot Supertrend
plot(supertrend, color=color.blue, title="Supertrend")

// Highlight bars based on trend direction
bgcolor(src > supertrend ? color.new(color.green, 95) : src < supertrend ? color.new(color.red, 95) : na)

// Plot ATR for reference
plot(atr_value, color=color.gray, title="ATR", linewidth=2)

// Plot arrows for buy and sell signals
plotshape(buyCondition, color=color.green, style=shape.triangleup, location=location.belowbar, size=size.small, title="Buy Signal")
plotshape(sellCondition, color=color.red, style=shape.triangledown, location=location.abovebar, size=size.small, title="Sell Signal")