概述
该策略的核心思想是结合相对强弱指标(RSI)和布林带这两个技术指标来实现双重交易信号的过滤,在最大程度上减少虚假信号的干扰,提高信号质量。
当RSI指标显示超买或超卖信号,同时价格突破或回调布林带上下轨时,会形成交易机会。它综合了两个不同指标的优势,既考虑了市场波动的统计特征,也关注了市场参与者的多空态势,形成全面的判断依据。
策略原理
RSI部分,我们同时关注两个不同周期的RSI指标,一个较短周期的用来捕捉超买超卖信号,一个较长周期的用来确认趋势反转。当短周期RSI显示超买超卖且长周期RSI显示反转时,认为形成交易机会。
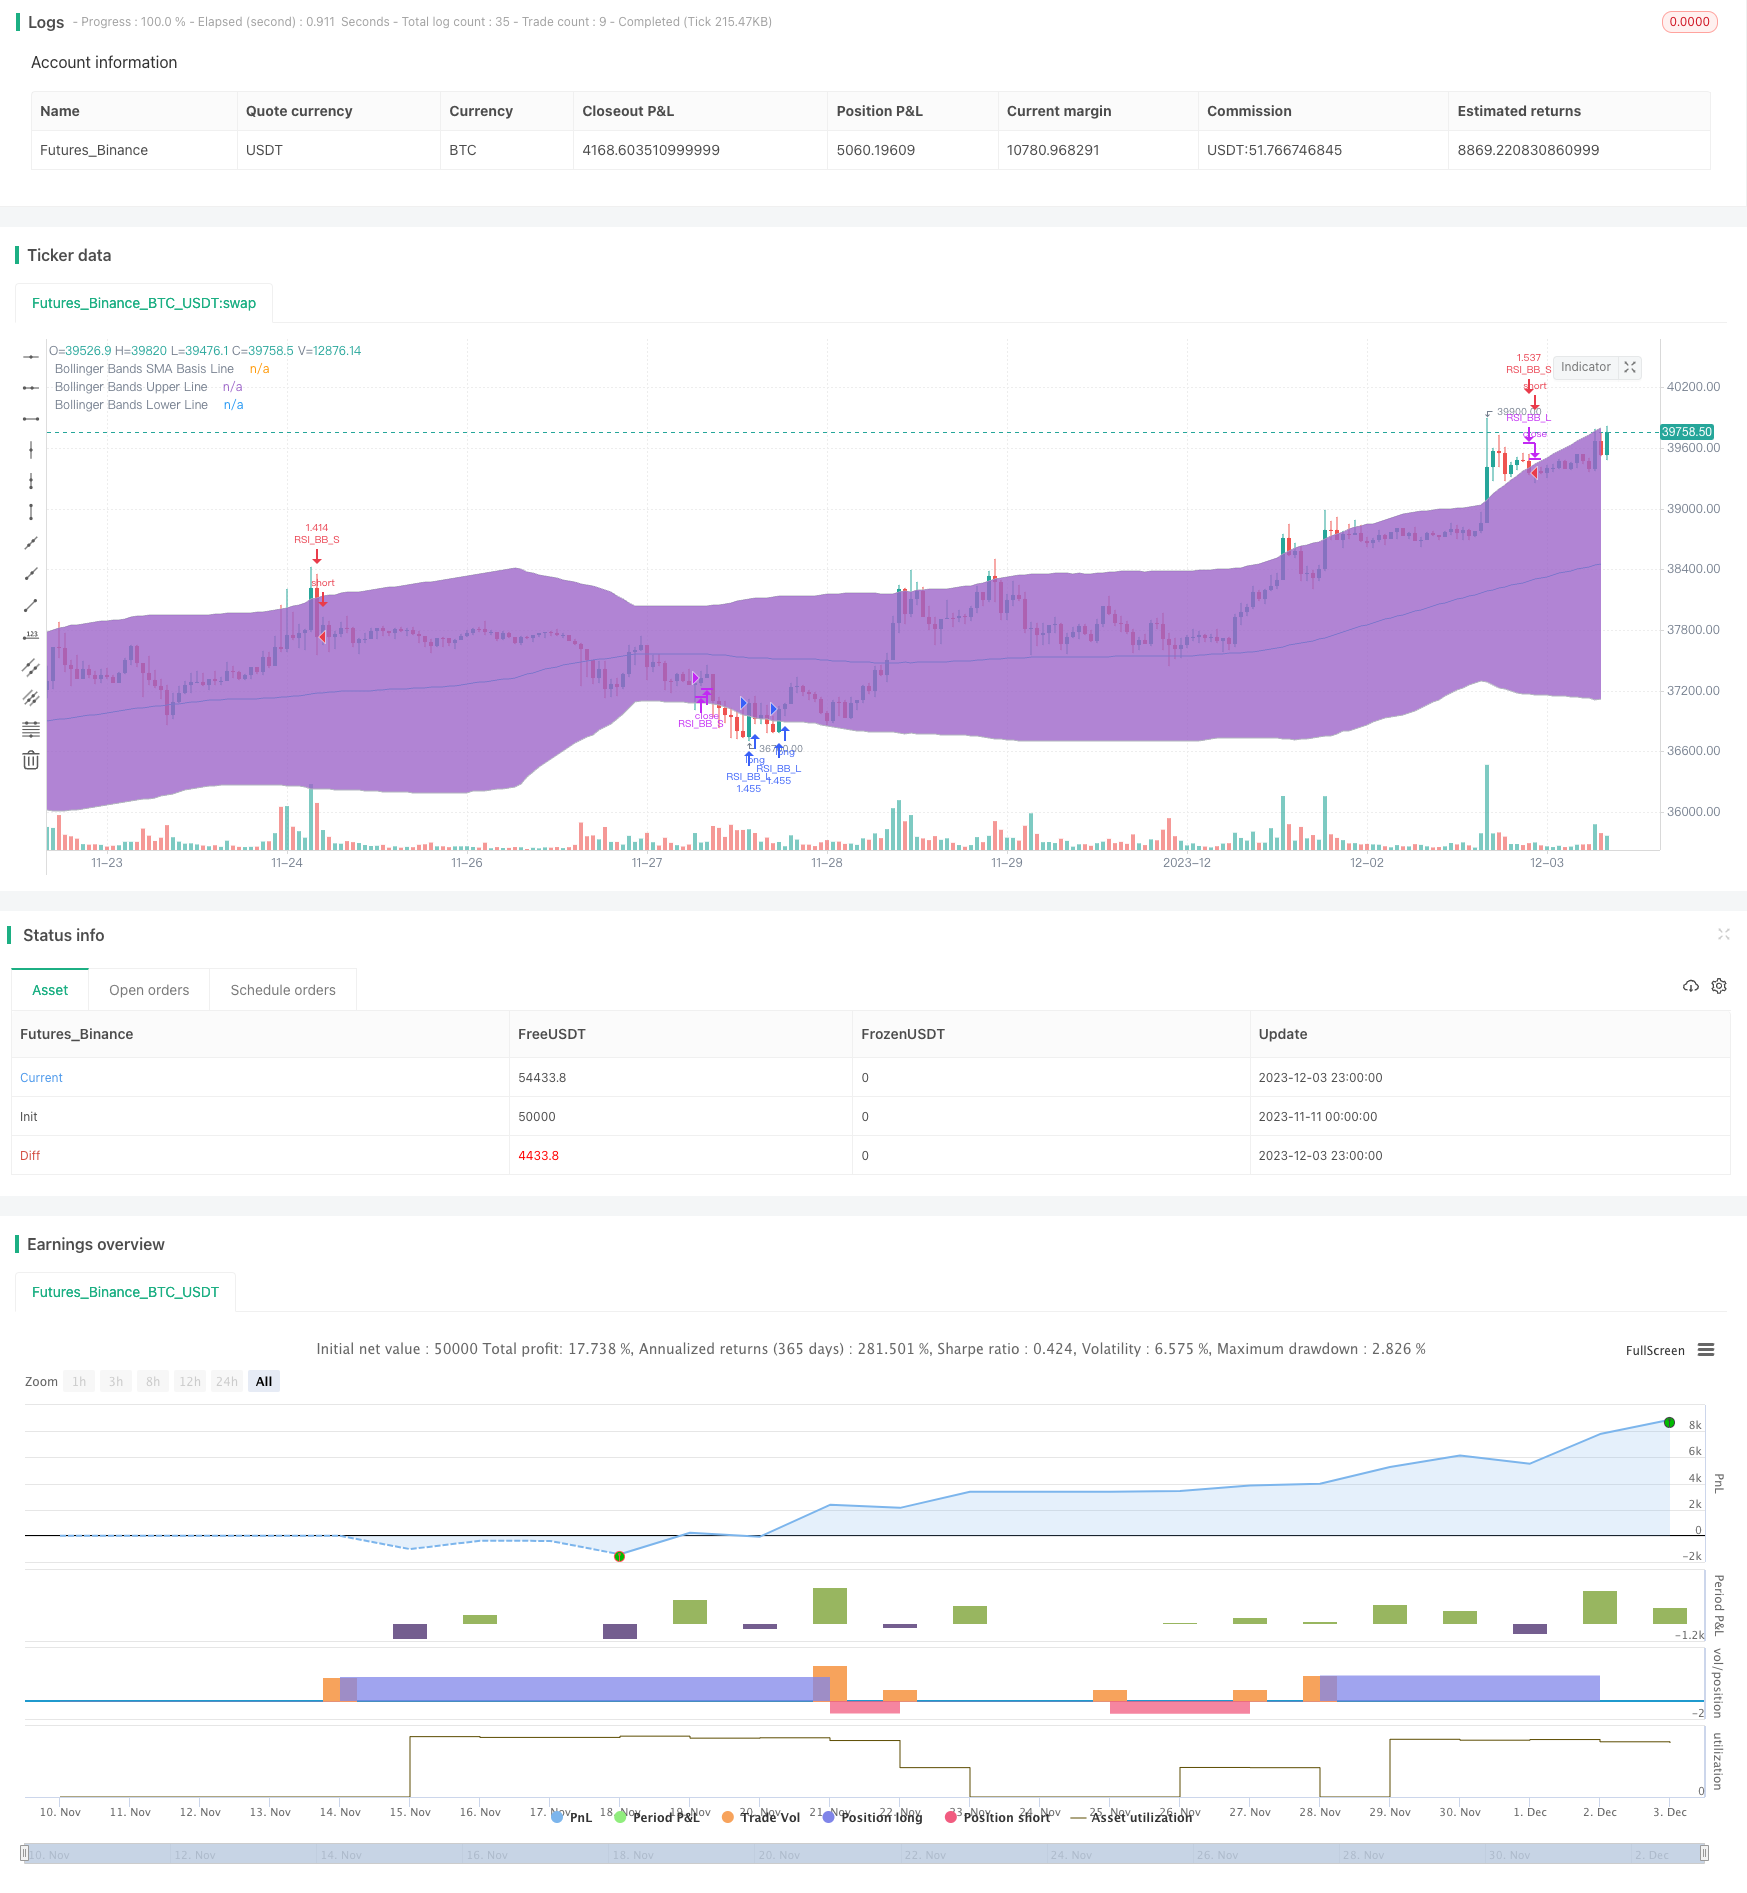
布林带部分,我们关注价格是否突破上下轨。突破布林带上轨为卖点,突破下轨为买点。同时我们也关注价格是否回调布林带,这样可以及时捕捉反转机会。
当RSI信号和布林带信号同时呈现时,我们就认为交易机会成型,发出交易指令。
优势分析
- 双重指标过滤,可靠性较高,避免多余交易
- 兼顾趋势和反转,把握不同市场阶段的机会
- 参数可配置,可以按需要调整参数
- 内置时间和资金管理
风险分析
- 布林带参数设置不当可能导致虚假信号
- 无法应对市场剧烈波动的极端情况
- RSI指标发散时可能出现错误信号
- 需要优化参数以适应不同品种和周期
可以通过参数优化、适当缩小仓位、人工干预等方式规避和控制风险。
优化方向
- 调整RSI参数,优化超买超卖判断
- 调整布林带宽度,优化布林带突破策略
- 增加仓位管理机制
- 增加止损策略
- 结合更多指标实现多因子模型
总结
RSI与布林带双重策略充分利用两个指标的优势实现高质量信号的产生,在参数优化和风险管理到位的前提下,可以获得稳定的投资回报。结合更多信号和模型也是未来的可能方向。
策略源码
/*backtest
start: 2023-11-11 00:00:00
end: 2023-12-04 00:00:00
period: 1h
basePeriod: 15m
exchanges: [{"eid":"Futures_Binance","currency":"BTC_USDT"}]
*/

//@version=4
strategy("Ezieh Str.v2", shorttitle="Ezieh Str.v2", overlay=true, pyramiding=10, currency=currency.USD, slippage=3, commission_type=strategy.commission.cash_per_order, commission_value=0.04, initial_capital=1000)


UseDateFilter  = input(title="Enable Date Filter"         ,type=input.bool    ,defval=false                               ,group="Date & Time" ,tooltip="Turns on/off date filter")
StartDate      = input(title="Start Date Filter"          ,type=input.time    ,defval=timestamp("1 Jan 2000 00:00 +0000") ,group="Date & Time" ,tooltip="Date & time to start excluding trades")
EndDate        = input(title="End Date Filter"            ,type=input.time    ,defval=timestamp("1 Jan 2100 00:00 +0000") ,group="Date & Time" ,tooltip="Date & time to stop excluding trades")
UseTimeFilter  = input(title="Enable Time Session Filter" ,type=input.bool    ,defval=false                               ,group="Date & Time" ,tooltip="Turns on/off time session filter")
TradingSession = input(title="Trading Session"            ,type=input.session ,defval="1000-2200:1234567"                 ,group="Date & Time" ,tooltip="No trades will be taken outside of this range")

In(t)      => na(time(timeframe.period, t)) == false
TimeFilter = (UseTimeFilter and not In(TradingSession)) or not UseTimeFilter
DateFilter = time >= StartDate and time <= EndDate

DateTime = (UseDateFilter ? not DateFilter : true) and (UseTimeFilter ? In(TradingSession) : true)

///////////// RSI
L_RSI_Length     = input(7  , title="L_Length")
L_RSI_OverSold   = input(45 , title="L_OverSold")
S_RSI_Length     = input(14 , title="S_Length")
S_RSI_OverBought = input(65 , title="S_OverBought")

price = close
Lvrsi = rsi(price, L_RSI_Length)
Svrsi = rsi(price, S_RSI_Length)

///////////// Bollinger Bands
BBlength = input(title="Bollinger Period Length", type=input.integer, defval=100, minval=2)
BBmult = 2.1 // input(2.0, minval=0.001, maxval=50,title="Bollinger Bands Standard Deviation")
BBbasis = sma(price, BBlength)
BBdev = BBmult * stdev(price, BBlength)
BBupper = BBbasis + BBdev
BBlower = BBbasis - BBdev
source = close
plot(BBbasis, color=color.aqua,title="Bollinger Bands SMA Basis Line")
p1 = plot(BBupper, color=color.silver,title="Bollinger Bands Upper Line")
p2 = plot(BBlower, color=color.silver,title="Bollinger Bands Lower Line")
fill(p1, p2)


///////////// Colors
switch1=input(true, title="Enable Bar Color?")
switch2=input(true, title="Enable Background Color?")


///////////// Condition
LongCondition  = crossover(Lvrsi, L_RSI_OverSold)    and crossover(close  ,BBlower)
ShortCondition = crossunder(Svrsi, S_RSI_OverBought) and crossunder(close,BBupper)
Longexcon      = crossunder(low, BBupper)
Shortexcon     = crossover(low, BBlower)

qt = round(strategy.equity/price, 3)

///////////// RSI + Bollinger Bands Strategy
if (not na(Lvrsi))

    if LongCondition and DateTime
        strategy.entry("RSI_BB_L", strategy.long, qty=qt,  comment="Long")
    else
        strategy.cancel(id="RSI_BB_L")

    if Longexcon
        strategy.close("RSI_BB_L", qty_percent = 100, comment = "L_exit")

    if ShortCondition and DateTime
        strategy.entry("RSI_BB_S", strategy.short, qty=qt,  comment="Short")
    else
        strategy.cancel(id="RSI_BB_S")

    if Shortexcon
        strategy.close("RSI_BB_S", qty_percent = 100, comment = "S_exit")

//plot(strategy.equity, title="equity", color=red, linewidth=2, style=areabr)