布林带与相对强弱指数结合策略
Author: ChaoZhang, Date: 2024-03-15 16:28:53Tags:
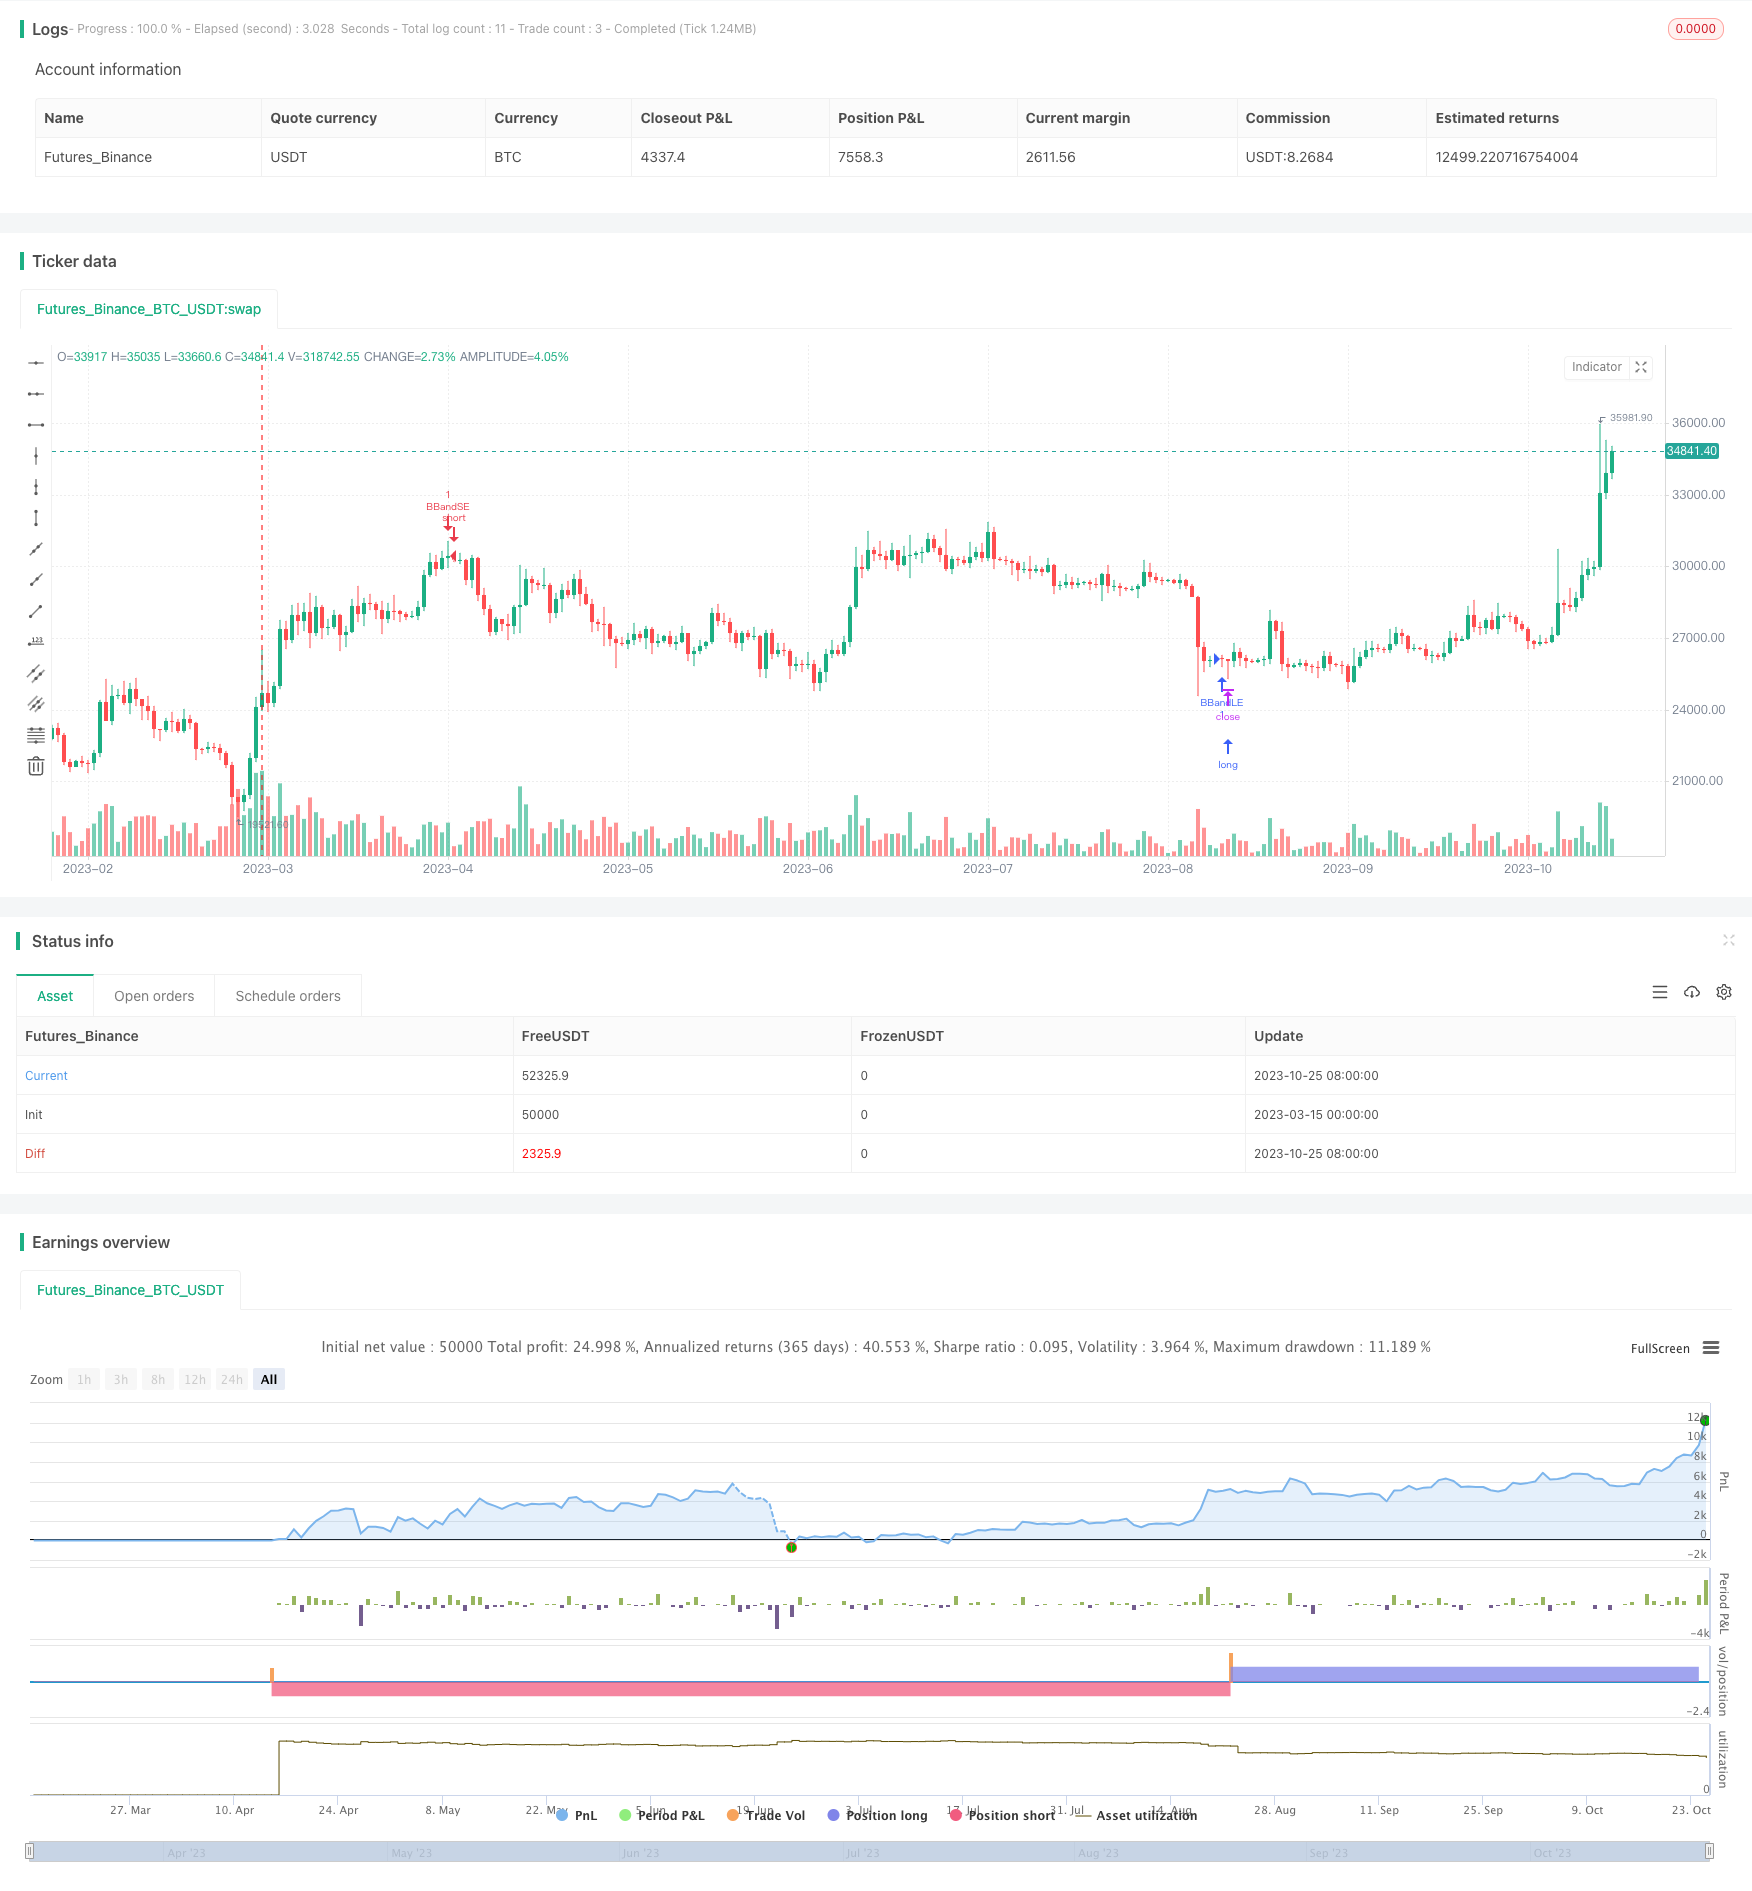
策略概述
布林带与相对强弱指数(RSI)结合策略是一种技术分析策略,它结合了两个流行的技术指标:布林带和RSI,用于在市场中做出进出场决策。该策略利用价格突破布林带上下轨以及RSI指标的超买超卖信号,来确定交易机会。
策略原理
该策略使用布林带和RSI两个技术指标来产生交易信号:
布林带由三条线组成:中轨(移动平均线)、上轨(中轨加标准差)和下轨(中轨减标准差)。当价格突破布林带上轨或下轨时,产生交易信号。
RSI衡量价格变动的速度和幅度,通过比较一段时间内价格上涨日数与下跌日数的比率来计算。RSI用于过滤布林带产生的交易信号:只有当RSI低于超卖水平时才做多,只有当RSI高于超买水平时才做空。
具体来说,该策略的交易信号如下:
- 做多信号:当价格向下突破布林带下轨,且RSI低于超卖水平时,开仓做多。
- 做空信号:当价格向上突破布林带上轨,且RSI高于超买水平时,开仓做空。
- 平仓:当价格突破相反方向的布林带时平仓。
策略优势
- 结合了两个被广泛使用和认可的技术指标,策略逻辑简单明了。
- 利用RSI过滤布林带产生的交易信号,提高了交易决策的质量,减少了误导性信号。
- 策略参数可以根据不同的市场特点和交易风格进行优化,具有一定的灵活性和适应性。
策略风险
- 像所有的交易策略一样,该策略在某些市场环境下可能表现不佳,如趋势不明显或波动率极低的情况。
- 策略参数的选择对策略表现有重要影响,不恰当的参数可能导致大量的错误交易信号。
- 该策略没有考虑市场的基本面因素,完全依赖价格行为,在某些事件驱动的市场环境中可能失效。
优化方向
- 结合其他确认指标,如成交量、趋势指标等,进一步过滤交易信号,提高信号质量。
- 引入止损和止盈机制,控制单笔交易风险和利润目标,提高策略的风险收益特性。
- 对策略参数进行优化,如布林带的周期、偏差倍数,RSI的周期、超买超卖阈值等,找到最适合当前市场的参数组合。
- 考虑不同市场状态下的表现,如趋势型市场、震荡型市场等,针对不同市场采取不同的策略参数或规则。
总结
布林带与RSI结合策略是一种简单实用的技术交易策略,通过将布林带和RSI这两个经典指标结合起来,产生相对可靠的交易信号。该策略的优势在于逻辑清晰,易于理解和实现,同时利用RSI指标对布林带信号进行了过滤,提高了信号质量。但是,该策略也存在一些局限性,如对市场环境的适应性不够强,缺乏对基本面因素的考虑等。因此,在实际应用中,需要根据具体的市场特点和交易风格,对策略进行优化和改进,如结合其他技术指标、引入风险控制措施、优化参数选择等。总的来说,布林带与RSI结合策略为技术交易者提供了一种可供参考的交易思路和框架,但策略的成功与否还取决于交易者对市场的理解和经验的积累。
/*backtest
start: 2023-03-15 00:00:00
end: 2023-10-26 00:00:00
period: 1d
basePeriod: 1h
exchanges: [{"eid":"Futures_Binance","currency":"BTC_USDT"}]
*/

//@version=5
strategy("Bollinger Bands & RSI Strategy", overlay=true)

// Bollinger Bands Parameters
source = close
length = input.int(20, minval=1)
mult = input.float(2.0, minval=0.001, maxval=50)

// RSI Parameters
rsi_length = input.int(14, minval=1)
rsi_oversold = input.int(30, minval=1, maxval=100)
rsi_overbought = input.int(70, minval=1, maxval=100)

// Strategy Entry
basis = ta.sma(source, length)
dev = mult * ta.stdev(source, length)
upper = basis + dev
lower = basis - dev

rsi = ta.rsi(source, rsi_length)

if (ta.crossover(source, lower) and rsi < rsi_oversold)
    strategy.entry("BBandLE", strategy.long, comment="BBandLE")
else
    strategy.cancel(id="BBandLE")

if (ta.crossunder(source, upper) and rsi > rsi_overbought)
    strategy.entry("BBandSE", strategy.short, comment="BBandSE")
else
    strategy.cancel(id="BBandSE")
更多内容
- 基于双移动平均线交叉的量化交易策略
- EMA 200 交叉量价趋势策略
- RSI动态止损止盈策略
- 一文中局部震荡趋势识别策略
- 基于9EMA动态仓位的5分钟双收盘价强势突破策略
- 基于多空自适应动态网格策略
- 基于平均真实波幅和相对强弱指数的钱德勒出场策略
- 高低点自动预测与交易策略
- 日内锤子反转形态多头策略
- CVD背离量化交易策略
- 一目均衡动力指数策略
- AI趋势预测交易策略
- TrendHunter w/MF 多时间框架趋势策略
- 布林带与斐波那契回调策略
- 基于RSI和MACD交叉策略
- 基于双均线交叉的交易策略
- 动态RSI双均线买卖策略
- 多重指数移动平均线交易策略
- 基于RSI 穿越交易策略
- 基于双均线交叉策略