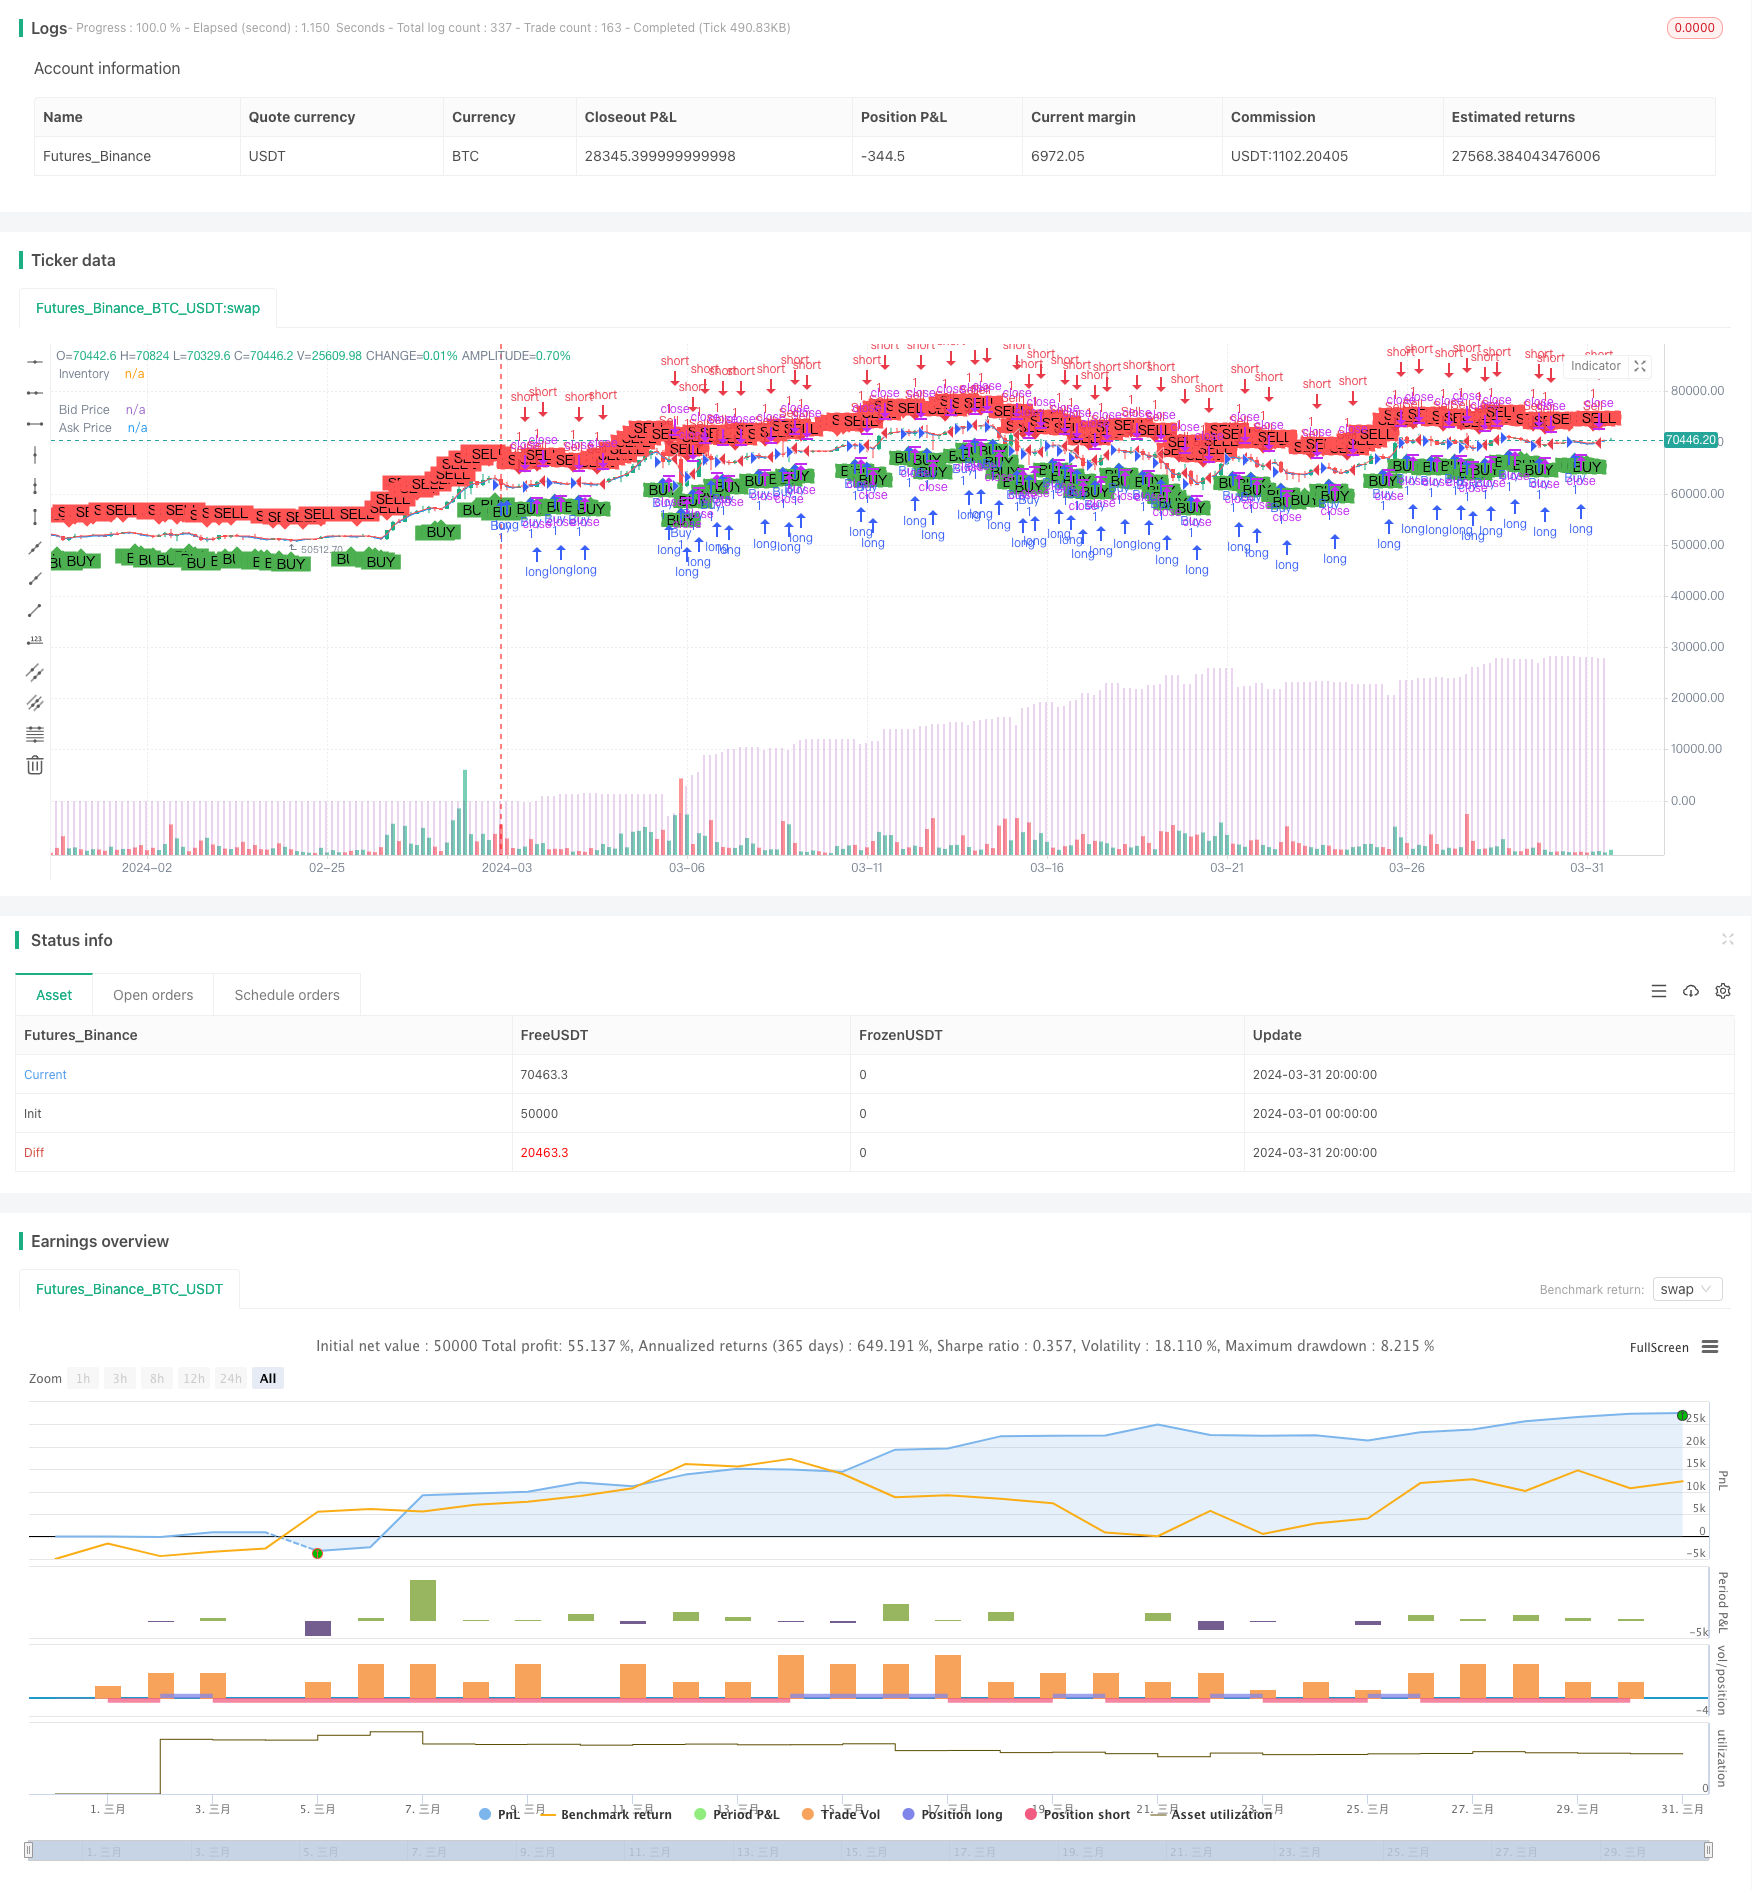
Khaled Tamim's Avellaneda-Stoikov Strategy
Author: ChaoZhang, Date: 2024-04-30 15:54:23Tags:

概述
Khaled Tamim的Avellaneda-Stoikov策略是一种基于Avellaneda-Stoikov模型的量化交易策略。该策略通过计算中间价、买入价和卖出价,同时考虑交易费用,来确定买入和卖出信号。策略的主要思路是在价格低于买入价一定阈值时买入,在价格高于卖出价一定阈值时卖出,以此来获取价差收益。
策略原理
该策略的核心是Avellaneda-Stoikov模型,通过以下步骤来计算买入价和卖出价: 1. 计算中间价,即当前价格与前一个价格的平均值。 2. 计算买入价,即中间价减去一个包含Gamma、Sigma、T和k的平方根项,再减去交易费用。 3. 计算卖出价,即中间价加上一个包含Gamma、Sigma、T和k的平方根项,再加上交易费用。 4. 当价格低于买入价减去阈值M时,产生买入信号;当价格高于卖出价加上阈值M时,产生卖出信号。
策略优势
- 该策略基于Avellaneda-Stoikov模型,是一种经典的做市商策略,有坚实的理论基础。
- 策略考虑了交易费用的影响,更加贴近实际交易情况。
- 通过阈值M的设置,可以灵活调整策略的敏感度,适应不同的市场环境。
- 策略逻辑清晰,易于理解和实现。
策略风险
- 策略的表现依赖于Gamma、Sigma、T、k和M等参数的选择,参数设置不当可能导致策略表现不佳。
- 策略没有考虑市场流动性的影响,在流动性不足的情况下,可能无法按照预期价格成交。
- 该策略为高频交易策略,需要较低的交易延迟和较高的执行效率,实现难度较高。
策略优化方向
- 引入机器学习算法,动态调整策略参数,以适应不同的市场状况。
- 结合其他技术指标或市场微观结构信息,提高信号的准确性。
- 优化交易执行算法,降低交易成本,提高策略收益。
- 考虑引入风险管理模块,控制策略的回撤和风险敞口。
总结
Khaled Tamim的Avellaneda-Stoikov策略是一种基于经典做市商模型的量化交易策略,通过计算买入价和卖出价,同时考虑交易费用,来产生交易信号。该策略优势在于理论基础扎实,逻辑清晰,同时考虑了交易费用的影响。但策略的表现依赖于参数选择,并且需要较高的执行效率。未来可以通过引入机器学习算法、优化交易执行、引入风险管理等方式来进一步优化该策略。
/*backtest
start: 2024-03-01 00:00:00
end: 2024-03-31 23:59:59
period: 4h
basePeriod: 15m
exchanges: [{"eid":"Futures_Binance","currency":"BTC_USDT"}]
*/

//@version=5
strategy("Khaled Tamim's Avellaneda-Stoikov Strategy", overlay=true)

// Avellaneda-Stoikov model logic
avellanedaStoikov(src, gamma, sigma, T, k, M) =>
    midPrice = (src + src[1]) / 2
    sqrtTerm = gamma * sigma * sigma * T
    // Add 0.1% fee to bid and ask quotes
    fee = 0 // 0.1% fee
    bidQuote = midPrice - k * sqrtTerm - (midPrice * fee)
    askQuote = midPrice + k * sqrtTerm + (midPrice * fee)
    longCondition = src < bidQuote - M
    shortCondition = src > askQuote + M
    [bidQuote, askQuote]

// Define strategy parameters
gamma = input.float(2, title="Gamma")
sigma = input.float(8, title="Sigma")
T = input.float(0.0833, title="T")
k = input.float(5, title="k")
M = input.float(0.5, title="M")

// Calculate signals
[bidQuote, askQuote] = avellanedaStoikov(close, gamma, sigma, T, k, M)
longCondition = close < bidQuote - M
shortCondition = close > askQuote + M

// Plot signals
plotshape(series=longCondition ? low : na, title="Buy Signal", location=location.belowbar, color=color.green, style=shape.labelup, text="BUY")
plotshape(series=shortCondition ? high : na, title="Sell Signal", location=location.abovebar, color=color.red, style=shape.labeldown, text="SELL")

// Plot bid and ask prices
plot(bidQuote, title="Bid Price", color=color.blue, linewidth=1)
plot(askQuote, title="Ask Price", color=color.red, linewidth=1)

// Plot inventory level as bars in a separate graph
plot(strategy.netprofit, title="Inventory", color=color.new(color.purple, 80), style=plot.style_columns)


// Strategy logic
if (longCondition)
    strategy.entry("Buy", strategy.long)

if (shortCondition)
    strategy.entry("Sell", strategy.short)
更多内容
- 布林带标准差突破策略
- 随机震荡指标与移动平均线策略
- 枢轴动量策略
- 三重EMA交叉策略
- 移动平均线与RSI综合交易策略
- 指数移动平均线交叉杠杆策略
- 价格行为, 金字塔加仓, 5%止盈, 3%止损
- 周二反转策略(周末过滤)
- 布林带标准差双层过滤五分钟量化交易策略
- 基于枢轴点反转和退出的交易策略
- GM-8 & ADX 双均线策略
- 多时间框架比特币、币安币和以太坊交易回撤策略
- EMA与RSI/MACD/ATR结合的双均线交叉策略
- 斐波那契黄金分割回撤买入策略
- 基于Z值的趋势跟踪策略
- MA99接触与动态止损策略
- Donchian突破交易策略
- Ichimoku Leading Span B 突破策略
- 基于EMA交叉的风险管理型多头策略
- MACD与RSI结合的长线交易策略