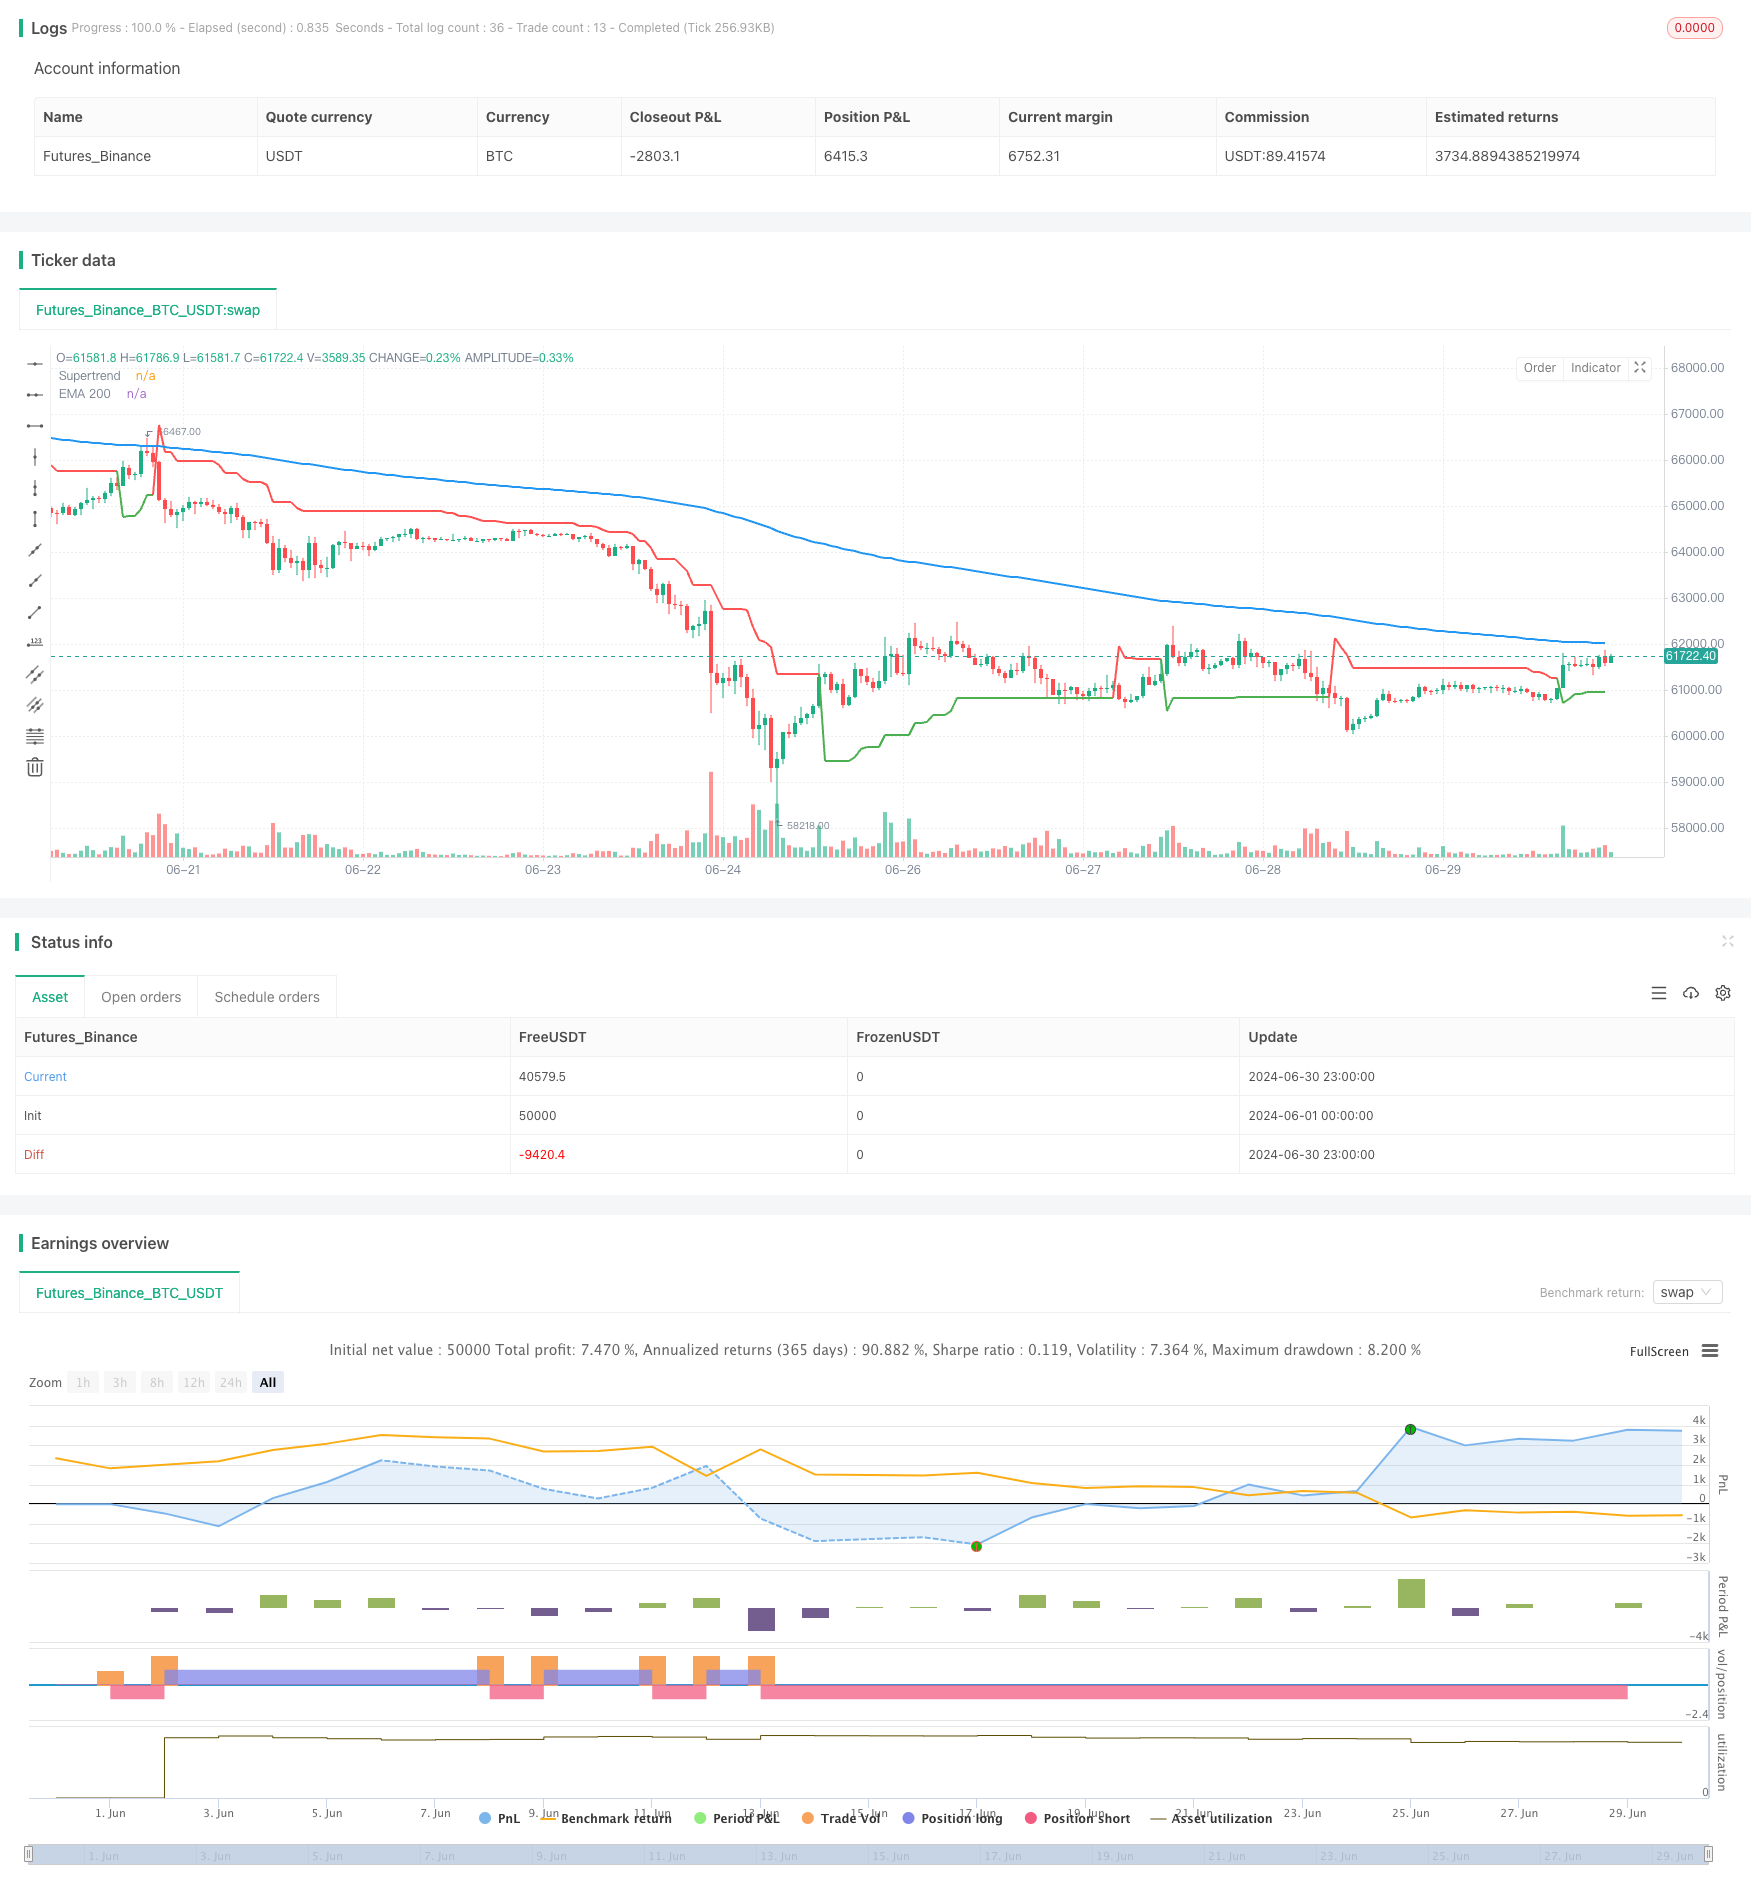
概述
这个策略是一个结合了Supertrend指标和指数移动平均线(EMA)的动态趋势跟踪交易系统。它利用Supertrend指标捕捉市场趋势的变化,同时使用EMA 200作为长期趋势的过滤器。策略还集成了止损(SL)和止盈(TP)机制,以管理风险和锁定利润。这种方法旨在在强劲的趋势市场中获得可观的收益,同时在横盘或波动市场中降低假突破的风险。
策略原理
Supertrend指标计算:
- 使用ATR(平均真实范围)来衡量市场波动性。
- 根据ATR和用户定义的因子计算上下通道。
- Supertrend线根据价格与上下通道的关系动态调整。
EMA 200计算:
- 使用200期指数移动平均线作为长期趋势指标。
交易信号生成:
- 多头信号:当Supertrend转为上升(绿色)且价格位于EMA 200之上时。
- 空头信号:当Supertrend转为下降(红色)且价格位于EMA 200之下时。
风险管理:
- 对每笔交易设置基于百分比的止损和止盈水平。
- 当出现相反的交易信号时,平仓现有头寸。
策略执行:
- 使用TradingView的strategy.entry函数执行交易。
- 通过strategy.close函数在信号反转时平仓。
策略优势
趋势捕捉能力:Supertrend指标能够有效识别和跟踪市场趋势,potentially提高盈利机会。
长期趋势确认:EMA 200作为额外的过滤器,有助于减少逆势交易,提高交易质量。
动态适应:策略能够根据市场波动性自动调整,适应不同的市场条件。
风险管理:集成的止损和止盈机制有助于控制风险和锁定利润,提高整体风险回报比。
多空灵活性:策略可以在多头和空头市场中交易,增加盈利机会。
可视化:通过图表绘制Supertrend和EMA线,交易者可以直观地理解市场状况和策略逻辑。
策略风险
假突破:在横盘市场中,可能会出现频繁的假突破信号,导致过度交易和亏损。
滞后性:EMA 200是一个滞后指标,可能在趋势反转初期错过交易机会。
快速反转:在剧烈的市场波动中,止损可能无法有效执行,导致larger亏损。
参数敏感性:策略性能高度依赖于ATR长度、因子和EMA周期等参数设置。
市场适应性:策略可能在某些市场条件下表现良好,但在其他条件下表现不佳。
过度优化:调整参数以适应历史数据可能导致过度优化,影响未来表现。
策略优化方向
动态参数调整:
- 实现ATR长度和因子的自适应调整,以适应不同的市场波动性。
- 探索使用较短周期的EMA作为辅助确认指标。
多时间框架分析:
- 整合更高时间框架的趋势信息,提高交易决策的准确性。
交易量过滤:
- 添加交易量指标,以确认趋势强度和减少假突破。
优化入场时机:
- 实现回撤入场逻辑,在趋势确立后寻找更好的入场点。
改进风险管理:
- 实现动态止损,如跟踪止损或基于ATR的止损。
- 探索部分获利策略,在达到某个盈利目标时平掉部分仓位。
市场状态分类:
- 开发算法来识别当前市场状态(趋势、区间),并相应地调整策略参数。
机器学习整合:
- 使用机器学习算法优化参数选择和信号生成。
回测和验证:
- 在不同的市场和时间范围内进行广泛的回测,以评估策略的稳健性。
- 实现步进前向分析(walk-forward analysis)来减少过度优化的风险。
总结
Supertrend与EMA结合的动态趋势跟踪策略是一个全面的交易系统,旨在捕捉市场趋势并管理风险。通过结合Supertrend的动态特性与EMA 200的长期趋势确认,该策略提供了一个可靠的交易框架。集成的止损和止盈机制进一步增强了风险管理能力。
然而,像所有交易策略一样,它并非没有风险。假突破、参数敏感性和市场适应性等问题需要仔细考虑和管理。通过持续优化和改进,如实现动态参数调整、多时间框架分析和高级风险管理技术,可以进一步提高策略的性能和稳健性。
最终,该策略为交易者提供了一个强大的起点,可以根据个人交易风格和风险承受能力进行定制和改进。通过深入理解策略的优势和局限性,交易者可以做出明智的决策,在追求利润的同时有效管理风险。
/*backtest
start: 2024-06-01 00:00:00
end: 2024-06-30 23:59:59
period: 1h
basePeriod: 15m
exchanges: [{"eid":"Futures_Binance","currency":"BTC_USDT"}]
*/

//@version=5
strategy("Supertrend + EMA 200 Strategy with SL and TP", overlay=true)

// Inputs for Supertrend
atr_length = input.int(10, title="ATR Length")
factor = input.float(3.0, title="ATR Factor")

// Input for EMA
ema_length = input.int(200, title="EMA Length")

// Inputs for Stop Loss and Take Profit
stop_loss_perc = input.float(1.0, title="Stop Loss Percentage", step=0.1) / 100
take_profit_perc = input.float(5.0, title="Take Profit Percentage", step=0.1) / 100

// Calculate EMA 200
ema_200 = ta.ema(close, ema_length)

// Calculate Supertrend
atr = ta.atr(atr_length)
upperband = hl2 + (factor * atr)
lowerband = hl2 - (factor * atr)

var float supertrend = na
var int direction = na

// Initialize supertrend on first bar
if (na(supertrend[1]))
    supertrend := lowerband
    direction := 1
else
    // Update supertrend value
    if (direction == 1)
        supertrend := close < supertrend[1] ? upperband : math.max(supertrend[1], lowerband)
    else
        supertrend := close > supertrend[1] ? lowerband : math.min(supertrend[1], upperband)

    // Update direction
    direction := close > supertrend ? 1 : -1

// Long condition: Supertrend is green and price is above EMA 200
longCondition = direction == 1 and close > ema_200

// Short condition: Supertrend is red and price is below EMA 200
shortCondition = direction == -1 and close < ema_200

// Plot EMA 200
plot(ema_200, title="EMA 200", color=color.blue, linewidth=2)

// Plot Supertrend
plot(supertrend, title="Supertrend", color=direction == 1 ? color.green : color.red, linewidth=2)

// Calculate stop loss and take profit levels for long positions
long_stop_loss = close * (1 - stop_loss_perc)
long_take_profit = close * (1 + take_profit_perc)

// Calculate stop loss and take profit levels for short positions
short_stop_loss = close * (1 + stop_loss_perc)
short_take_profit = close * (1 - take_profit_perc)

// Strategy Entry and Exit for Long Positions
if (longCondition and not na(supertrend))
    strategy.entry("Long", strategy.long, stop=long_stop_loss, limit=long_take_profit)

if (strategy.position_size > 0 and shortCondition)
    strategy.close("Long")

// Strategy Entry and Exit for Short Positions
if (shortCondition and not na(supertrend))
    strategy.entry("Short", strategy.short, stop=short_stop_loss, limit=short_take_profit)

if (strategy.position_size < 0 and longCondition)
    strategy.close("Short")