多指标结合期权交易策略
Author: ChaoZhang, Date: 2024-07-29 16:49:42Tags: RSIMACDKST
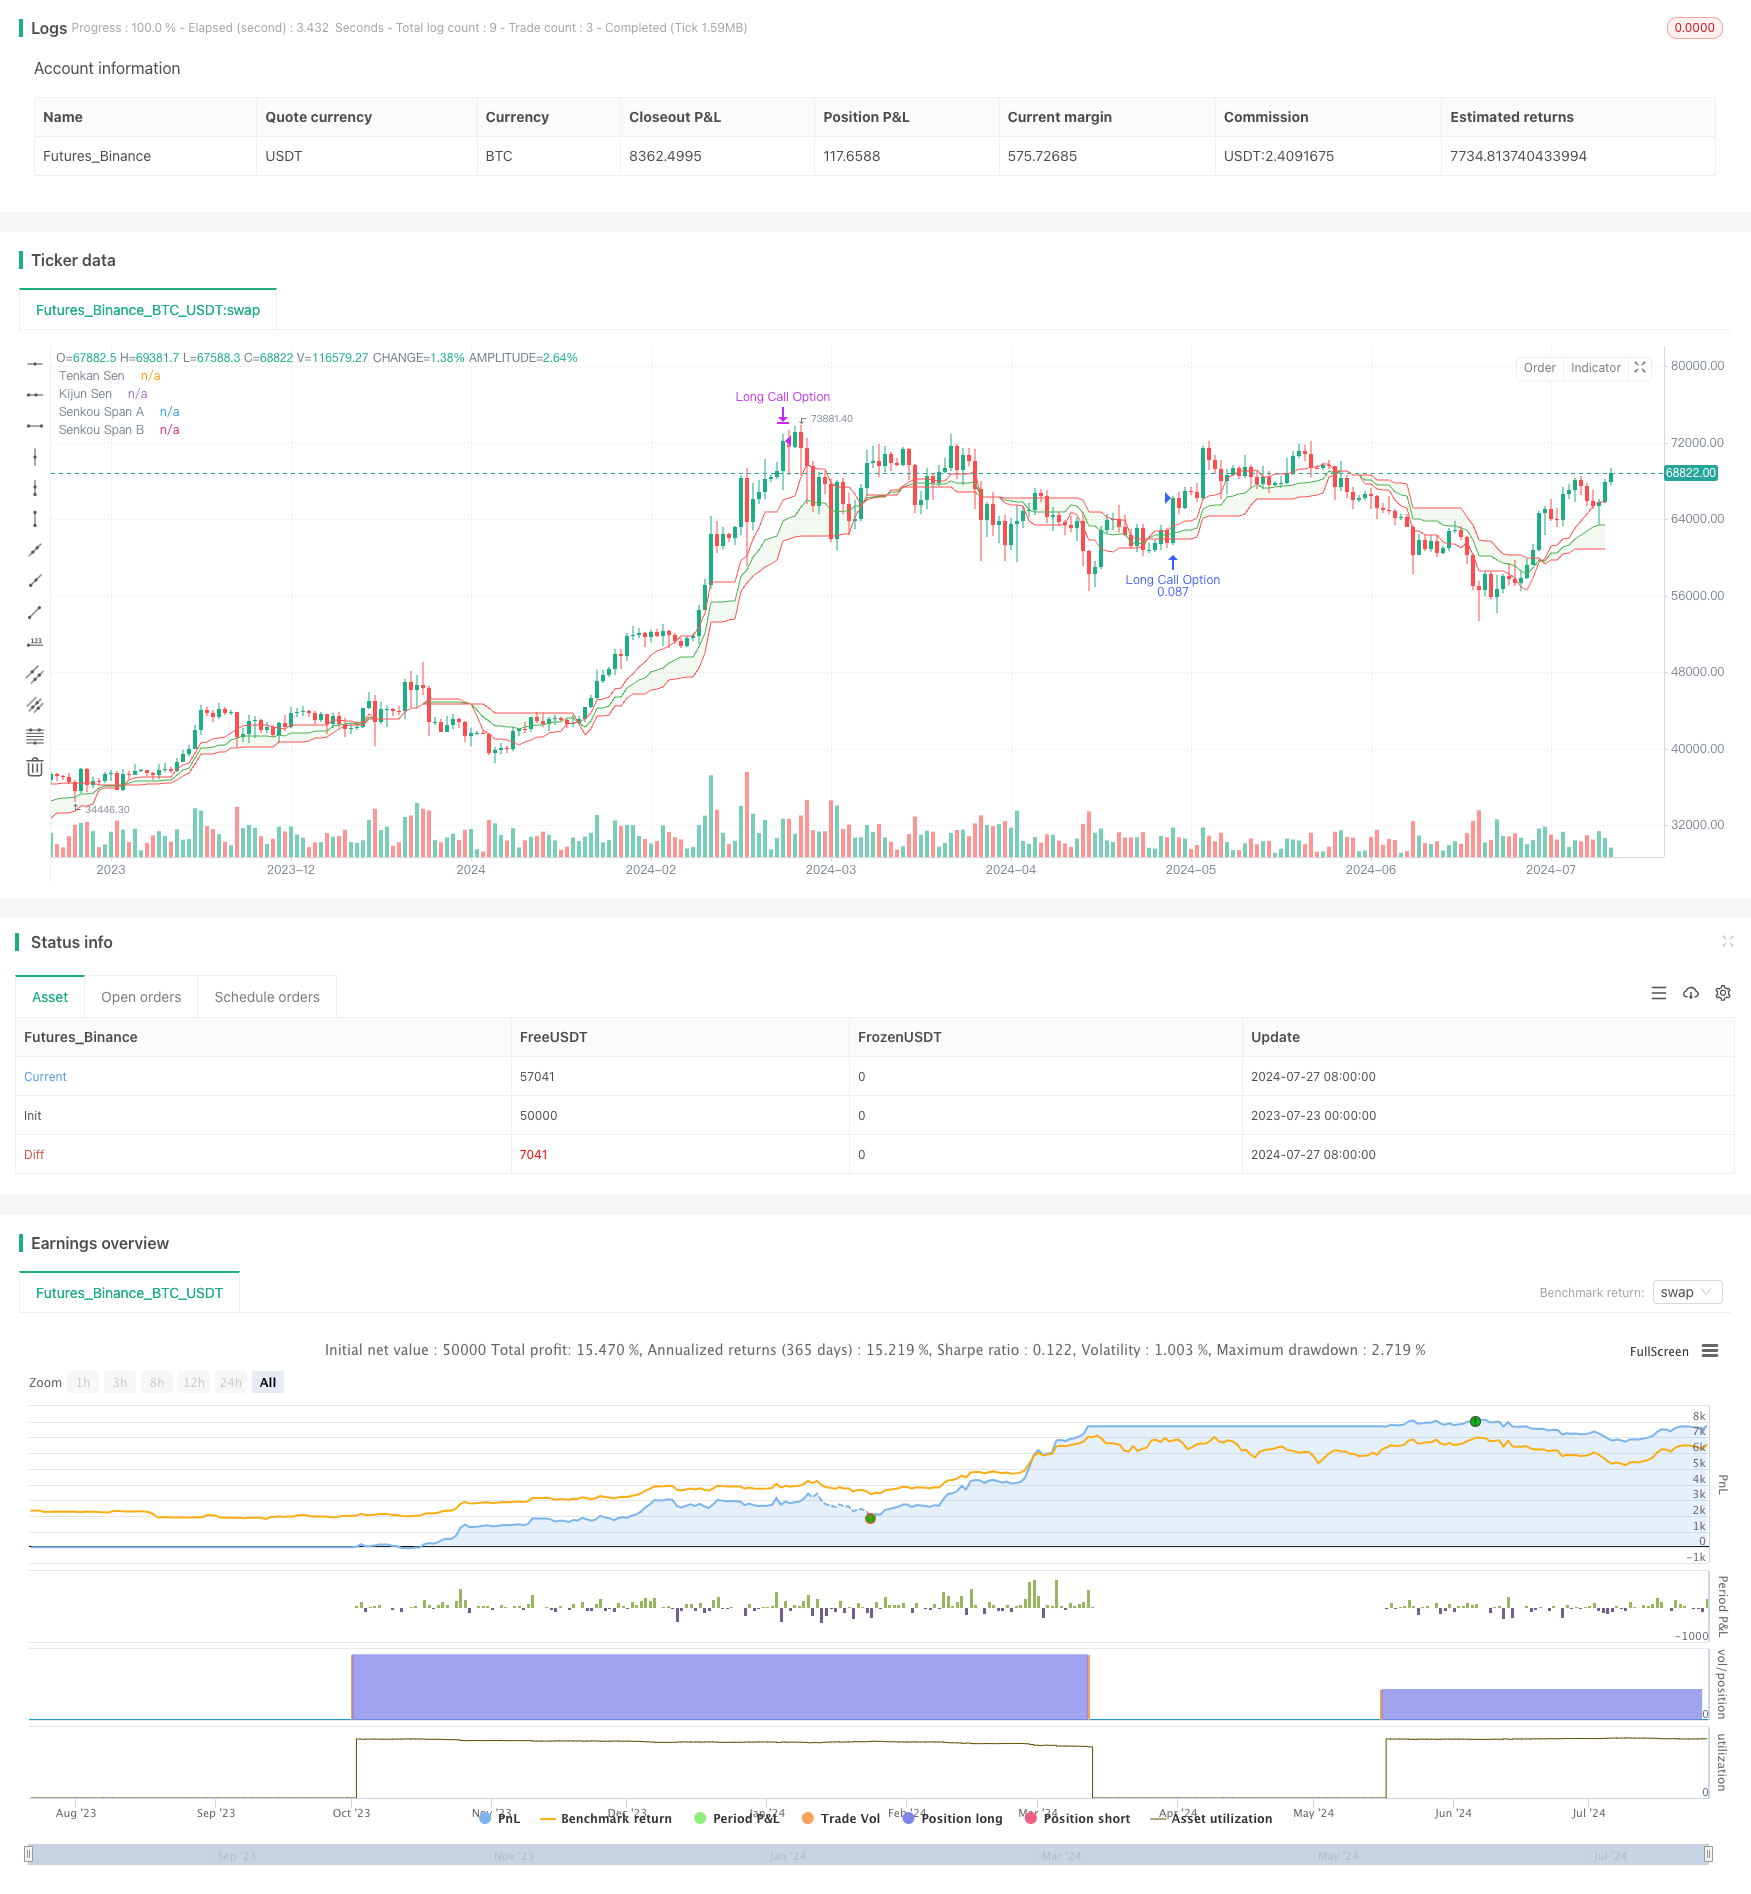
该策略是一个基于多个技术指标的期权交易策略,结合了市场趋势和动量指标来识别潜在的交易机会。策略利用一分钟图表上的价格与云图的相对位置、RSI超买条件以及MACD和KST指标的牛市交叉来触发交易信号。当所有条件都满足时,策略会开仓做多期权,并在达到30%的利润目标时平仓。这种方法旨在捕捉短期的上涨趋势,同时通过多重确认来降低假信号的风险。
策略原理
进场条件:
- 价格从下方进入绿色云图
- RSI低于70(避免超买)
- MACD线上穿信号线
- KST线上穿信号线
出场条件:
- 达到30%的利润目标
策略使用Ichimoku云图来确定整体趋势,RSI来避免在过度超买的情况下入场,MACD和KST指标的交叉则用于确认短期动量。这种多重确认机制旨在提高交易信号的可靠性。
策略优势
- 多重确认:结合多个技术指标,降低了假信号的风险。
- 趋势跟随:利用Ichimoku云图捕捉趋势变化。
- 动量确认:MACD和KST交叉提供了额外的动量确认。
- 风险管理:使用RSI避免在过度超买的情况下入场。
- 清晰的盈利目标:30%的利润目标提供了明确的退出策略。
- 适应性:可以根据不同市场条件调整参数。
策略风险
- 过度交易:频繁的短期交易可能导致高昂的交易成本。
- 错过大趋势:固定的30%利润目标可能导致过早退出强劲趋势。
- 滑点风险:在快速市场中,可能无法以理想价格执行交易。
- 参数敏感性:策略表现可能对参数设置高度敏感。
- 市场条件变化:在不同的市场环境下,策略效果可能会有显著差异。
策略优化方向
- 动态止盈:考虑使用跟踪止损或基于波动率的动态止盈,以适应不同市场条件。
- 时间过滤:增加交易时间窗口的限制,避免在波动较大的时段交易。
- 波动率调整:根据市场波动率动态调整进场和出场条件。
- 多时间框架分析:结合更长时间周期的分析,提高交易决策的可靠性。
- 机器学习优化:使用机器学习算法优化参数选择和信号生成。
总结
这个多指标期权交易策略通过结合Ichimoku云图、RSI、MACD和KST指标,为短期交易提供了一个全面的框架。虽然策略具有多重确认机制和明确的风险管理规则,但仍需要traders谨慎使用并持续监控其表现。通过进一步的优化和回测,该策略有潜力成为一个有效的短期交易工具。然而,使用者应该注意市场条件变化对策略表现的影响,并准备根据实际交易结果进行必要的调整。
/*backtest
start: 2023-07-23 00:00:00
end: 2024-07-28 00:00:00
period: 1d
basePeriod: 1h
exchanges: [{"eid":"Futures_Binance","currency":"BTC_USDT"}]
*/

//@version=5
strategy("Ichimoku + RSI + MACD + KST Options Strategy", overlay=true, default_qty_type=strategy.percent_of_equity, default_qty_value=10)

// Ichimoku Cloud settings
tenkanLength = input(9, title="Tenkan Length")
kijunLength = input(26, title="Kijun Length")
senkouLengthA = input(52, title="Senkou Length A")
senkouLengthB = input(26, title="Senkou Length B")
displacement = input(26, title="Displacement")

// RSI settings
rsiLength = input(14, title="RSI Length")
rsiOverbought = input(70, title="RSI Overbought Level")

// MACD settings
[macdLine, signalLine, _] = ta.macd(close, 12, 26, 9)

// KST settings
roc1 = ta.roc(close, 10)
roc2 = ta.roc(close, 15)
roc3 = ta.roc(close, 20)
roc4 = ta.roc(close, 30)
kst = roc1 * 1 + roc2 * 2 + roc3 * 3 + roc4 * 4
signalKst = ta.sma(kst, 9)

// Calculate Ichimoku Cloud
donchian(len) => math.avg(ta.lowest(len), ta.highest(len))
tenkanSen = donchian(tenkanLength)
kijunSen = donchian(kijunLength)
senkouSpanA = math.avg(tenkanSen, kijunSen)
senkouSpanB = donchian(senkouLengthB)

// Check if price entered the green cloud from below
priceEnteredCloudFromBelow = close[1] < senkouSpanA[displacement] and close > senkouSpanA[displacement] and senkouSpanA > senkouSpanB

// Check RSI and indicator crossovers
rsi = ta.rsi(close, rsiLength)
bullishCrossover = macdLine > signalLine and kst > signalKst

// Entry condition
if priceEnteredCloudFromBelow and rsi < rsiOverbought and bullishCrossover
    strategy.entry("Long Call Option", strategy.long)

// Exit condition based on profit target
for trade_num = 0 to strategy.opentrades - 1
    if strategy.opentrades.profit(trade_num) >= strategy.opentrades.entry_price(trade_num) * 0.30
        strategy.close("Long Call Option")

// Plotting
plot(tenkanSen, title="Tenkan Sen", color=color.red)
plot(kijunSen, title="Kijun Sen", color=color.blue)
p1 = plot(senkouSpanA, title="Senkou Span A", color=color.green)
p2 = plot(senkouSpanB, title="Senkou Span B", color=color.red)
fill(p1, p2, color=color.new(color.green, 90), title="Cloud")
相关内容
- Price Divergence Strategy v1.0
- 动态趋势动量优化策略结合G通道指标
- RSI-MACD多重信号交易系统结合动态止盈止损策略
- 趋势追踪型云图动量背离策略
- MACD与RSI结合的长线交易策略
- 多指标背离买卖策略与自适应止盈止损
- RSI与MACD结合的多空策略
- Darvas 盒子突破与风险管理策略
- 基于RSI和MACD的五日内交叉灵活入场策略优化版本研究
- 多重指标智能金字塔策略
更多内容
- EMA交叉与布林带双重入场策略:结合趋势跟踪与波动突破的量化交易系统
- 自适应趋势跟踪交易策略:200均线突破与动态风险管理系统
- 多周期市场动量交叉策略
- 多重指标趋势追踪策略
- ChandelierExit-EMA动态止损趋势跟踪策略
- 多指标背离买卖策略与自适应止盈止损
- 突破区间动量交易策略
- 基于超级趋势指标的精准交易策略与风险管理系统
- 均线交叉、相对强弱指标、成交量价格趋势、吞没形态策略
- 魔法通道价格行为交易策略
- 双均线均值回归策略结合风险控制
- 双均线趋势跟踪策略与RSI过滤器
- 多重EMA交叉结合斐波那契扩展的趋势跟踪策略
- 多重指数移动平均交叉策略
- SMA交叉结合超趋势的自适应动量交易策略
- 加权移动平均线和相对强弱指数交叉策略与风险管理优化系统
- 双重平滑海肯阿希趋势跟随策略
- RSI 反转交叉动量盈利目标量化交易策略
- 多指标融合的自适应趋势跟踪策略
- 多指标综合交易策略:动量、超买超卖与波动率的完美结合