概述
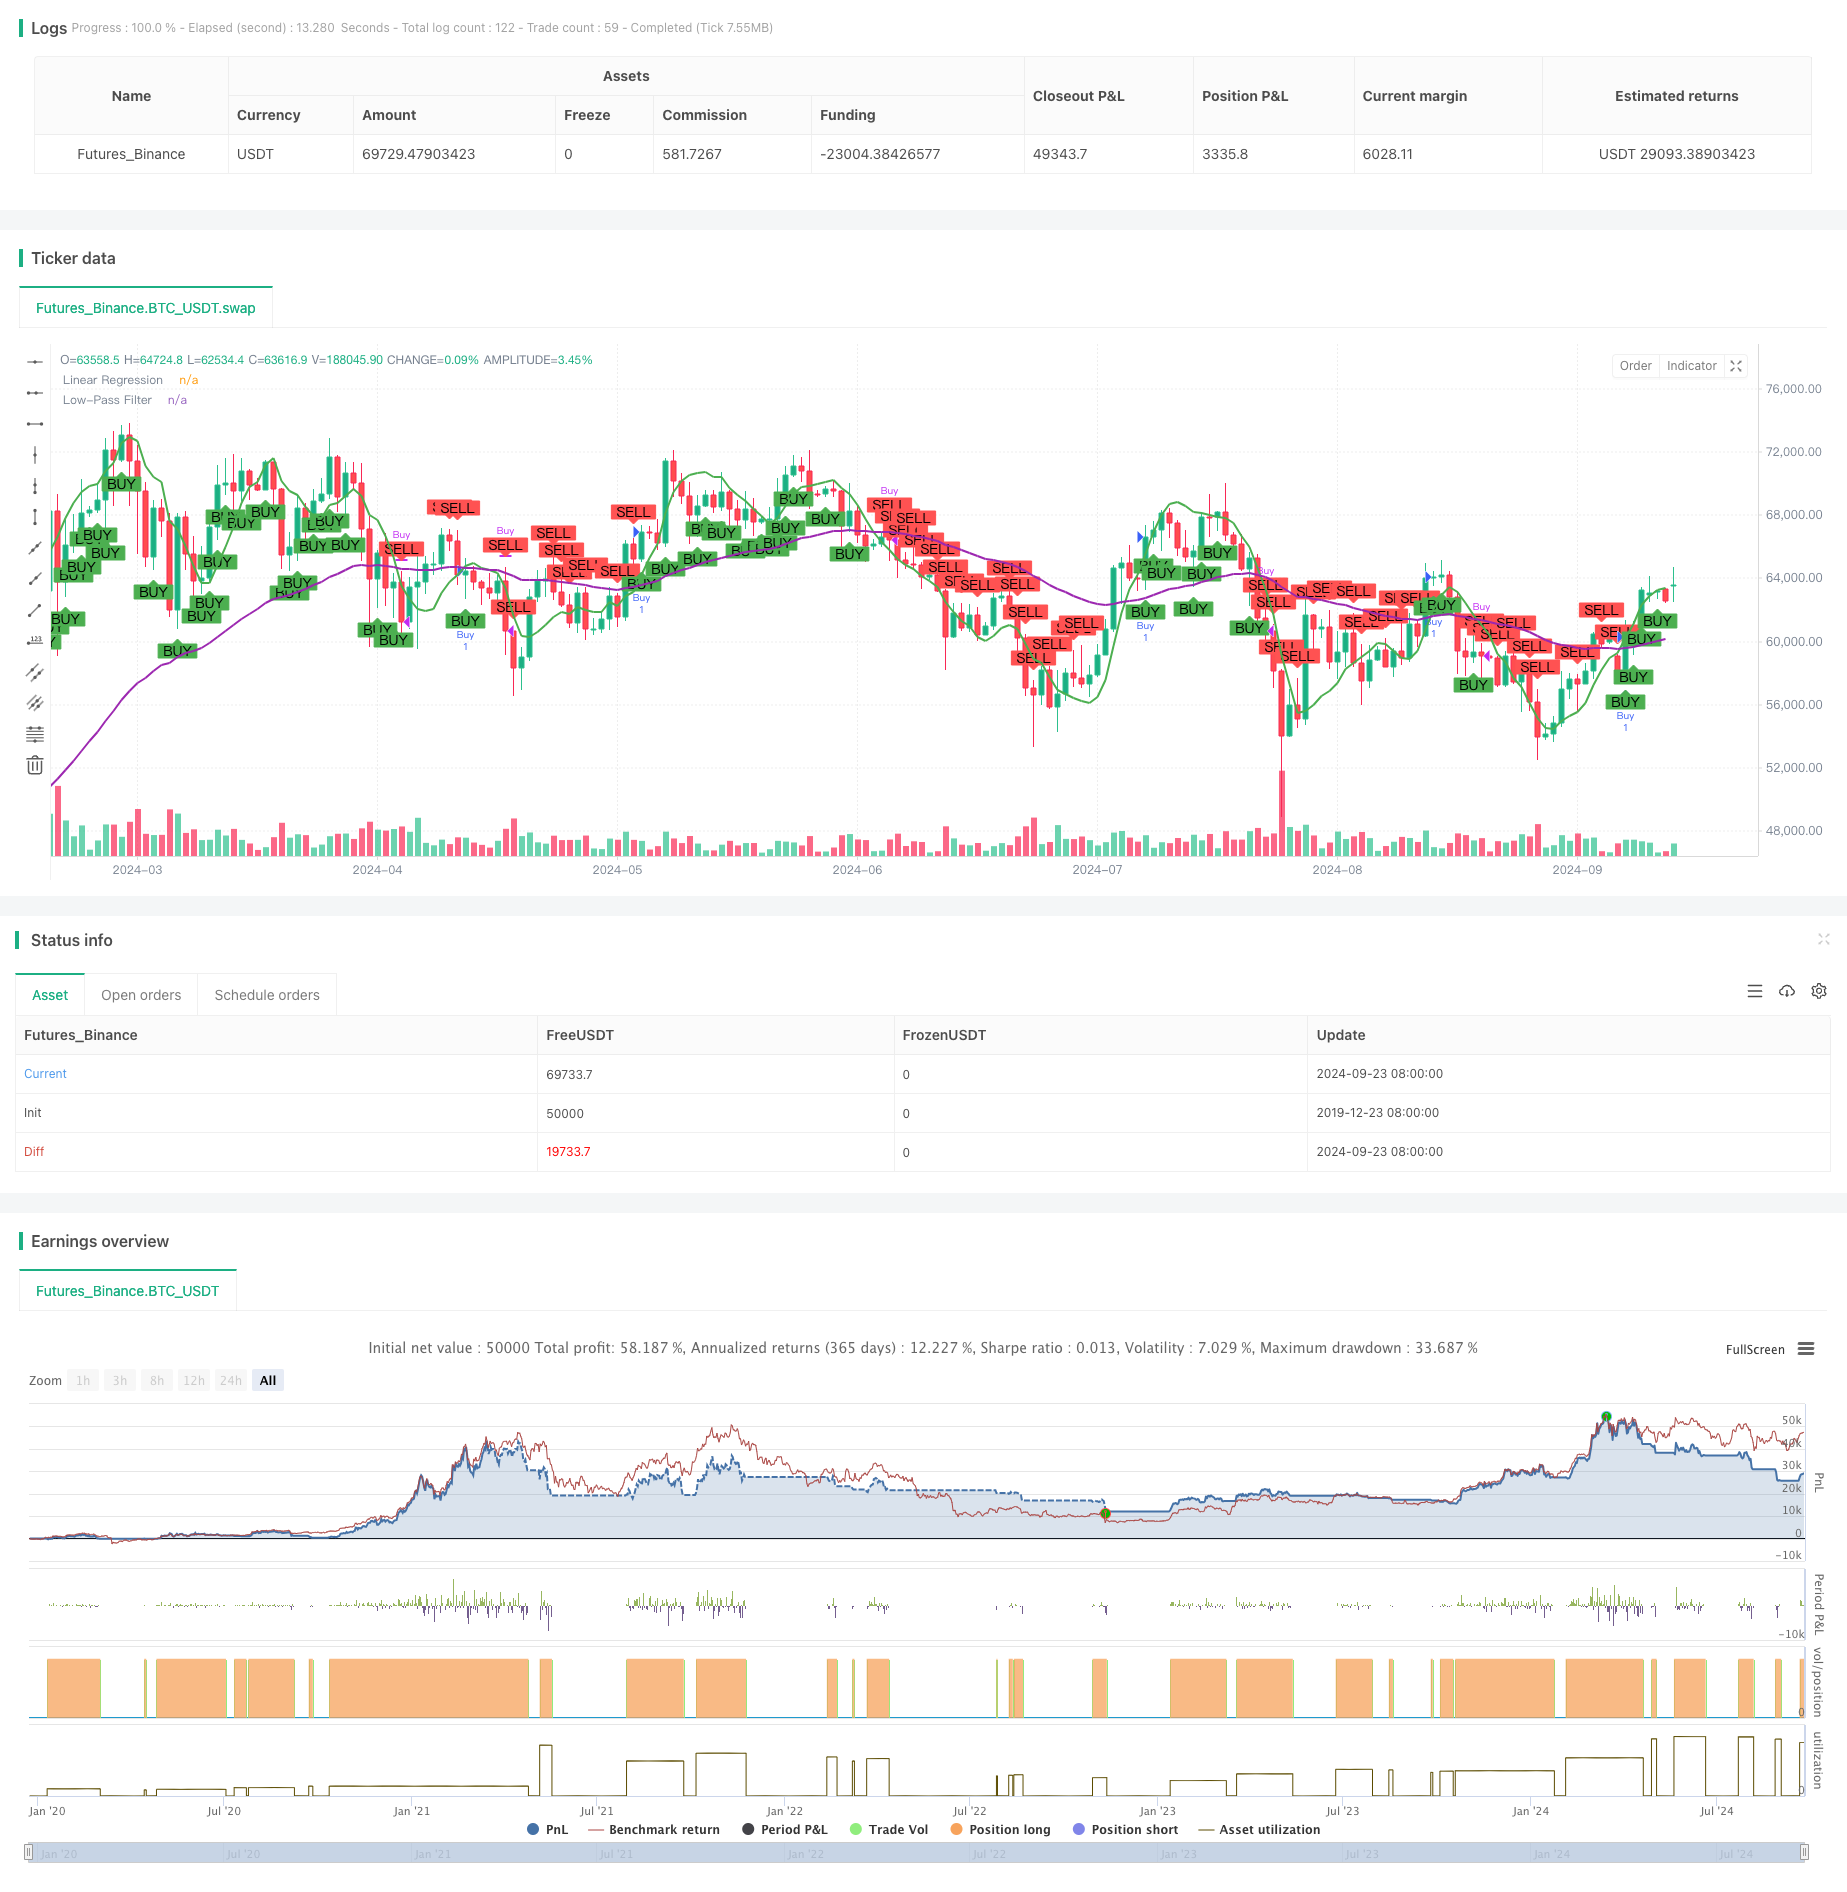
该策略是一种基于多维度数学模型的高级交易策略,利用多个数学函数和技术指标来生成交易信号。策略结合了动量、趋势和波动性分析,通过整合多个维度的市场信息来做出更全面的交易决策。
策略原理
该策略的核心原理是通过多个数学模型和技术指标来分析市场的不同方面:
- 使用变化率(ROC)指标来计算价格的动量和方向。
- 应用线性回归(Linear Regression)来识别短期价格趋势。
- 使用指数移动平均线(EMA)作为低通滤波器,以捕捉长期趋势。
- 通过Sigmoid函数来调整价格变化的波动性。
策略综合考虑这些因素,当动量为正、短期趋势上升、长期趋势确认,且波动性适中时发出买入信号。相反的条件组合则触发卖出信号。
策略优势
- 多维度分析:通过结合多个数学模型和指标,策略能够从不同角度分析市场,提高决策的全面性和准确性。
- 自适应性:使用Sigmoid函数调整波动性,使策略能够适应不同的市场条件。
- 趋势确认:结合短期和长期趋势分析,有助于减少假突破带来的风险。
- 可视化:策略在图表上绘制了线性回归线和低通滤波线,便于交易者直观理解市场走势。
策略风险
- 过度拟合:使用多个指标可能导致策略在历史数据上表现良好,但在实际交易中效果不佳。
- 滞后性:部分指标如EMA存在滞后性,可能导致入场或出场时机不够及时。
- 市场条件敏感:在剧烈波动或趋势突变的市场中,策略可能表现不佳。
- 参数敏感性:多个指标的参数设置可能对策略性能产生重大影响,需要仔细优化。
策略优化方向
- 动态参数调整:可以考虑根据市场波动性动态调整指标参数,以适应不同的市场环境。
- 增加过滤器:引入额外的过滤条件,如交易量分析或市场宽度指标,以减少假信号。
- 优化退出策略:当前策略主要关注入场点,可以开发更复杂的退出机制来优化整体性能。
- 引入机器学习:考虑使用机器学习算法来优化指标权重或识别最佳的交易机会。
总结
多维度数学模型交易策略是一种综合性强、理论基础扎实的交易方法。通过结合多个数学模型和技术指标,该策略能够从多个角度分析市场,提高交易决策的准确性。然而,策略的复杂性也带来了过度拟合和参数敏感性等风险。未来的优化方向应该注重提高策略的自适应能力和鲁棒性,以在不同市场环境中保持稳定表现。总的来说,这是一个具有潜力的策略框架,通过持续优化和测试,有望成为一个可靠的交易工具。
策略源码
/*backtest
start: 2019-12-23 08:00:00
end: 2024-09-24 08:00:00
period: 1d
basePeriod: 1d
exchanges: [{"eid":"Futures_Binance","currency":"BTC_USDT"}]
*/

//@version=5
strategy("Advanced Math Strategy", overlay=true)

// =======================
// ฟังก์ชันที่ใช้คำนวณเบื้องหลัง
// =======================

// ฟังก์ชันซิกมอยด์
sigmoid(x) =>
    1 / (1 + math.exp(-x))

// ฟังก์ชันหาอัตราการเปลี่ยนแปลง (Derivative)
roc = ta.roc(close, 1)

// ฟังก์ชันการถดถอยเชิงเส้น (Linear Regression)
linReg = ta.linreg(close, 14, 0)

// ฟังก์ชันตัวกรองความถี่ต่ำ (Low-pass filter)
lowPass = ta.ema(close, 50)

// =======================
// การคำนวณสัญญาณ Buy/Sell
// =======================

// การคำนวณอนุพันธ์สำหรับทิศทางการเคลื่อนที่ของราคา
derivativeSignal = roc > 0 ? 1 : -1

// ใช้ Linear Regression และ Low-pass Filter เพื่อช่วยในการหาจุดกลับตัว
trendSignal = linReg > lowPass ? 1 : -1

// ใช้ฟังก์ชันซิกมอยด์เพื่อปรับความผันผวนของราคา
priceChange = close - close[1]
volatilityAdjustment = sigmoid(priceChange)

// สร้างสัญญาณ Buy/Sell โดยผสมผลจากการคำนวณเบื้องหลังทั้งหมด
buySignal = derivativeSignal == 1 and trendSignal == 1 and volatilityAdjustment > 0.5
sellSignal = derivativeSignal == -1 and trendSignal == -1 and volatilityAdjustment < 0.5

// =======================
// การสั่ง Buy/Sell บนกราฟ
// =======================

// ถ้าเกิดสัญญาณ Buy
if (buySignal)
    strategy.entry("Buy", strategy.long)

// ถ้าเกิดสัญญาณ Sell
if (sellSignal)
    strategy.close("Buy")

// =======================
// การแสดงผลบนกราฟ
// =======================

// วาดเส้นถดถอยเชิงเส้นบนกราฟ
plot(linReg, color=color.green, linewidth=2, title="Linear Regression")

// วาดตัวกรองความถี่ต่ำ (Low-pass filter)
plot(lowPass, color=color.purple, linewidth=2, title="Low-Pass Filter")

// วาดจุด Buy/Sell บนกราฟ
plotshape(series=buySignal, title="Buy Signal", location=location.belowbar, color=color.green, style=shape.labelup, text="BUY")
plotshape(series=sellSignal, title="Sell Signal", location=location.abovebar, color=color.red, style=shape.labeldown, text="SELL")
相关推荐
- 多重动量线性回归交叉策略
- Super Trend Daily 2.0 BF
- MACD动态波动交叉预测策略
- 三重EMA平滑动量与资金流量综合交易策略
- 多周期均线趋势动量跟踪交易策略
- 年末趋势跟踪动量交易策略(60日均线突破)
- 零延迟趋势动量指标交易策略
- 基于波动率止损的均线趋势跟踪交易策略
- 高频量化多周期热图狙击策略
- 多重均线成交量净值震荡趋势转换交易策略
更多内容
- 基于EMA指标的跨市场多空趋势隔夜持仓策略
- 基于多重技术指标的均值回归趋势跟踪策略
- WebSocket 加速驱动
- 多平台期货资金费率获取与监控策略
- EMA/MACD/RSI 交叉策略
- 多指标交叉动量交易策略结合止盈止损优化系统
- 波动率停止云策略与均线交叉系统
- 布林带精确交叉突破量化策略
- 动态风险管理的均线交叉与布林带策略
- 多级平衡量化交易策略
- EMA交叉Fibonacci反转策略
- 基于斐波那契回撤的自适应多级别交易策略
- 布林带超买超卖策略
- 多周期EMA交叉结合VWAP的高胜率日内交易策略
- 增强型突破策略与目标和止损优化
- 双均线通道趋势跟踪策略
- 多指标动态适应型动量交易策略
- Bollinger Bands动量反转量化策略
- 基于双均线的黄金交叉自适应风险管理策略
- 趋势跟踪与动量结合的双指标交易策略