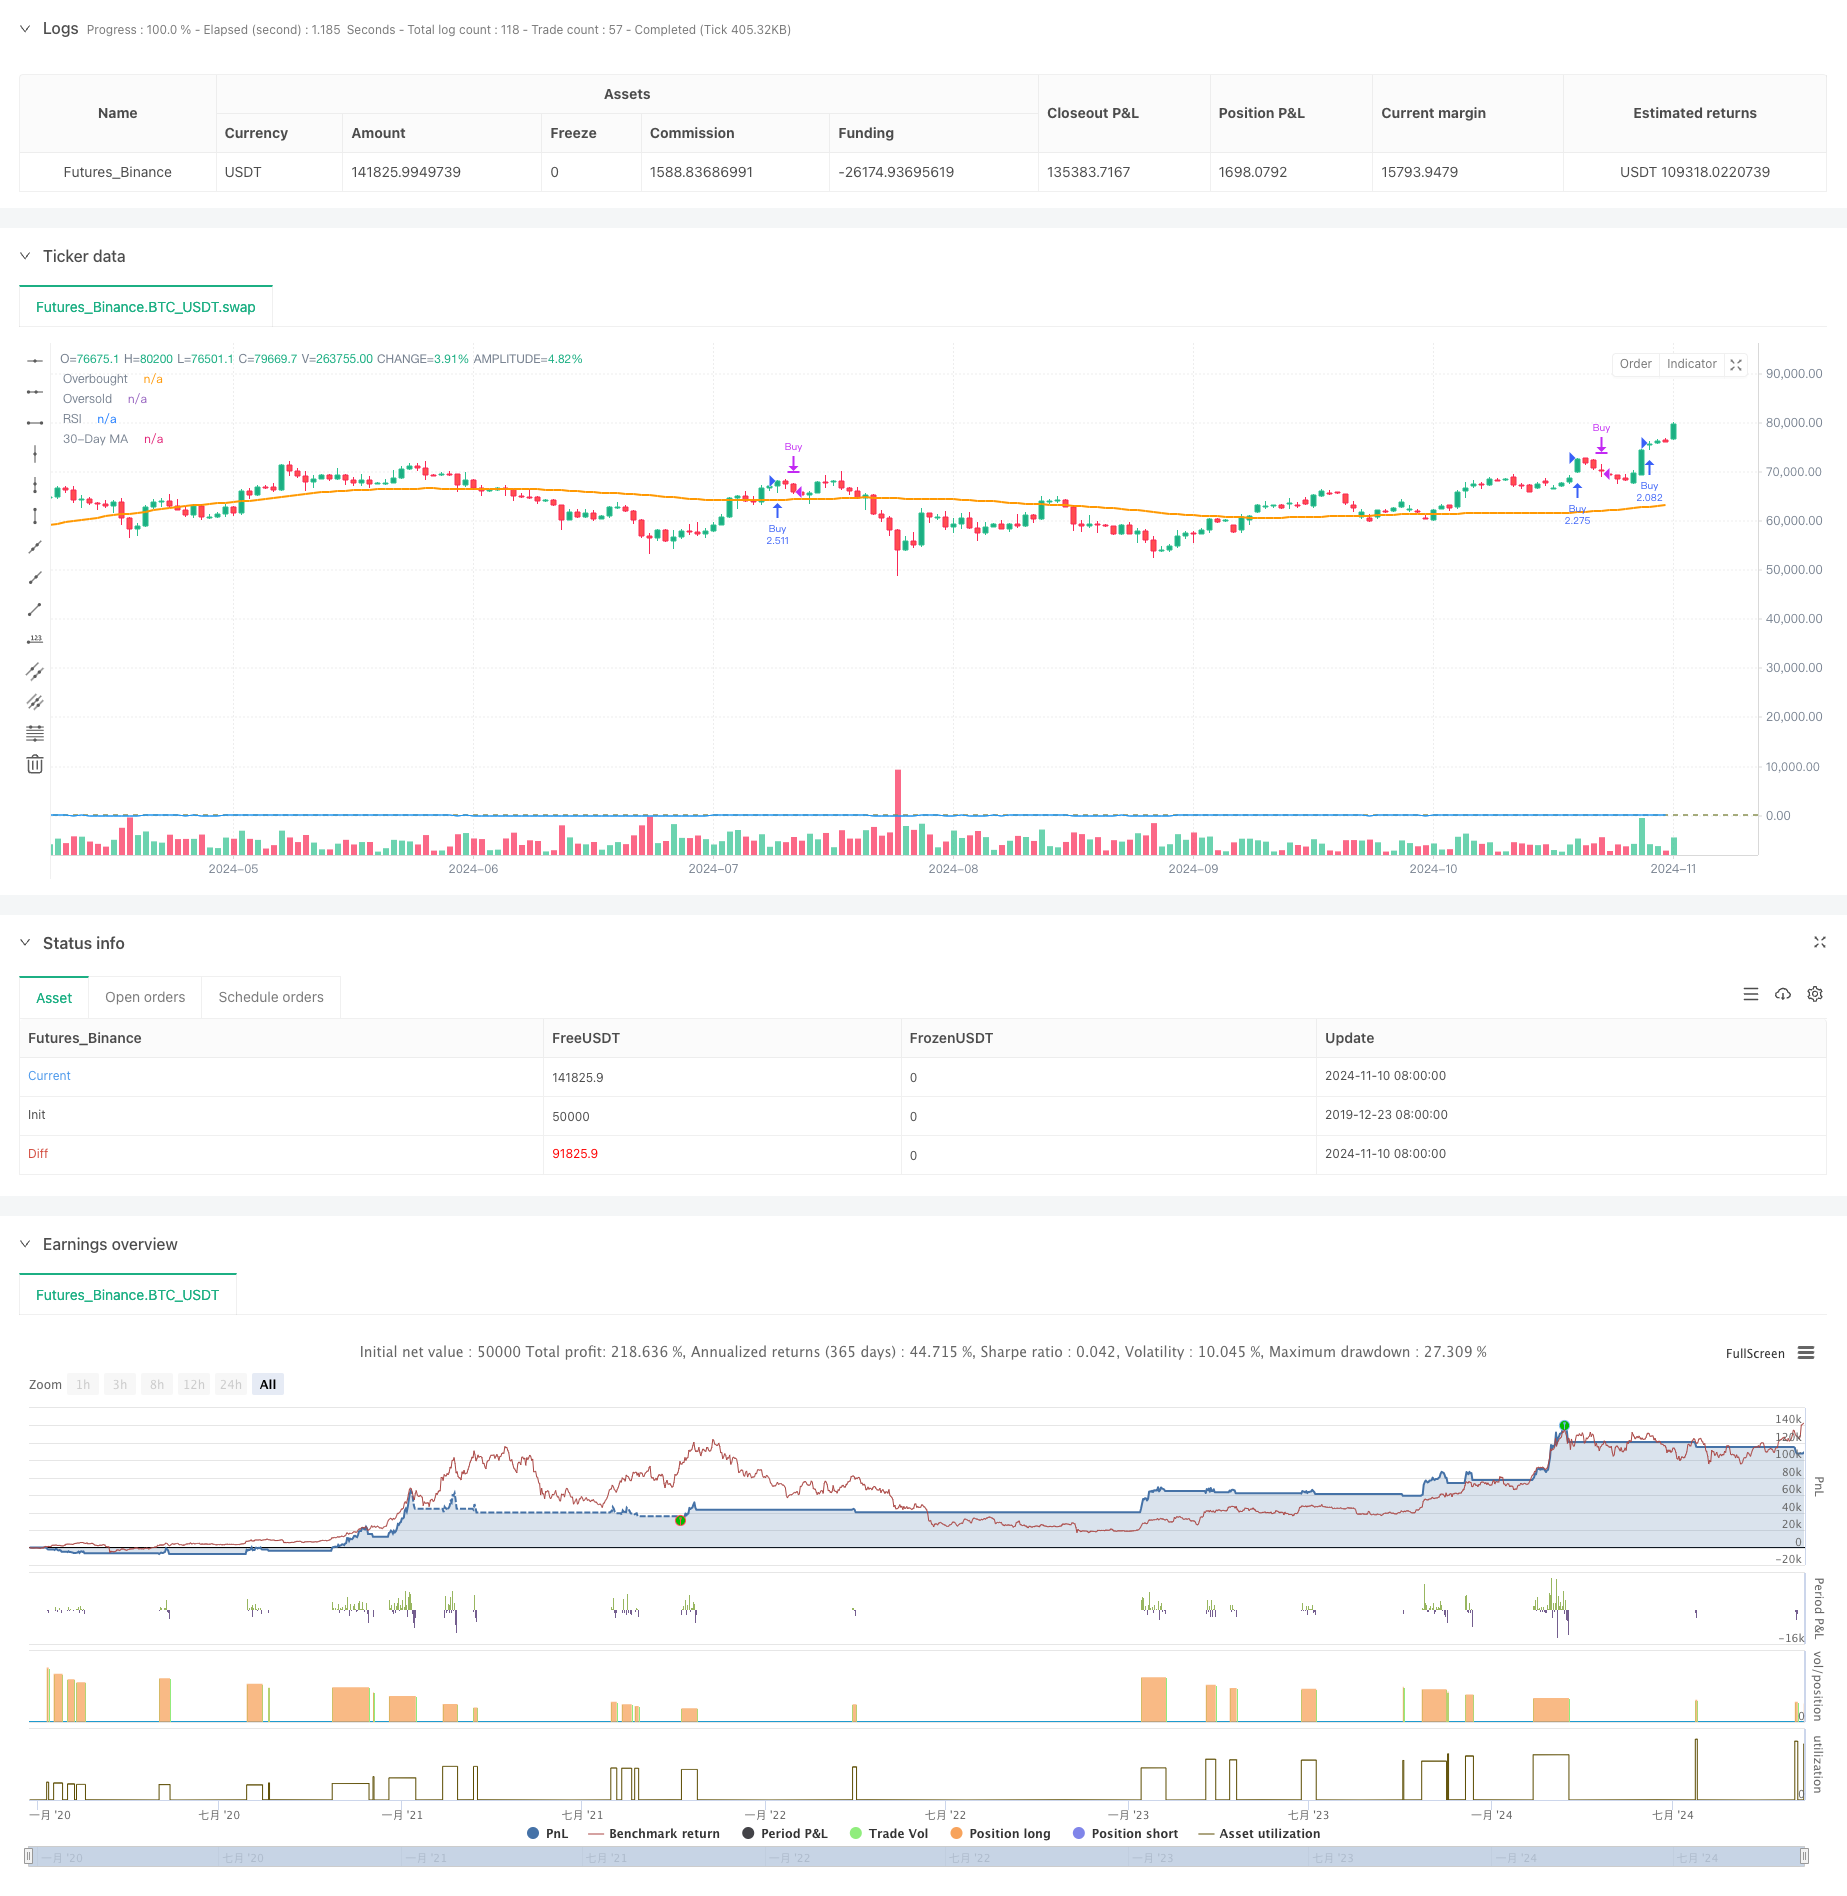
概述
本策略是一个基于相对强弱指标(RSI)与移动平均线(MA)相结合的趋势跟踪交易系统。策略核心是通过RSI指标捕捉价格动量变化,同时结合90日移动平均线作为趋势过滤器,实现对市场趋势的有效跟踪。策略采用可调节的RSI超买超卖阈值,并设定了2500天的回测期限制,以保证策略的实用性和稳定性。
策略原理
策略主要基于以下几个核心组件: 1. RSI指标设置:采用12周期RSI,通过设定70和62作为超买超卖阈值来捕捉市场动量。 2. 移动平均线:使用90日移动平均线作为趋势确认指标。 3. 仓位管理:在出现做多信号时,系统会根据当前账户权益自动计算开仓数量。 4. 时间窗口:引入2500天的回测期限制,确保策略在合理的时间范围内运行。
买入条件触发需要RSI值上穿70,而卖出信号则在RSI下穿62时产生。系统会在符合开仓条件且处于有效回测期内时,自动计算并执行全仓开仓操作。
策略优势
- 动态适应性:可调节的RSI阈值使策略能够适应不同市场环境
- 风险控制完善:结合RSI和均线双重确认,降低假突破风险
- 仓位管理科学:基于账户权益的动态仓位管理确保资金利用效率
- 时间窗口合理:2500天的回测期限制避免过度拟合历史数据
- 可视化支持:策略提供RSI和均线的实时可视化,便于监控和调整
策略风险
- 趋势反转风险:在剧烈波动市场中可能出现假突破
- 参数敏感性:RSI和均线周期的选择对策略表现影响较大
- 滑点影响:全仓操作在流动性不足时可能面临滑点风险
- 回测期限制:固定的回测期可能错过某些历史模式
风险控制建议: - 建议根据不同市场特征动态调整RSI阈值 - 可以添加止损止盈功能增强风险管理 - 考虑分批建仓以降低滑点影响 - 定期评估参数有效性
策略优化方向
信号系统优化:
- 增加更多技术指标作为辅助确认
- 引入成交量分析增强信号可靠性
仓位管理优化:
- 实现分批建仓和减仓机制
- 添加动态止损止盈功能
风险控制优化:
- 引入波动率自适应机制
- 增加市场环境分析模块
回测系统优化:
- 添加更多回测统计指标
- 实现自动参数优化功能
总结
该策略通过结合RSI动量指标和均线趋势过滤器,构建了一个相对完善的交易系统。策略的优势在于其适应性强、风险控制完善,但仍需注意参数敏感性和市场环境变化带来的影响。通过建议的优化方向,策略还有较大的改进空间,可以进一步提升其稳定性和盈利能力。
策略源码
/*backtest
start: 2019-12-23 08:00:00
end: 2024-11-11 00:00:00
period: 1d
basePeriod: 1d
exchanges: [{"eid":"Futures_Binance","currency":"BTC_USDT"}]
*/

//@version=5
strategy("Simple RSI Strategy - Adjustable Levels with Lookback Limit and 30-Day MA", overlay=true)

// Parameters
rsi_length = input.int(12, title="RSI Length", minval=1)  // RSI period
rsi_overbought = input.int(70, title="RSI Overbought Level", minval=1, maxval=100)  // Overbought level
rsi_oversold = input.int(62, title="RSI Oversold Level", minval=1, maxval=100)  // Oversold level
ma_length = input.int(90, title="Moving Average Length", minval=1)  // Moving Average period

// Calculate lookback period (2000 days)
lookback_period = 2500
start_date = timestamp(year(timenow), month(timenow), dayofmonth(timenow) - lookback_period)

// RSI Calculation
rsi_value = ta.rsi(close, rsi_length)

// 30-Day Moving Average Calculation
ma_value = ta.sma(close, ma_length)

// Buy Condition: Buy when RSI is above the overbought level
long_condition = rsi_value > rsi_overbought

// Sell Condition: Sell when RSI drops below the oversold level
sell_condition = rsi_value < rsi_oversold

// Check if current time is within the lookback period
in_lookback_period = (time >= start_date)

// Execute Buy with 100% equity if within lookback period
if (long_condition and strategy.position_size == 0 and in_lookback_period)
    strategy.entry("Buy", strategy.long, qty=strategy.equity / close)

if (sell_condition and strategy.position_size > 0)
    strategy.close("Buy")

// Plot RSI on a separate chart for visualization
hline(rsi_overbought, "Overbought", color=color.red)
hline(rsi_oversold, "Oversold", color=color.green)
plot(rsi_value, title="RSI", color=color.blue)

// Plot the 30-Day Moving Average on the chart
plot(ma_value, title="30-Day MA", color=color.orange, linewidth=2)
相关推荐