资源加载中... loading...

Multi-Indicator Probability Threshold Momentum Trend Trading Strategy

Author: ChaoZhang, Date: 2025-01-06 14:15:11
Tags: RSIMACDSMA

img

Overview

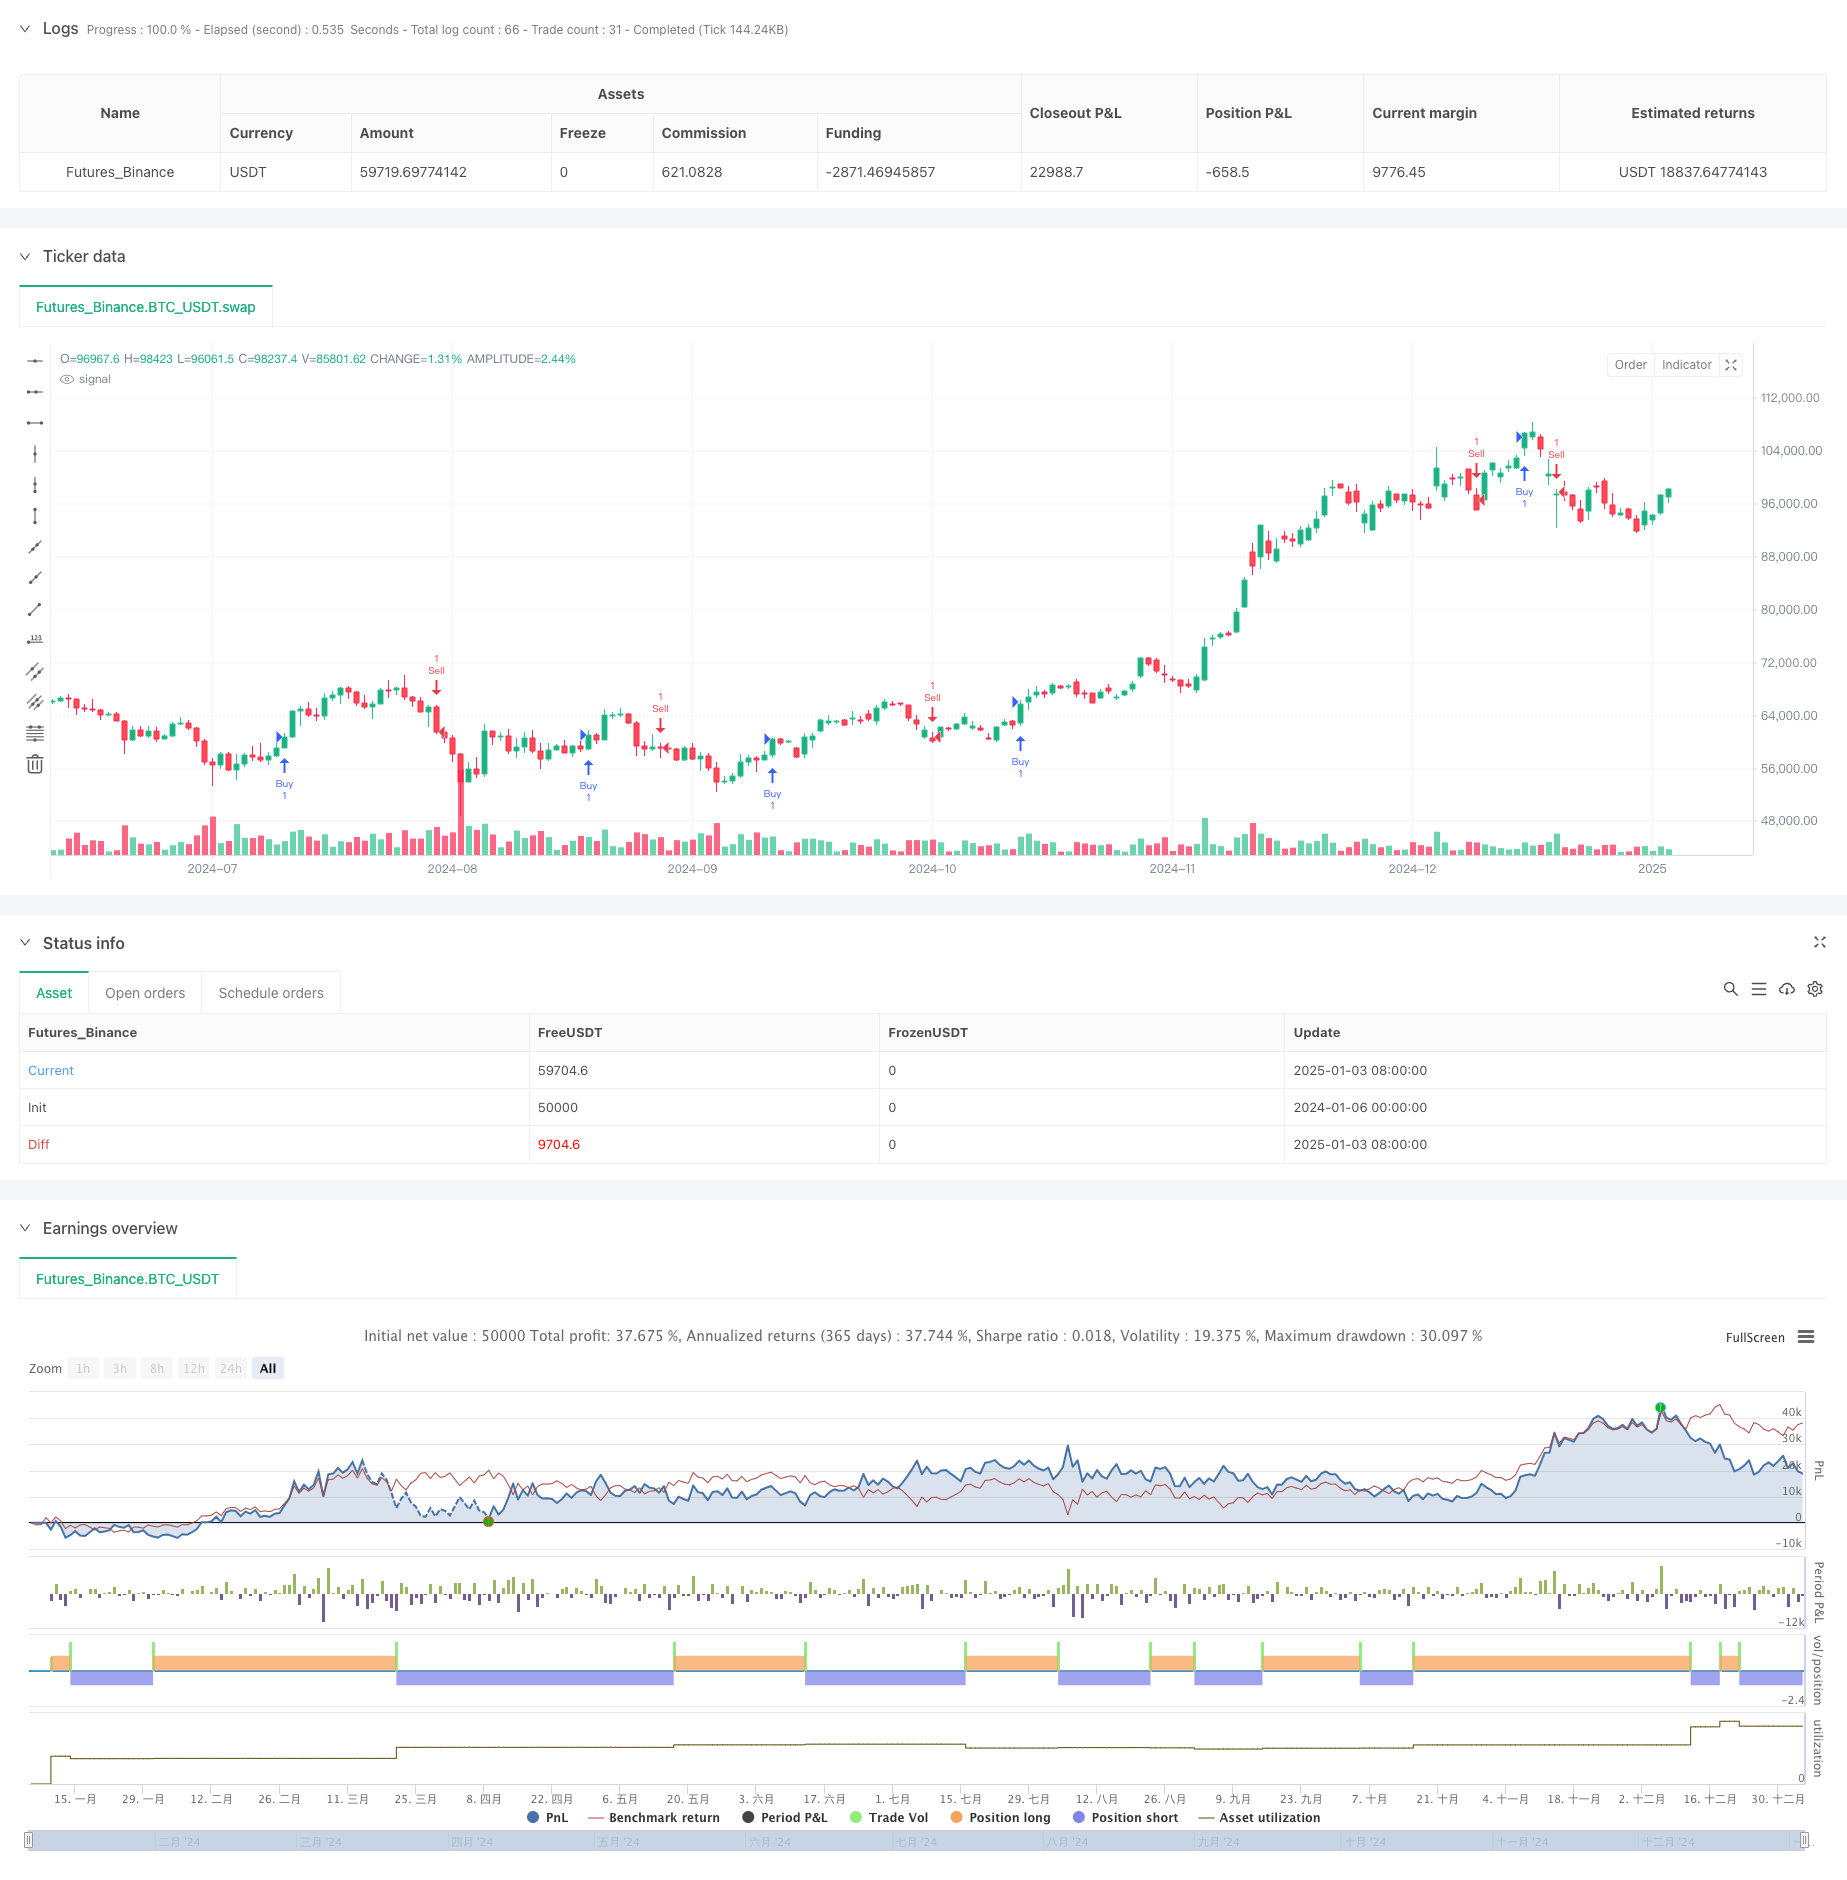
This strategy is a momentum trend trading system based on multiple technical indicators, combining the Relative Strength Index (RSI), Moving Average Convergence Divergence (MACD), and Stochastic Oscillator to identify market buy and sell signals. The strategy employs a probability threshold approach using Z-score standardization to filter trading signals and improve reliability. It is particularly suitable for daily timeframe trend following trading.

Strategy Principles

The strategy is based on three core technical indicators:

  1. RSI identifies overbought and oversold areas, with RSI<30 considered as oversold buy signal and RSI>70 as overbought sell signal
  2. MACD analyzes momentum changes through fast and slow moving average crossovers, generating buy signals when MACD line crosses above signal line and sell signals when crossing below
  3. Stochastic Oscillator determines price position within a given period, generating buy signals when %K<20 and sell signals when %K>80 The strategy innovatively introduces a probability threshold mechanism based on Z-scores, filtering false signals by calculating price standard deviations. Actual trading signals are only triggered when Z-scores exceed set thresholds.

Strategy Advantages

  1. Multi-indicator cross-validation improves signal reliability and reduces the impact of false signals
  2. Z-score standardization effectively identifies abnormal price movements and provides more robust trading opportunities
  3. Highly adjustable strategy parameters allow traders to flexibly adapt to different market conditions
  4. Modular system design enables indicators to be enabled or disabled at will, providing strong flexibility

Strategy Risks

  1. Multiple indicator combinations may lead to signal lag, potentially missing trading opportunities in rapidly moving markets
  2. Z-score calculations rely on historical data and may be less accurate during extreme market volatility
  3. Excessive parameter optimization may result in overfitting, affecting strategy performance in live trading
  4. Trend following characteristics may lead to frequent trading in ranging markets, increasing transaction costs

Strategy Optimization Directions

  1. Introduce adaptive parameter mechanisms to dynamically adjust indicator parameters based on market volatility
  2. Add market volatility filters to adjust threshold standards in high volatility environments
  3. Develop more intelligent position management systems to dynamically adjust position sizes based on signal strength
  4. Add market state classification modules to implement different trading strategies for different market conditions

Summary

This is an innovative strategy combining classical technical indicators with modern statistical methods. Through multi-indicator synergy and probability threshold filtering, it improves trading efficiency while maintaining strategy robustness. The strategy demonstrates strong adaptability and scalability, suitable for medium to long-term trend trading. While there are some latency risks, stable trading performance can be achieved through appropriate parameter optimization and risk management.


/*backtest
start: 2024-01-06 00:00:00
end: 2025-01-04 08:00:00
period: 1d
basePeriod: 1d
exchanges: [{"eid":"Futures_Binance","currency":"BTC_USDT"}]
*/

//@version=5
strategy("RSI-MACD-Stochastic Strategy", shorttitle = "RMS_V1", overlay=true)

// Inputs
use_macd = input.bool(true, title="Use MACD")
use_rsi = input.bool(true, title="Use RSI")
use_stochastic = input.bool(true, title="Use Stochastic")
threshold_buy = input.float(0.5, title="Buy Threshold (Probability)")
threshold_sell = input.float(-0.5, title="Sell Threshold (Probability)")

// Indicators
// RSI
rsi_period = input.int(14, title="RSI Period")
rsi = ta.rsi(close, rsi_period)

// Stochastic Oscillator
stoch_k = ta.stoch(close, high, low, rsi_period)
stoch_d = ta.sma(stoch_k, 3)

// MACD
[macd_line, signal_line, _] = ta.macd(close, 12, 26, 9)

// Calculate Z-score
lookback = input.int(20, title="Z-score Lookback Period")
mean_close = ta.sma(close, lookback)
stddev_close = ta.stdev(close, lookback)
zscore = (close - mean_close) / stddev_close

// Buy and Sell Conditions
long_condition = (use_rsi and rsi < 30) or (use_stochastic and stoch_k < 20) or (use_macd and macd_line > signal_line)
short_condition = (use_rsi and rsi > 70) or (use_stochastic and stoch_k > 80) or (use_macd and macd_line < signal_line)

buy_signal = long_condition and zscore > threshold_buy
sell_signal = short_condition and zscore < threshold_sell

// Trading Actions
if (buy_signal)
    strategy.entry("Buy", strategy.long)
if (sell_signal)
    strategy.entry("Sell", strategy.short)


Related

More