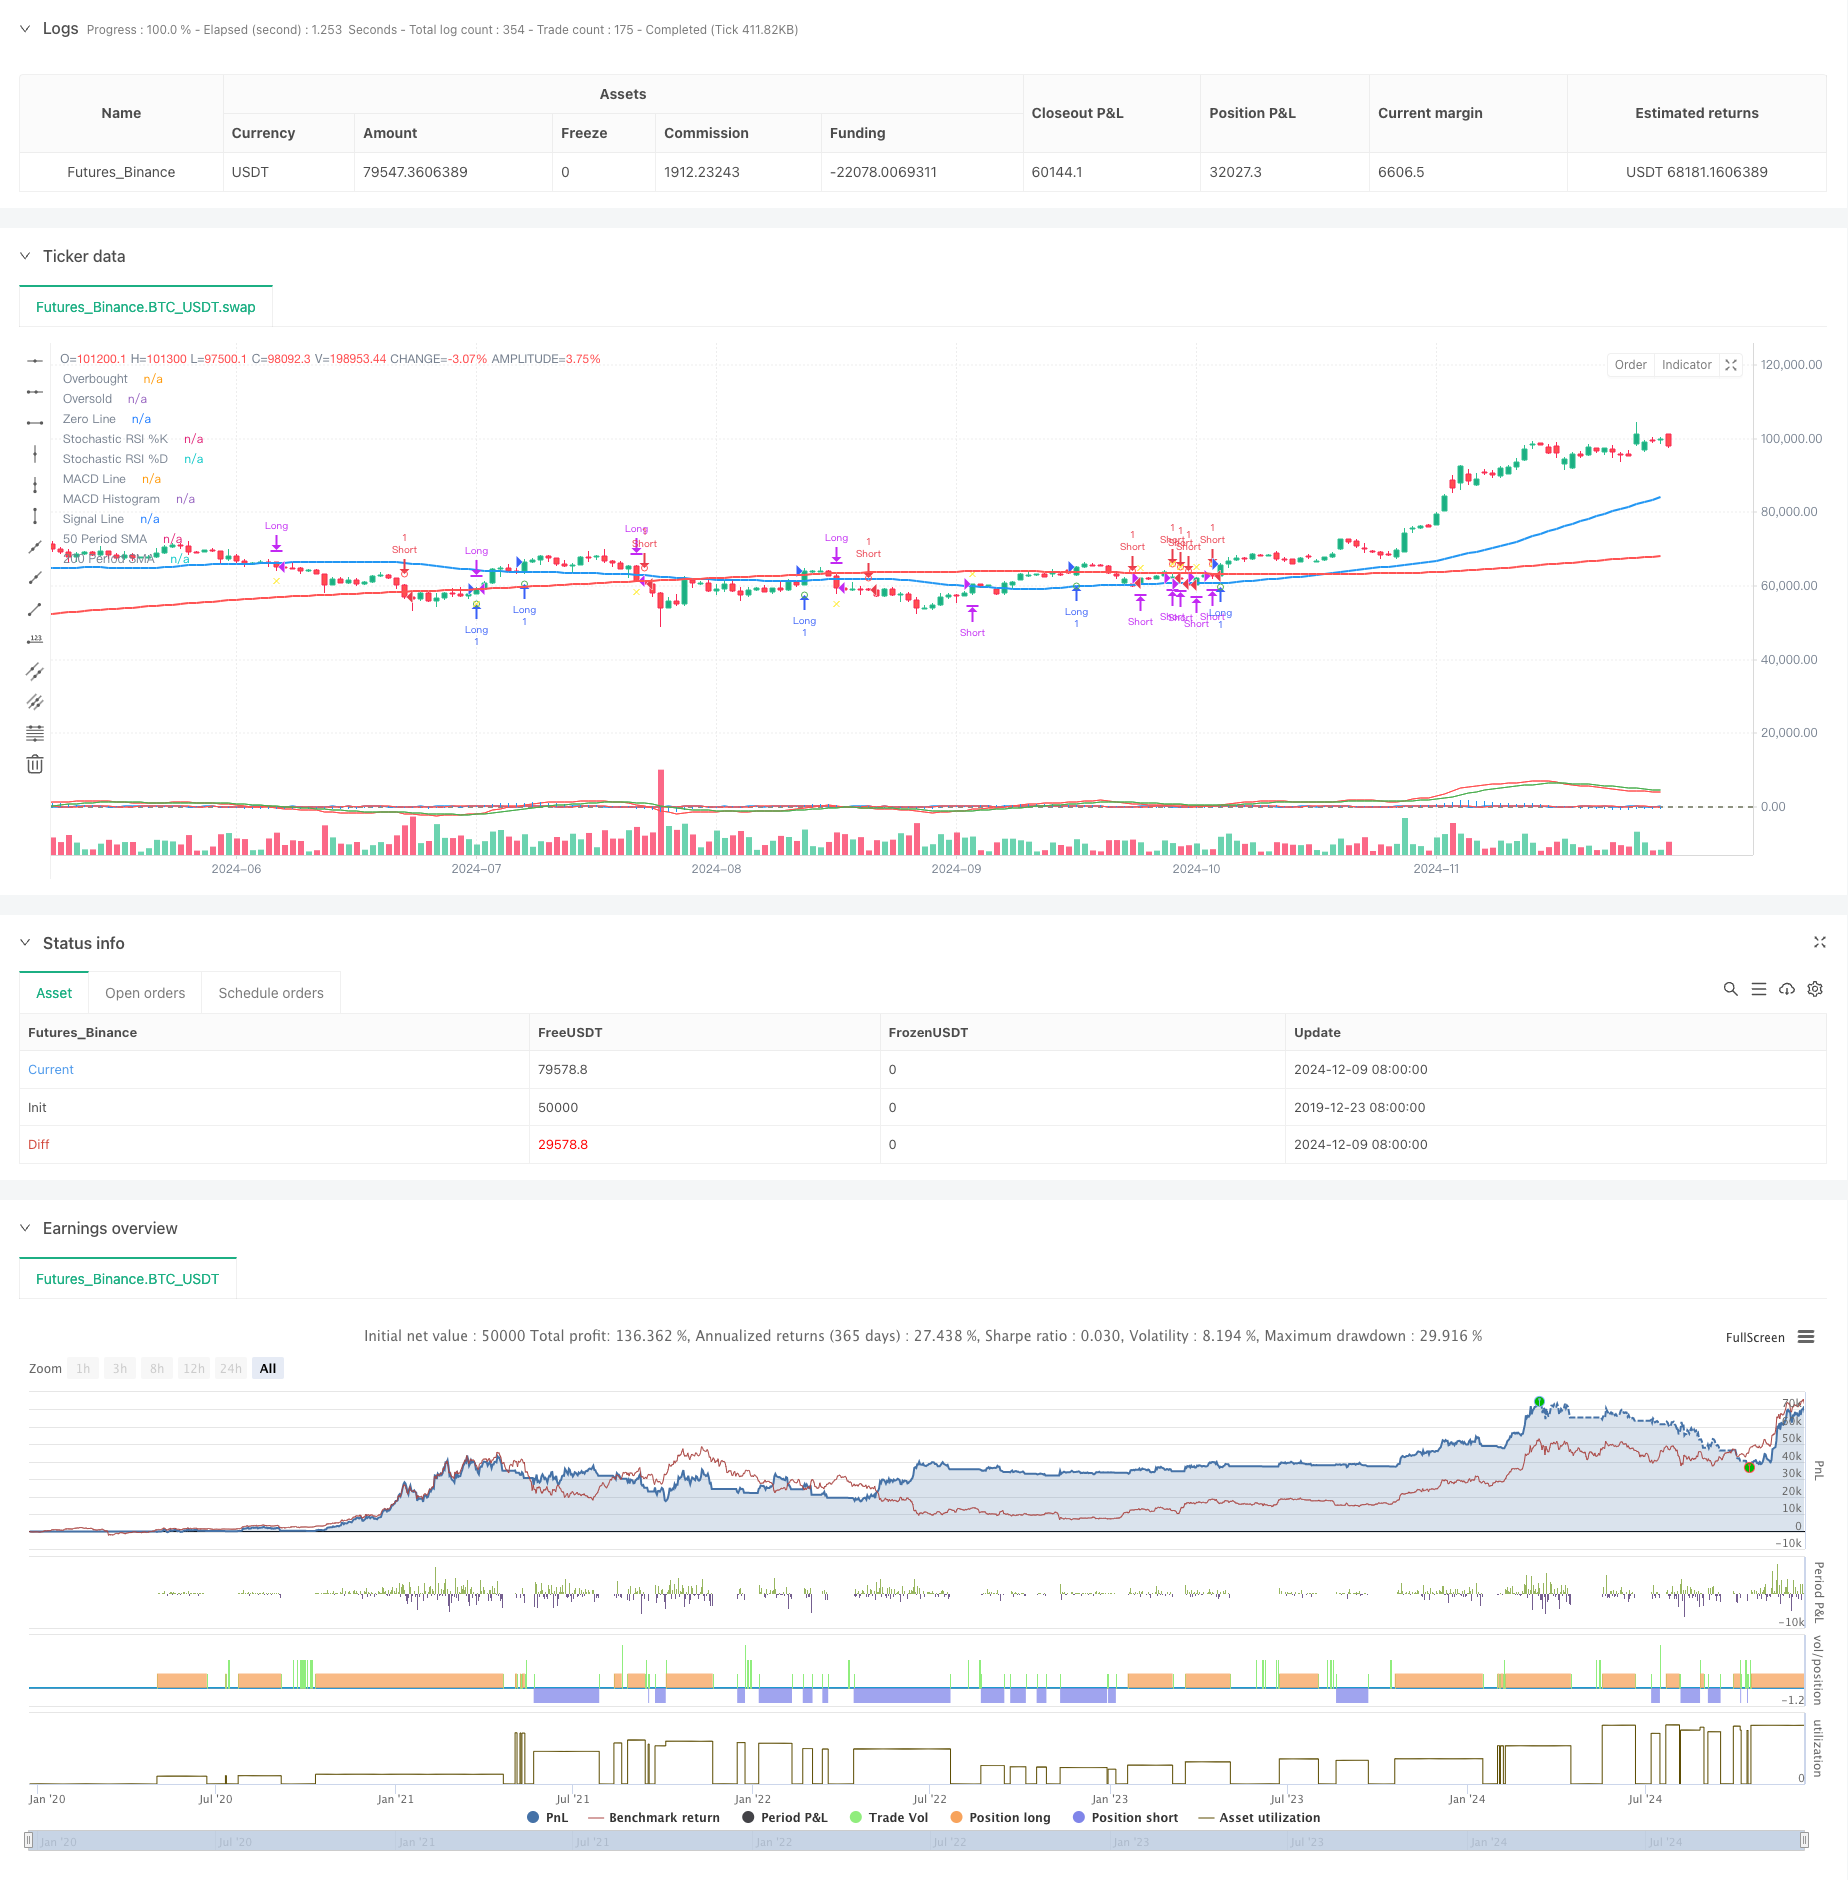
概述
该策略是一个复杂的多重指标交易系统,结合了RSI、MACD、移动平均线(SMA)等多个技术指标,通过分析价格趋势和动量来识别交易机会。策略采用200日均线判断长期趋势,50日均线作为中期趋势参考,并利用随机RSI和MACD的交叉信号来确认交易时机。
策略原理
策略的核心逻辑建立在三个主要支柱上: 1. 趋势判断:使用200日均线判断主趋势方向,价格在均线之上为上升趋势,之下为下降趋势。 2. 动量确认:利用随机RSI指标(SRSI)的%K线和%D线交叉来确认价格动量,当%K线上穿%D线时表示上升动量增强。 3. 趋势确认:使用MACD指标作为趋势确认工具,MACD线在信号线上方时确认上升趋势。
买入条件需同时满足: - 价格位于200日均线之上 - 随机RSI的%K线上穿%D线 - MACD线位于信号线之上
卖出条件需同时满足: - 价格位于200日均线之下 - 随机RSI的%K线下穿%D线 - MACD线位于信号线之下
策略优势
- 多重验证:通过多个技术指标的配合使用,降低了假信号的风险。
- 趋势跟踪:结合长期均线和中期均线,有效把握主要趋势。
- 动量识别:使用随机RSI能够更早地发现潜在的趋势转折点。
- 风险控制:使用50日均线作为止损参考,提供了明确的退出机制。
- 系统化运作:策略逻辑清晰,便于程序化实现和回测验证。
策略风险
- 滞后性风险:移动平均线本质上是滞后指标,可能导致入场和出场时机延迟。
- 震荡市风险:在横盘震荡市场中,多重指标可能产生混乱信号。
- 假突破风险:价格短期突破均线后可能快速回落,造成假信号。
- 参数敏感性:多个指标的参数设置需要针对不同市场环境进行优化。
- 信号冲突:不同指标可能产生相互矛盾的信号,增加决策难度。
策略优化方向
指标参数优化:
- 可以通过历史数据回测,寻找最优的移动平均线周期
- 优化随机RSI的参数,以适应不同市场波动率
信号过滤:
- 添加成交量确认机制
- 引入波动率指标,在高波动率期间调整交易策略
风险管理改进:
- 实现动态止损机制
- 根据市场波动率动态调整仓位大小
市场适应性:
- 添加市场环境识别机制
- 在不同市场条件下使用不同的参数设置
总结
这是一个系统化的趋势跟踪策略,通过多重技术指标的配合使用,在保证交易可靠性的同时,也提供了清晰的风险控制机制。策略的主要优势在于其多层验证机制,但同时也需要注意控制多重指标可能带来的滞后性风险。通过持续优化和改进,该策略有望在不同市场环境下保持稳定的表现。
策略源码
/*backtest
start: 2019-12-23 08:00:00
end: 2024-12-10 08:00:00
period: 1d
basePeriod: 1d
exchanges: [{"eid":"Futures_Binance","currency":"BTC_USDT"}]
*/

//@version=5
strategy("RSI and MACD by Karthik", overlay=true)

// Define periods for SMAs
sma50Period = 50
sma200Period = 200

// Calculate SMAs
sma50 = ta.sma(close, sma50Period)
sma200 = ta.sma(close, sma200Period)

// Plot SMAs on the main chart
plot(sma50, color=color.blue, title="50 Period SMA", linewidth=2)
plot(sma200, color=color.red, title="200 Period SMA", linewidth=2)

// Define and calculate parameters for Stochastic RSI
stochRSIPeriod = 14
rsi = ta.rsi(close, stochRSIPeriod)
stochRSIK = ta.stoch(rsi, rsi, stochRSIPeriod, 3)
stochRSID = ta.sma(stochRSIK, 3)

// Define and calculate parameters for MACD
macdShort = 12
macdLong = 26
macdSignal = 9
[macdLine, signalLine, macdHist] = ta.macd(close, macdShort, macdLong, macdSignal)

// Plot Stochastic RSI in a separate pane
hline(80, "Overbought", color=color.red, linewidth=1)
hline(20, "Oversold", color=color.green, linewidth=1)
plot(stochRSIK, color=color.blue, title="Stochastic RSI %K")
plot(stochRSID, color=color.red, title="Stochastic RSI %D")

// Plot MACD in a separate pane
hline(0, "Zero Line", color=color.gray, linewidth=1)
plot(macdHist, color=color.blue, title="MACD Histogram", style=plot.style_histogram)
plot(macdLine, color=color.red, title="MACD Line")
plot(signalLine, color=color.green, title="Signal Line")

// Conditions for buy and sell signals
isAbove200SMA = close > sma200
isStochRSIKAbove = stochRSIK > stochRSID
macdLineAbove = macdLine > signalLine
buySignal = isAbove200SMA and isStochRSIKAbove and macdLineAbove

isBelow200SMA = close < sma200
isStochRSIKBelow = stochRSIK < stochRSID
macdLineBelow = macdLine < signalLine
sellSignal = isBelow200SMA and isStochRSIKBelow and macdLineBelow

// Track the last signal with explicit type declaration
var string lastSignal = na

// Create series for plotting conditions
var bool plotBuySignal = na
var bool plotSellSignal = na
var bool plotExitBuySignal = na
var bool plotExitSellSignal = na

// Update plotting conditions based on signal and last signal
if buySignal and (lastSignal != "buy")
    plotBuySignal := true
    lastSignal := "buy"
else
    plotBuySignal := na

if sellSignal and (lastSignal != "sell")
    plotSellSignal := true
    lastSignal := "sell"
else
    plotSellSignal := na

// Update exit conditions based on SMA50
if lastSignal == "buy" and close < sma50
    plotExitBuySignal := true
    lastSignal := na // Clear lastSignal after exit
else
    plotExitBuySignal := na

if lastSignal == "sell" and close > sma50
    plotExitSellSignal := true
    lastSignal := na // Clear lastSignal after exit
else
    plotExitSellSignal := na

// Plot buy and sell signals on the main chart
plotshape(series=plotBuySignal, location=location.belowbar, color=color.green, style=shape.circle, size=size.small, title="Buy Signal")
plotshape(series=plotSellSignal, location=location.abovebar, color=color.red, style=shape.circle, size=size.small, title="Sell Signal")

// Plot exit signals for buy and sell
plotshape(series=plotExitBuySignal, location=location.belowbar, color=color.yellow, style=shape.xcross, size=size.small, title="Exit Buy Signal")
plotshape(series=plotExitSellSignal, location=location.abovebar, color=color.yellow, style=shape.xcross, size=size.small, title="Exit Sell Signal")


// Strategy to Backtest

long = buySignal
short = sellSignal

// Exit Conditions
exitBuy = close < sma50
exitSell = close > sma50


if (buySignal)
    strategy.entry("Long", strategy.long, 1.0)
if (sellSignal)
    strategy.entry("Short", strategy.short, 1.0)

strategy.close("Long", when=exitBuy)
strategy.close("Short", when=exitSell)
相关推荐