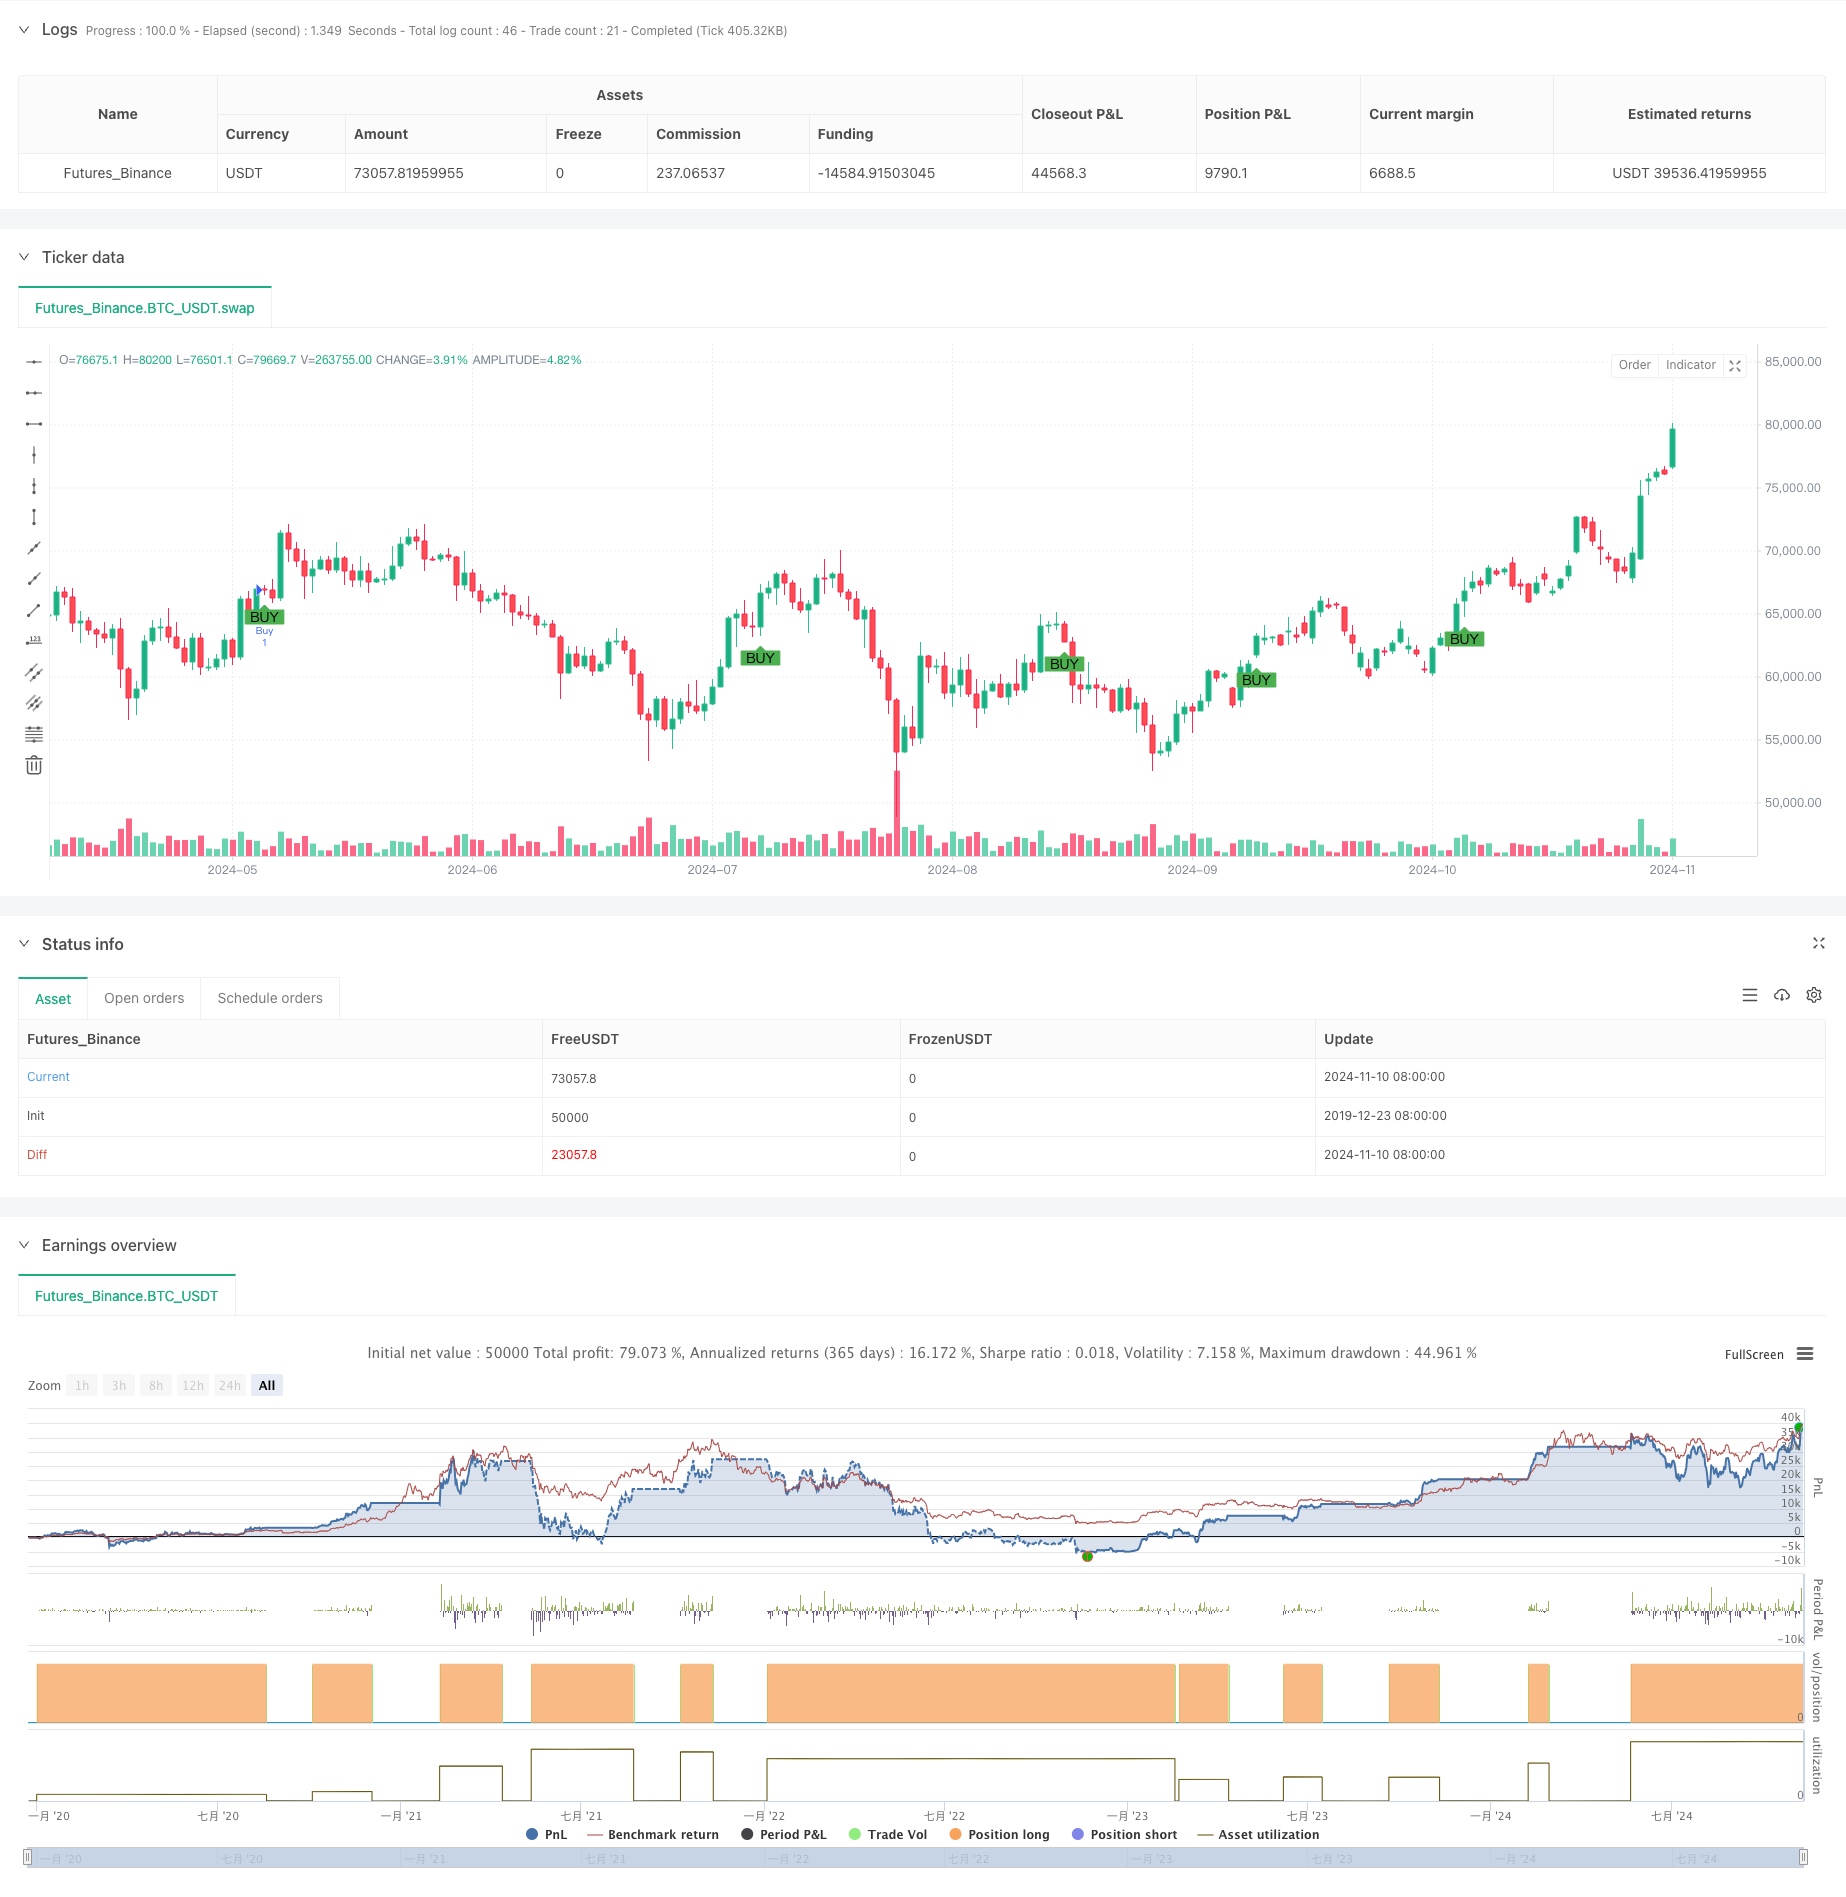
概述
该策略是一个结合了多个技术指标和市场情绪的综合交易系统。策略核心采用了短期和长期移动平均线(SMA)的交叉信号,同时结合MACD指标来确认趋势方向。此外,策略还整合了市场情绪指标RSI,以及图表形态识别系统,包括双顶/双底和头肩顶形态的识别。策略特别设计了在特定交易时段执行,以提高交易效率和成功率。
策略原理
策略运作基于以下几个核心组件: 1. 多周期移动平均线系统:使用10周期和30周期的SMA进行趋势判断 2. MACD指标:采用标准参数(12,26,9)设置,用于趋势确认 3. 市场情绪监测:使用RSI指标进行超买超卖判断 4. 图表形态识别:包含双顶/双底和头肩顶形态的自动识别系统 5. 时间过滤:专注于特定交易时段的交易机会 6. 阻力位识别:使用20周期回溯来确定主要阻力位
买入条件需满足:处于目标交易时段,短期SMA上穿长期SMA,且MACD指标显示多头信号。 卖出条件需满足:价格达到主要阻力位,且MACD指标显示空头信号。
策略优势
- 多维度信号确认:结合技术指标和图表形态,提高交易信号的可靠性
- 风险管理完善:包含基于RSI的提前退出机制
- 市场情绪整合:通过RSI指标进行市场情绪判断,避免过度追涨杀跌
- 自动化形态识别:减少主观判断带来的偏差
- 时间过滤:专注于市场活跃度较高的时段,提高交易效率
策略风险
- 参数敏感性:多个技术指标的参数设置可能影响策略表现
- 滞后性风险:移动平均线和MACD都具有一定滞后性
- 形态识别准确性:自动化识别系统可能出现误判
- 市场环境依赖:在震荡市场中可能产生频繁假信号
- 时间局限性:仅在特定时段交易可能错过其他时段的机会
策略优化方向
- 参数自适应:引入自适应参数调整机制,根据市场波动度自动调整指标参数
- 信号权重系统:建立各个指标信号的权重体系,提高决策准确性
- 止损优化:增加动态止损机制,提高风险控制能力
- 形态识别增强:引入机器学习算法提高图表形态识别的准确率
- 回测周期扩展:在不同市场周期进行回测,验证策略稳定性
总结
这是一个综合性较强的交易策略,通过多个技术指标和市场情绪的结合,建立了一个相对完整的交易系统。策略的优势在于多维度的信号确认和完善的风险管理机制,但同时也存在参数敏感性和形态识别准确性等问题。通过持续优化和改进,特别是在参数自适应和机器学习应用方面,策略有望获得更好的表现。
策略源码
/*backtest
start: 2019-12-23 08:00:00
end: 2024-11-11 00:00:00
period: 1d
basePeriod: 1d
exchanges: [{"eid":"Futures_Binance","currency":"BTC_USDT"}]
*/

//@version=5
strategy("XAUUSD SMA with MACD & Market Sentiment + Chart Patterns", overlay=true)

// Input parameters for moving averages
shortSMA_length = input.int(10, title="Short SMA Length", minval=1)
longSMA_length = input.int(30, title="Long SMA Length", minval=1)

// MACD settings
[macdLine, signalLine, _] = ta.macd(close, 12, 26, 9)

// Lookback period for identifying major resistance (swing highs)
resistance_lookback = input.int(20, title="Resistance Lookback Period", tooltip="Lookback period for identifying major resistance")

// Calculate significant resistance (local swing highs over the lookback period)
major_resistance = ta.highest(close, resistance_lookback)

// Calculate SMAs
shortSMA = ta.sma(close, shortSMA_length)
longSMA = ta.sma(close, longSMA_length)

// RSI for market sentiment
rsiLength = input.int(14, title="RSI Length", minval=1)
rsiOverbought = input.int(70, title="RSI Overbought Level", minval=50, maxval=100)
rsiOversold = input.int(30, title="RSI Oversold Level", minval=0, maxval=50)
rsi = ta.rsi(close, rsiLength)

// Time filtering: only trade during New York session (12:00 PM - 9:00 PM UTC)
isNewYorkSession = true

// Define buy condition based on SMA, MACD, and New York session
buyCondition = isNewYorkSession and ta.crossover(shortSMA, longSMA) and macdLine > signalLine

// Define sell condition: only sell if price is at or above the identified major resistance during New York session
sellCondition = isNewYorkSession and close >= major_resistance and macdLine < signalLine

// Define sentiment-based exit conditions
closeEarlyCondition = strategy.position_size < 0 and rsi > rsiOverbought  // Close losing trade early if RSI is overbought
holdWinningCondition = strategy.position_size > 0 and rsi < rsiOversold   // Hold winning trade if RSI is oversold

// ------ Chart Patterns ------ //

// Double Top/Bottom Pattern Detection
doubleTop = ta.highest(close, 50) == close[25] and ta.highest(close, 50) == close[0] // Approximate double top: two peaks
doubleBottom = ta.lowest(close, 50) == close[25] and ta.lowest(close, 50) == close[0] // Approximate double bottom: two troughs

// Head and Shoulders Pattern Detection
shoulder1 = ta.highest(close, 20)[40]
head = ta.highest(close, 20)[20]
shoulder2 = ta.highest(close, 20)[0]
isHeadAndShoulders = shoulder1 < head and shoulder2 < head and shoulder1 == shoulder2

// Pattern-based signals
patternBuyCondition = isNewYorkSession and doubleBottom and rsi < rsiOversold  // Buy at double bottom in oversold conditions
patternSellCondition = isNewYorkSession and (doubleTop or isHeadAndShoulders) and rsi > rsiOverbought // Sell at double top or head & shoulders in overbought conditions

// Execute strategy: Enter long position when buy conditions are met
if (buyCondition or patternBuyCondition)
    strategy.entry("Buy", strategy.long)

// Close the position when the sell condition is met (price at resistance or pattern sell)
if (sellCondition or patternSellCondition and not holdWinningCondition)
    strategy.close("Buy")

// Close losing trades early if sentiment is against us
if (closeEarlyCondition)
    strategy.close("Buy")

// Visual cues for buy and sell signals
plotshape(series=buyCondition or patternBuyCondition, title="Buy Signal", location=location.belowbar, color=color.green, style=shape.labelup, text="BUY")
plotshape(series=sellCondition or patternSellCondition, title="Sell Signal", location=location.abovebar, color=color.red, style=shape.labeldown, text="SELL")

// ------ Alerts for Patterns ------ //

// Add alert for pattern-based buy condition
alertcondition(patternBuyCondition, title="Pattern Buy Signal Activated", message="Double Bottom or Pattern Buy signal activated: Conditions met.")

// Add alert for pattern-based sell condition
alertcondition(patternSellCondition, title="Pattern Sell Signal Activated", message="Double Top or Head & Shoulders detected. Sell signal triggered.")

// Existing alerts for SMA/MACD-based conditions
alertcondition(buyCondition, title="Buy Signal Activated", message="Buy signal activated: Short SMA has crossed above Long SMA and MACD is bullish.")
alertcondition(sellCondition, title="Sell at Major Resistance", message="Sell triggered at major resistance level.")
alertcondition(closeEarlyCondition, title="Close Losing Trade Early", message="Sentiment is against your position, close trade.")
alertcondition(holdWinningCondition, title="Hold Winning Trade", message="RSI indicates oversold conditions, holding winning trade.")
相关推荐