机器学习启发的双均线RSI交易策略
Author: ChaoZhang, Date: 2024-06-21 15:27:18Tags: SMARSIMAML
概述
这个交易策略是一个结合了移动平均线和相对强弱指标(RSI)的量化交易系统。该策略利用快速和慢速移动平均线的交叉来识别潜在的趋势变化,同时使用RSI来确认市场的超买和超卖状态。这种方法旨在捕捉市场动量,同时通过RSI过滤来减少假信号。策略的设计灵感来自机器学习中的特征组合和信号过滤概念,尽管它本身并不使用复杂的机器学习算法。
策略原理
该策略的核心原理基于以下几个关键组件:
双均线系统:使用快速(10周期)和慢速(50周期)简单移动平均线(SMA)来识别趋势。当快线上穿慢线时,视为潜在的做多信号;当快线下穿慢线时,视为潜在的做空信号。
RSI过滤:14周期的RSI用于确认市场状态。RSI低于70时允许做多,高于30时允许做空,这有助于避免在过度延伸的市场中入场。
入场逻辑:只有当均线交叉和RSI条件同时满足时,策略才会发出交易信号。这种双重确认机制旨在提高信号的可靠性。
出场逻辑:当RSI达到极值(超过70或低于30)时,策略会平掉相应的多头或空头仓位,这有助于在市场可能反转时及时获利了结。
策略优势
趋势跟踪与动量结合:通过结合移动平均线和RSI,策略既能捕捉长期趋势,又能识别短期的超买超卖机会。
信号过滤:使用RSI作为二次确认,有助于减少假突破带来的误判,提高交易质量。
灵活性:策略参数(如均线周期、RSI阈值)可以根据不同市场和时间框架进行优化。
风险管理:通过在RSI达到极值时自动平仓,策略内置了一定的风险控制机制。
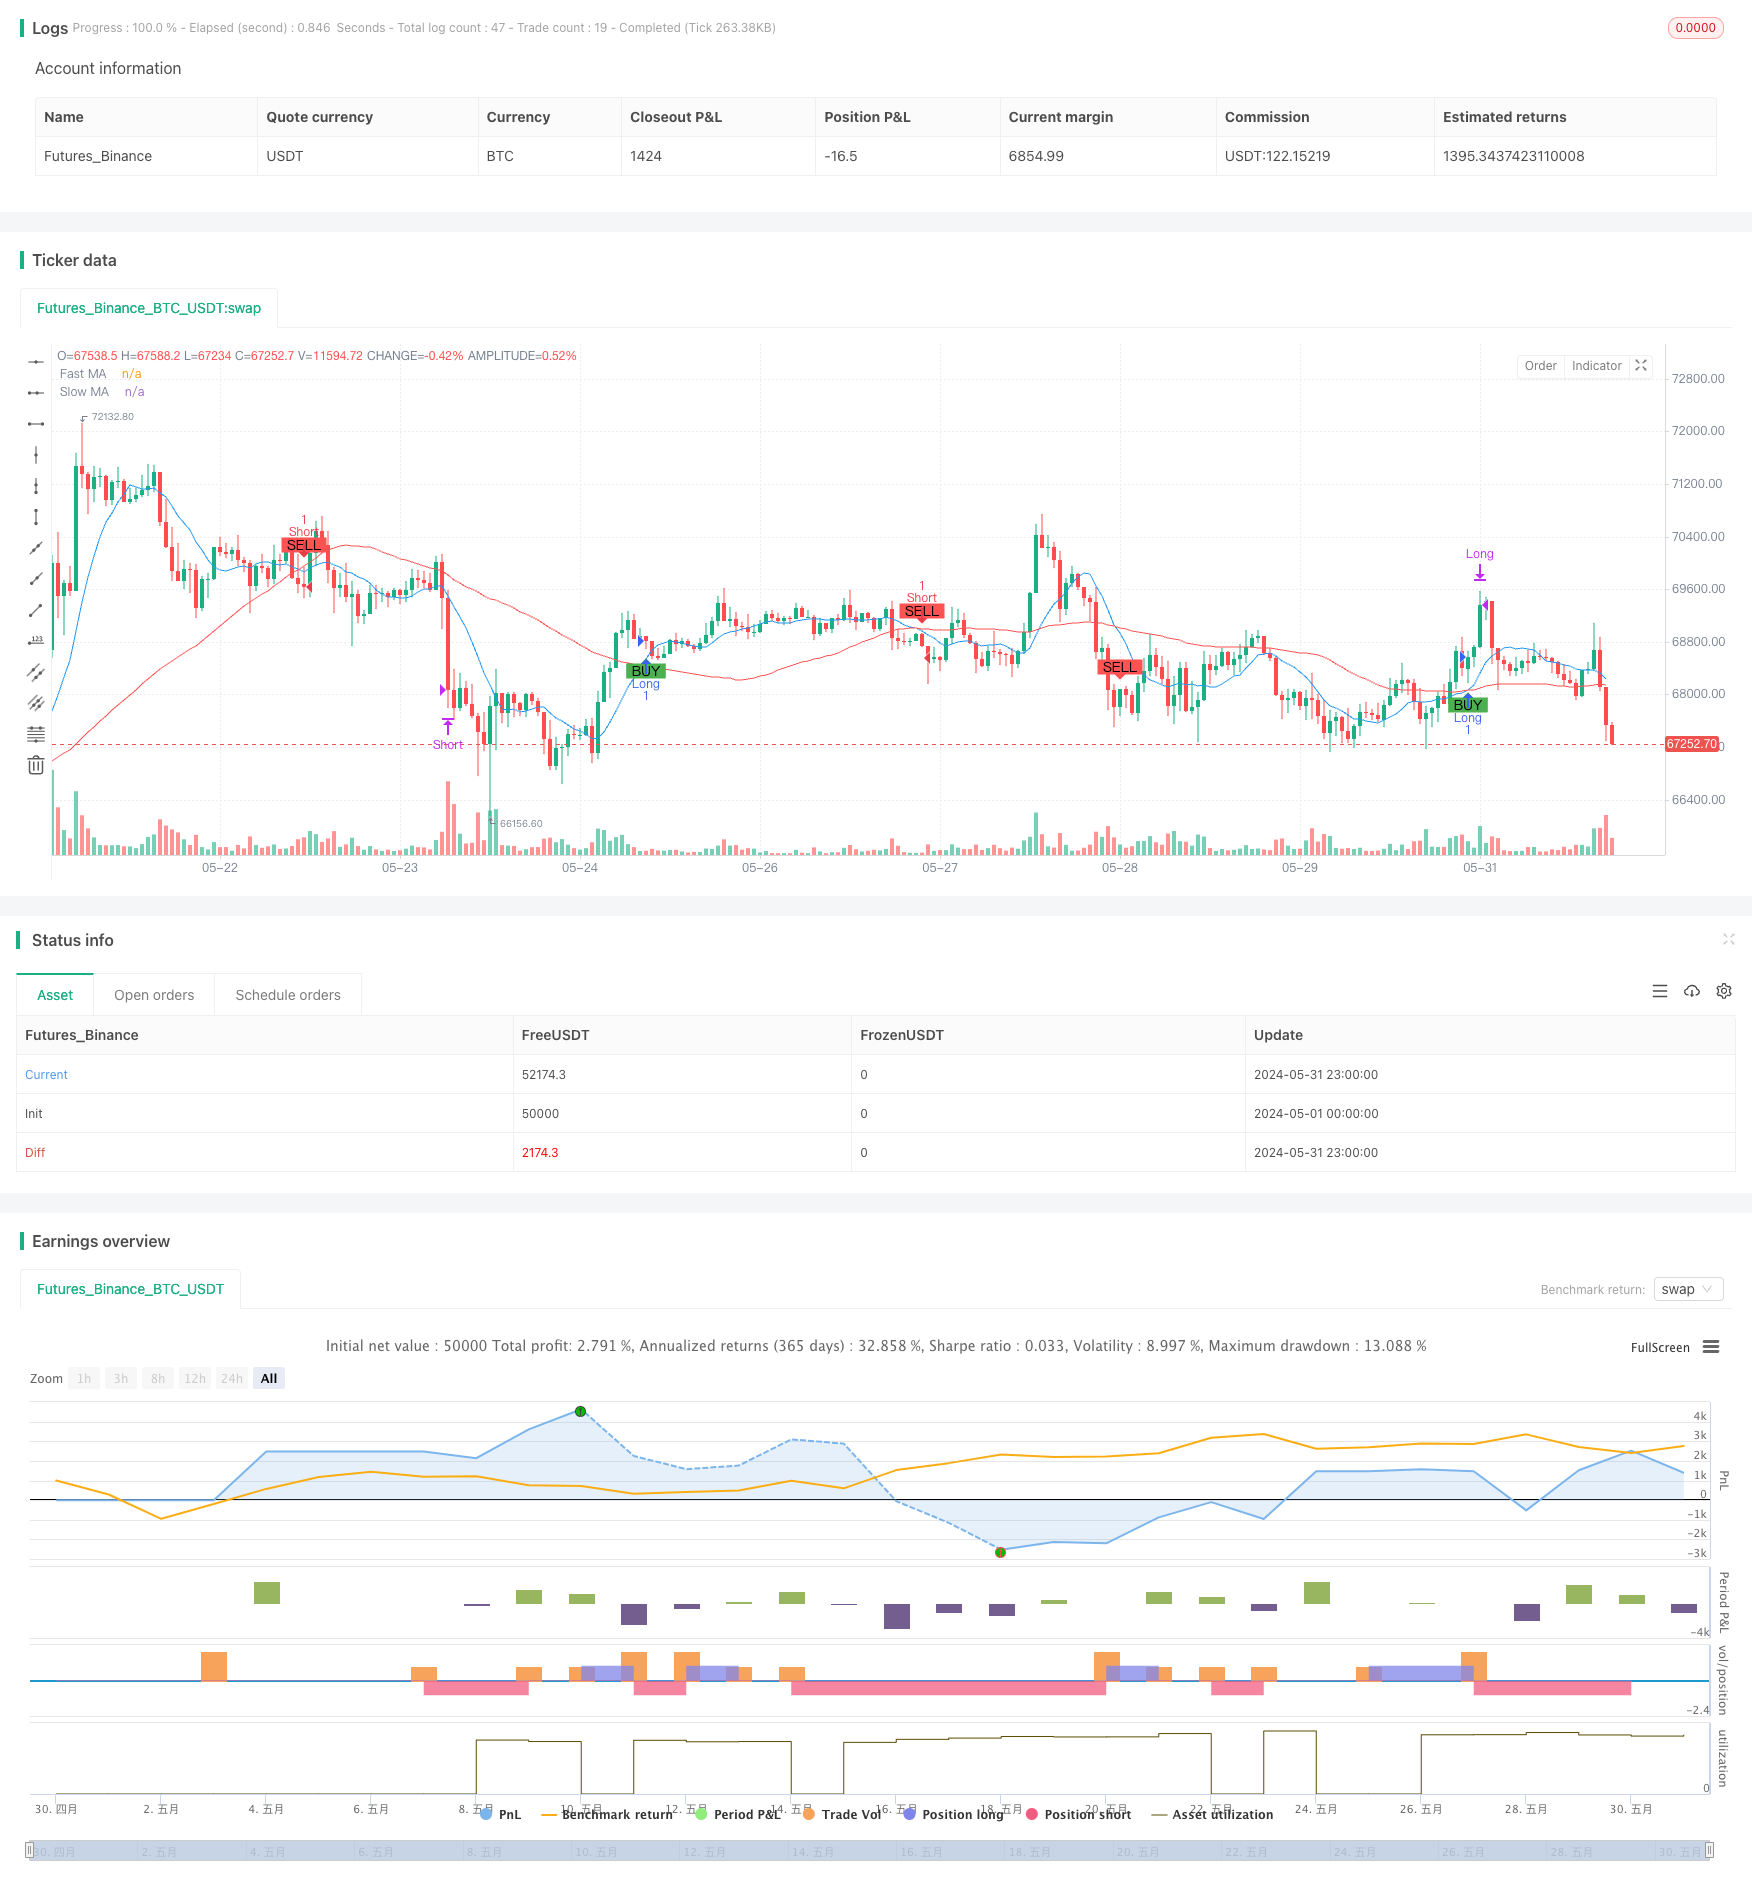
可视化:策略在图表上标记了买卖信号,便于交易者直观理解和回测分析。
策略风险
滞后性:移动平均线本质上是滞后指标,可能导致在趋势转折点附近的入场和出场不够及时。
震荡市场表现:在横盘或者震荡市场中,频繁的均线交叉可能导致过多的假信号和交易成本。
参数敏感性:策略性能可能对所选择的均线周期和RSI阈值敏感,不同参数可能在不同市场环境下表现差异较大。
缺乏止损机制:当前策略没有明确的止损规则,在极端市场行情下可能承受较大损失。
过度依赖技术指标:策略完全基于技术指标,忽视了基本面和市场情绪等其他重要因素。
策略优化方向
自适应参数:引入自适应机制,根据市场波动性动态调整均线周期和RSI阈值,以适应不同的市场环境。
加入趋势强度过滤:可以考虑加入ADX(平均方向指数)来衡量趋势强度,只在强趋势市场中交易,以减少震荡市场的假信号。
引入止损机制:设置基于ATR(平均真实波幅)的动态止损,或使用固定百分比止损,以更好地控制风险。
优化出场策略:除了RSI极值出场外,可以考虑加入移动止盈或者基于趋势反转的出场信号,以更好地锁定利润。
增加交易量过滤:在入场信号的基础上,加入交易量确认,只有在放量的情况下才执行交易,以提高信号可靠性。
多时间框架分析:结合更长期的趋势分析,只在主趋势方向上交易,以提高胜率。
机器学习优化:使用机器学习算法如遗传算法或贝叶斯优化来寻找最优参数组合,提高策略的稳定性和适应性。
总结
这个机器学习启发的双均线RSI交易策略提供了一个结合趋势跟踪和动量交易的框架。通过移动平均线识别趋势,并用RSI进行信号过滤和优化,策略旨在捕捉市场的主要移动。虽然策略设计相对简单,但它为进一步优化和扩展提供了良好的基础。交易者可以根据自己的风险偏好和市场观点,对参数进行调整,或者加入额外的过滤条件来改进策略性能。然而,在实际应用中,仍需要进行充分的回测和前向测试,并结合适当的资金管理策略,以确保在真实市场环境中的稳健表现。
/*backtest
start: 2024-05-01 00:00:00
end: 2024-05-31 23:59:59
period: 1h
basePeriod: 15m
exchanges: [{"eid":"Futures_Binance","currency":"BTC_USDT"}]
*/

//@version=5
strategy("ML Inspired Strategy for Nifty50", overlay=true)

// Define the input parameters for the strategy
length_fast = input.int(10, minval=1, title="Fast MA Length")
length_slow = input.int(50, minval=1, title="Slow MA Length")
rsi_length = input.int(14, minval=1, title="RSI Length")
rsi_overbought = input.int(70, minval=1, title="RSI Overbought Level")
rsi_oversold = input.int(30, minval=1, title="RSI Oversold Level")

// Calculate the moving averages
ma_fast = ta.sma(close, length_fast)
ma_slow = ta.sma(close, length_slow)

// Calculate the RSI
rsi = ta.rsi(close, rsi_length)

// Define the conditions for long and short entries
long_condition = ta.crossover(ma_fast, ma_slow) and rsi < rsi_overbought
short_condition = ta.crossunder(ma_fast, ma_slow) and rsi > rsi_oversold

// Plot the moving averages
plot(ma_fast, title="Fast MA", color=color.blue)
plot(ma_slow, title="Slow MA", color=color.red)

// Add strategy logic for entering and exiting trades
if (long_condition)
    strategy.entry("Long", strategy.long)
if (short_condition)
    strategy.entry("Short", strategy.short)

// Plot buy/sell signals on the chart
plotshape(series=long_condition, title="Buy Signal", location=location.belowbar, color=color.green, style=shape.labelup, text="BUY")
plotshape(series=short_condition, title="Sell Signal", location=location.abovebar, color=color.red, style=shape.labeldown, text="SELL")

// Add exit conditions
if (rsi > rsi_overbought)
    strategy.close("Long")
if (rsi < rsi_oversold)
    strategy.close("Short")
- 均线,简单移动平均线,均线斜率,追踪止损,重新进场
- 基于机器学习的移动平均线交叉量化交易策略
- 双均线-RSI多重信号趋势交易策略
- 动态支撑阻力突破均线交叉策略
- 多重均线动量趋势跟踪策略
- 双均线RSI趋势动量策略
- 多周期均线与RSI动量交叉趋势跟踪策略
- 多重技术指标交叉趋势跟踪策略:RSI与随机RSI协同交易系统
- 多周期均线与RSI动量交叉策略
- 均线修正型RSI三重验证机会策略
- 多指标组合趋势跟踪策略
- 多周期斐波那契RSI黄金交叉趋势跟踪量化交易策略
- 动态止损止盈的双均线趋势跟踪与蜡烛图反应策略
- 基于机器学习的移动平均线交叉量化交易策略
- RSI与随机指标融合交叉策略
- 多重指数移动平均线交叉趋势跟踪策略
- 动态波动趋势捕捉策略
- VAWSI和趋势持续性反转策略结合动态长度计算的多指标综合分析系统
- 动态通道百分比包络策略
- SuperTrend策略优化:动态波动率跟踪与交易信号增强系统
- 多指标组合的高频交易策略:指数均线与动量指标相结合的短线交易系统
- 三标准差动量反转交易策略
- 多周期指数移动平均交叉策略与期权交易建议系统
- Supertrend双重触发的多步移动止盈策略
- 自定义信号振荡器策略 (CSO)
- 多层级RSI回归交易策略与动态波动率调整
- 布林带动量交叉策略
- 超级三指标RSI-MACD-BB动量反转策略
- CCI动量背离趋势交易策略
- Hilo Activator MACD 动态止盈止损交易策略