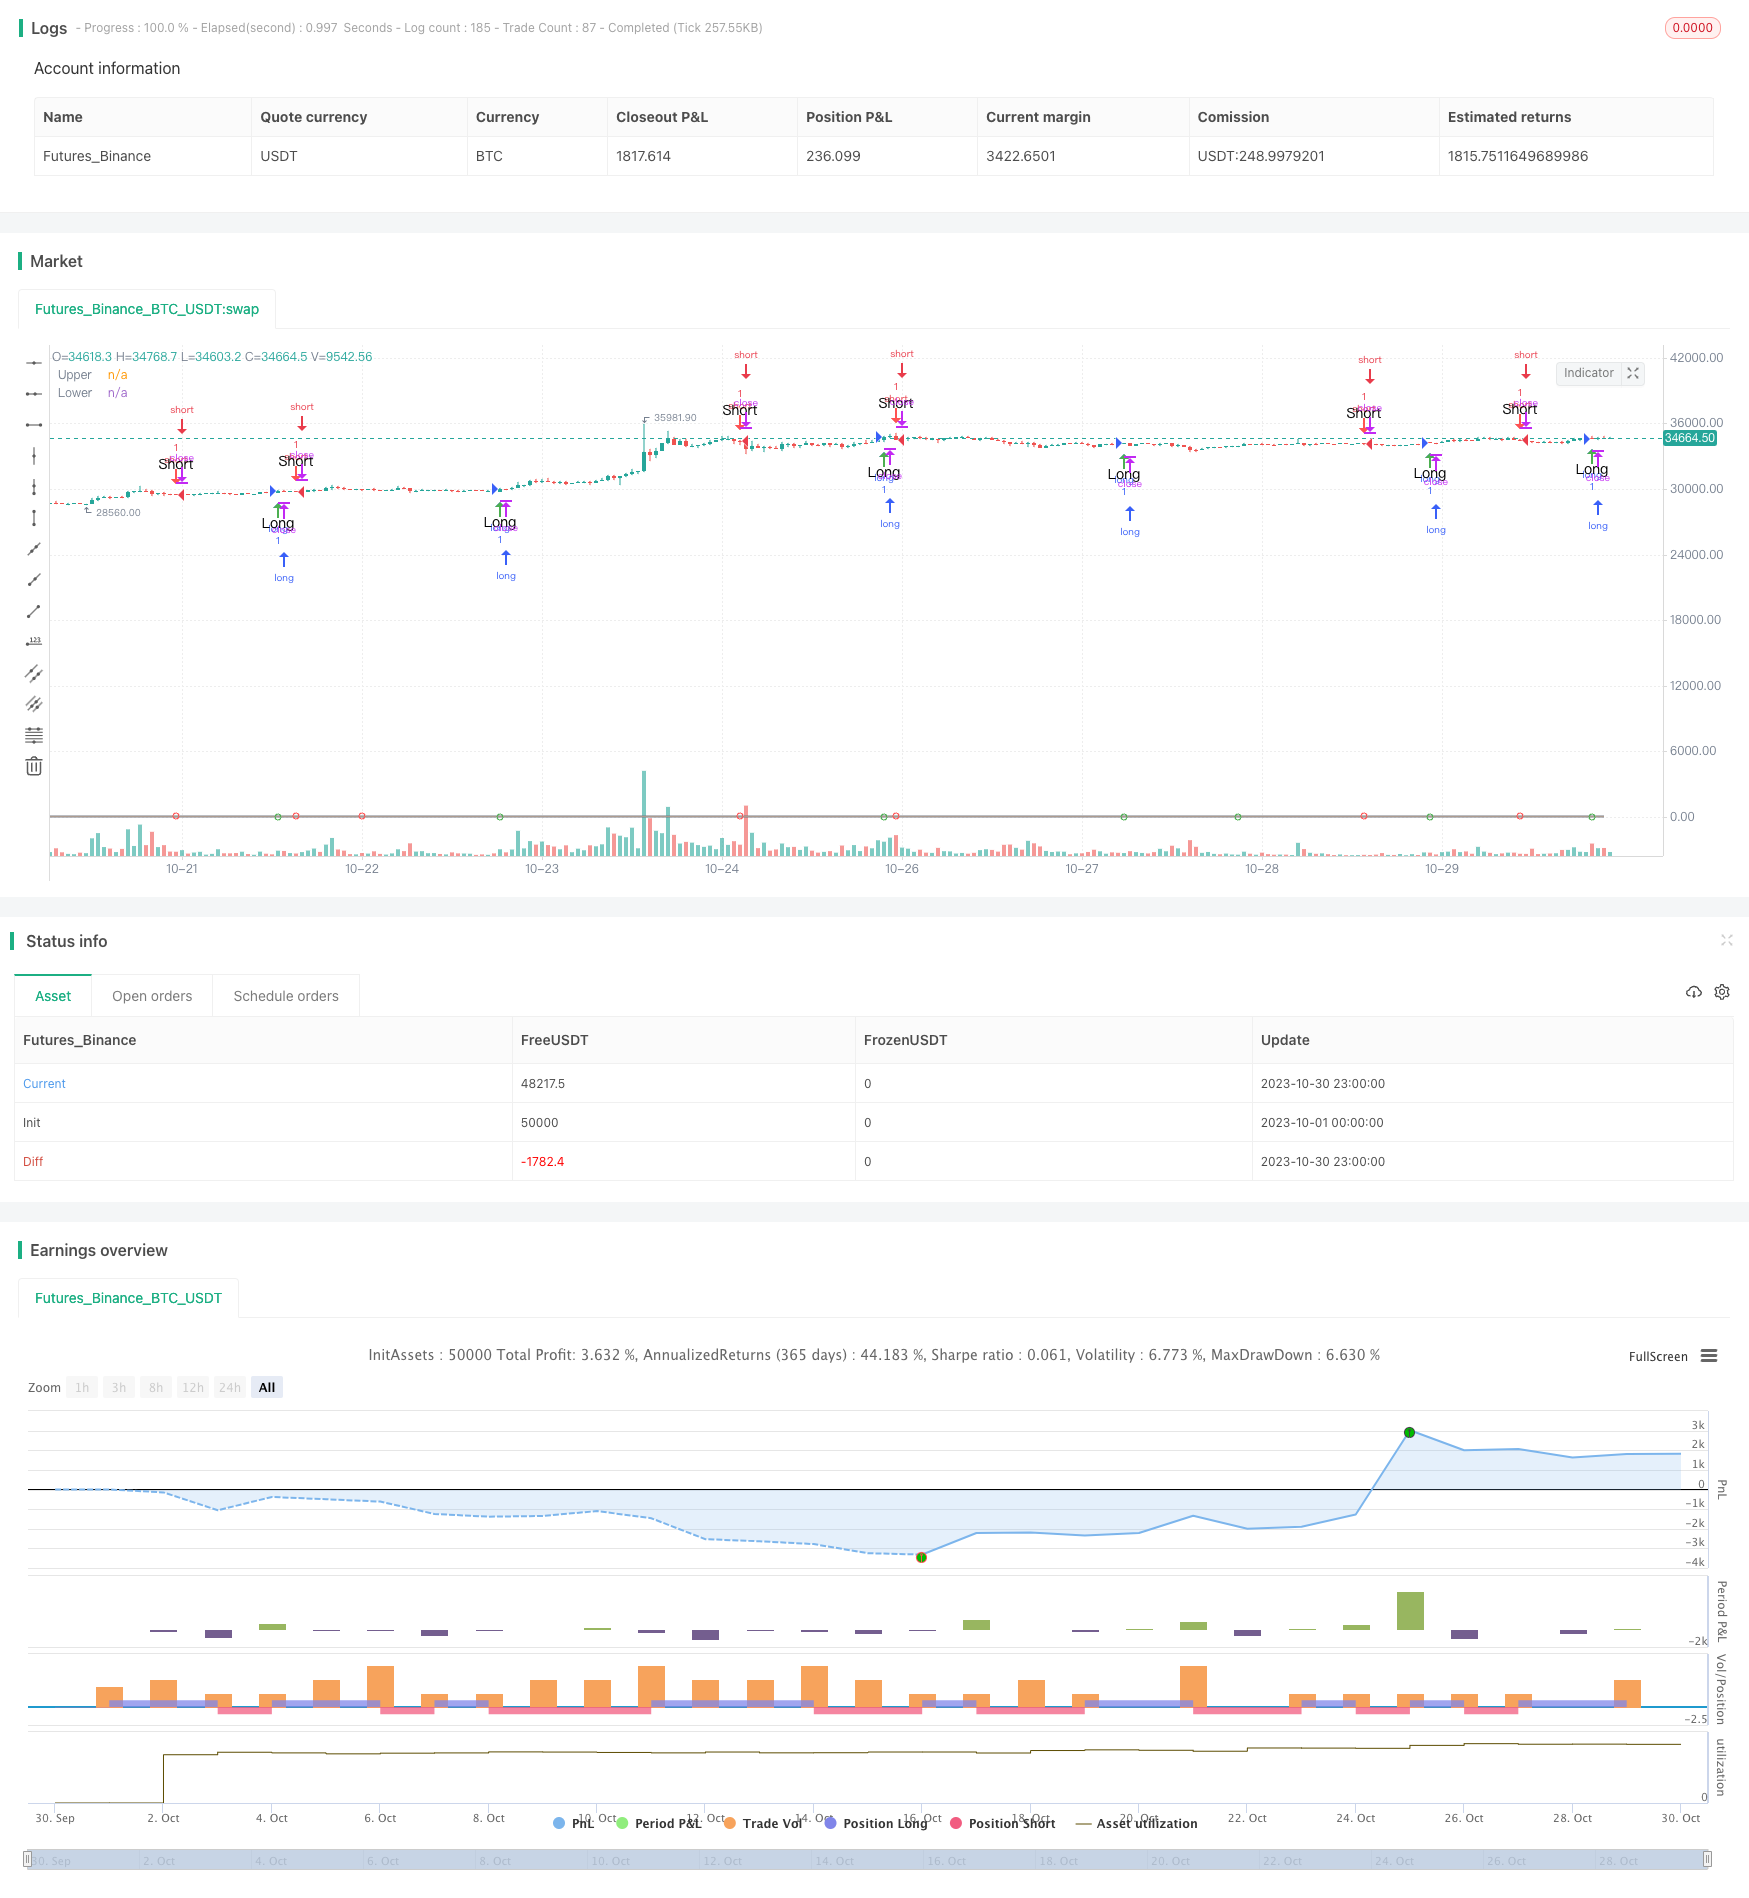
Schaff-Trend-Zyklusdynamik nach Strategie
Schriftsteller:ChaoZhang, Datum: 2023-11-01 16:08:35Tags:

Übersicht
Diese Strategie basiert auf dem Schaff Trend Cycle Indikator, kombiniert mit den überkauften und überverkauften Prinzipien des Stoch RSI, um Trends mithilfe von Momentum-Metriken zu bestimmen und zu verfolgen.
Strategie Logik
-
- Berechnen Sie den MACD, bei dem die Standard-Fast Length 23 und die Slow Length 50 ist. Der MACD spiegelt die Differenz zwischen kurz- und langfristigen gleitenden Durchschnitten wider, um die Kursdynamik zu beurteilen.
-
- Der Stoch-RSI wird auf den MACD angewendet, um den Wert K zu ermitteln, wobei die Standardzykluslänge 10 beträgt und die Überkauf-/Überverkaufswerte der MACD-Momentumsmetrik widerspiegelt.
-
- Nehmen Sie den gewichteten gleitenden Durchschnitt von K in Form D, wobei die Standardlänge des ersten %D 3 beträgt, um Lärm aus K zu entfernen.
-
- Der Stoch-RSI wird erneut auf D angewendet, um den anfänglichen STC-Wert zu bilden, wobei die Standardlänge von 2 %D 3 beträgt, um präzise Überkauf-/Überverkaufssignale zu erzeugen.
-
- Nehmen Sie den gewichteten gleitenden Durchschnitt des anfänglichen STC, um den endgültigen STC-Wert zu erhalten, der zwischen 0 und 100 liegt.
-
- Gehen Sie lang, wenn STC über 25 nach oben und kurz, wenn STC nach unten über 75 geht.
Vorteile
-
- Das STC
-Design, das den Stoch RSI kombiniert, zeigt deutlich überkaufte/überverkaufte Regionen an und bildet starke Trendsignale.
- Das STC
-
- Der doppelte Stoch-RSI-Filter entfernt effektiv falsche Ausbrüche.
-
- Der standardisierte STC
-Bereich 0-100 ermöglicht einfache mechanisierte Handelssignale.
- Der standardisierte STC
-
- Der Backtest implementiert visuelle Ausbruchmarkierungen und Text-Popup-Warnungen für eine klare und intuitive Signalfassung.
-
- Optimierte Standardparameter vermeiden überempfindliche Signale und unnötige Trades.
Risiken
-
- STC ist parameterempfindlich. Verschiedene Münzen und Zeitrahmen erfordern eine Parameteranpassung an die Marktmerkmale.
-
- Ausbruchsstrategien sind anfällig für Fallen und erfordern Stopps, um das Risiko zu kontrollieren.
-
- Falsche Ausbrüche mit geringer Liquidität können schlechte Signale erzeugen und einen Volumenfilter benötigen.
-
- STC allein birgt das Risiko einer Umkehrung, eine Bestätigung unter Verwendung anderer Faktoren ist erforderlich.
-
- Die wichtigsten Unterstützungs-/Widerstandsniveaus sollten beobachtet werden, um schlechte Signale zu vermeiden.
Möglichkeiten zur Verbesserung
-
- Optimierung der MACD-Parameter für verschiedene Zeiträume und Münzen.
-
- Stoch-RSI-Werte K und D zu verfeinern, um die STC-Kurve zu glätten.
-
- Zusatz eines Volumenfilters, um falsche Ausbrüche mit geringer Liquidität zu vermeiden.
-
- Hinzufügen zusätzlicher Indikatoren zur Bestätigung von Signalen, z. B. Bollinger-Bänder.
-
- Hinzufügen von Stoppmechanismen wie Bewegung/ATR-Stopps.
-
- Anpassung des Eingangs, z. B. Eingabe bei Rückzug nach Ausbruch zur Trendbestätigung.
Schlussfolgerung
Die Schaff Trend Cycle Strategie identifiziert Überkauf/Überverkauf über Momentum-Metriken, um kurzfristige Preistrendveränderungen zu bestimmen. Obwohl sie einfach und anpassbar ist, birgt sie Gefahren. Bestätigung und Stopps unterstützen die Optimierung für starke Trends.
/*backtest
start: 2023-10-01 00:00:00
end: 2023-10-31 00:00:00
period: 1h
basePeriod: 15m
exchanges: [{"eid":"Futures_Binance","currency":"BTC_USDT"}]
*/

//@version=3
// Copyright (c) 2018-present, Alex Orekhov (everget)
// Schaff Trend Cycle script may be freely distributed under the MIT license.
strategy("Schaff Trend Cycle", shorttitle="STC Backtest", overlay=true)

fastLength = input(title="MACD Fast Length",  defval=23)
slowLength = input(title="MACD Slow Length",  defval=50)
cycleLength = input(title="Cycle Length",  defval=10)
d1Length = input(title="1st %D Length",  defval=3)
d2Length = input(title="2nd %D Length",  defval=3)
src = input(title="Source",  defval=close)
highlightBreakouts = input(title="Highlight Breakouts ?", type=bool, defval=true)

macd = ema(src, fastLength) - ema(src, slowLength)

k = nz(fixnan(stoch(macd, macd, macd, cycleLength)))

d = ema(k, d1Length)

kd = nz(fixnan(stoch(d, d, d, cycleLength)))

stc = ema(kd, d2Length)
stc := 	stc > 100 ? 100 : stc < 0 ? 0 : stc

//stcColor = not highlightBreakouts ? (stc > stc[1] ? green : red) : #ff3013
//stcPlot = plot(stc, title="STC", color=stcColor, transp=0)

upper = input(75, defval=75)
lower = input(25, defval=25)

transparent = color(white, 100)

upperLevel = plot(upper, title="Upper", color=gray)
// hline(50, title="Middle", linestyle=dotted)
lowerLevel = plot(lower, title="Lower", color=gray)

fill(upperLevel, lowerLevel, color=#f9cb9c, transp=90)

upperFillColor = stc > upper and highlightBreakouts ? green : transparent
lowerFillColor = stc < lower and highlightBreakouts ? red : transparent

//fill(upperLevel, stcPlot, color=upperFillColor, transp=80)
//fill(lowerLevel, stcPlot, color=lowerFillColor, transp=80)

long =  crossover(stc, lower) ? lower : na
short = crossunder(stc, upper) ? upper : na

long_filt = long and not short
short_filt = short and not long

prev = 0
prev := long_filt ? 1 : short_filt ? -1 : prev[1]

long_final = long_filt and prev[1] == -1
short_final = short_filt and prev[1] == 1

strategy.entry("long", strategy.long, when = long )
strategy.entry("short", strategy.short, when = short)

plotshape(crossover(stc, lower) ? lower : na, title="Crossover", location=location.absolute, style=shape.circle, size=size.tiny, color=green, transp=0)
plotshape(crossunder(stc, upper) ? upper : na, title="Crossunder", location=location.absolute, style=shape.circle, size=size.tiny, color=red, transp=0)

alertcondition(long_final, "Long", message="Long")
alertcondition(short_final,"Short", message="Short")

plotshape(long_final, style=shape.arrowup, text="Long", color=green, location=location.belowbar)
plotshape(short_final, style=shape.arrowdown, text="Short", color=red, location=location.abovebar)
Mehr
- Klassische Strategie zur doppelten Trendverfolgung
- Handelsstrategie mit doppelter Umkehrung
- Bollinger-Bänder-Oszillations-Breakthrough-Strategie
- Fibonacci gleitende Durchschnitte Inputstrategie
- MACD-Dissipation und Multi-Time Frame Moving Average-Strategie
- Vermögensschöpfungsstrategie
- Dollarkostendurchschnittliche Anlagestrategie
- Strategie für die Mittelverlagerung der CCI
- Handelsstrategie zur Umkehrung des RSI-Mittelwertes
- Low Scanner Smart Tracking-Methode
- Strategie zur Erfassung der Dynamik auf Basis des gleitenden Durchschnitts
- Doppel gleitender Durchschnitt Bollinger Bands Trend nach Strategie
- Trend nach Strategie mit dynamischen Stopps
- Doppelkanal-ATR-Trend nach Strategie
- Bollinger Bands Trendumkehrstrategie
- Korrelationsbasierte bullische/bärenische Krypto-Handelsstrategie auf Basis des Wall Street CCI-Index
- SMI Ergodische Oszillator-Momentum-Handelsstrategie
- Trend nach der auf den Donchian-Kanälen basierenden Strategie
- Strategie für die Volatilität mit zwei Indikatoren Rose Cross Star
- Adaptive ATR-Trend-Breakout-Strategie