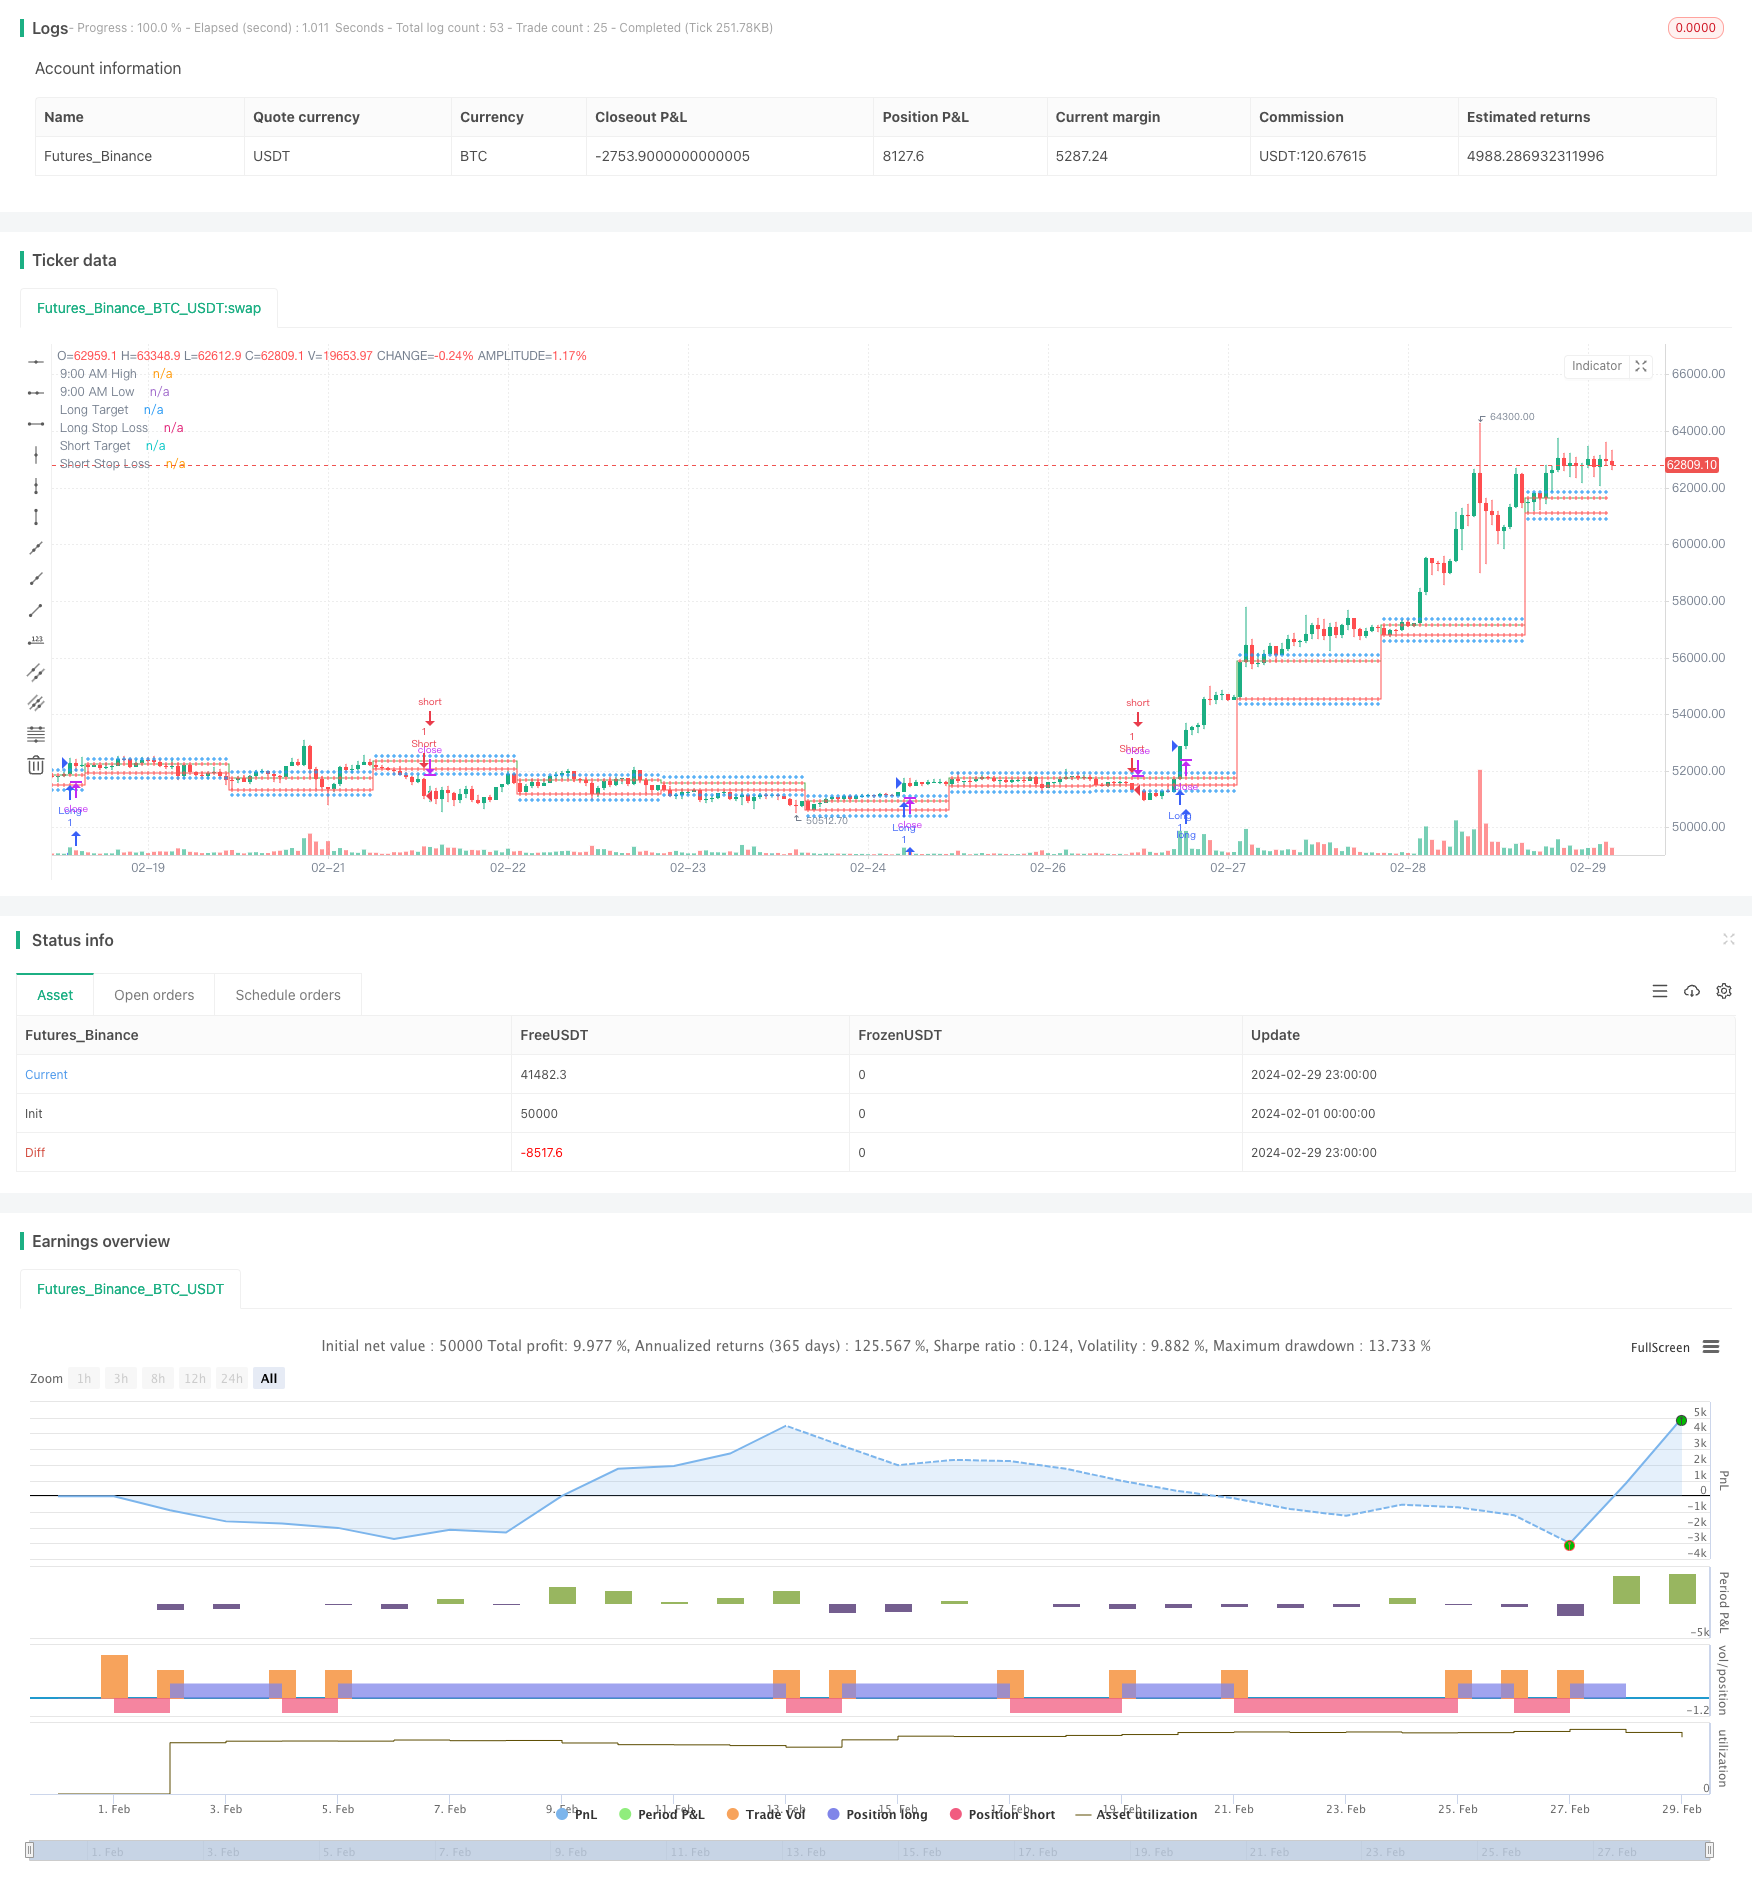
Hoch/Niedrig automatische Prognose und Handelsstrategie
Schriftsteller:ChaoZhang, Datum: 2024-03-15 17:22:36Tags:

Übersicht
Diese Strategie identifiziert die Höchst- und Tiefpunkte um 9:15 Uhr in der Morgensitzung, berechnet automatisch die Zielpreise und Stop-Loss-Preise für Long- und Short-Positionen und eröffnet automatisch Positionen, wenn die Bedingungen erfüllt sind.
Strategieprinzipien
- Bestimmen Sie den Höchst- und Tiefpunkt-Formationsintervall von 9:00 bis 9:15.
- Der höchste Preis und der niedrigste Preis werden um 9:15 Uhr als SessionHigh bzw. SessionLow aufgezeichnet.
- Berechnen Sie den langen Zielpreis (SessionHigh+200), den kurzen Zielpreis (SessionLow-200) und die entsprechenden Stop-Loss-Preise.
- Erhalten Sie den aktuellen Schlusskurs und den RSI-Indikator.
- Long-Eintrittsbedingung: Der Schlusskurs übersteigt die SessionHigh und der RSI übersteigt den Überkauf.
- Kurze Einstiegsbedingung: Schlusskurs unterhalb der SessionLow und RSI unter dem Überverkauf.
- Die entsprechenden Preisniveaus erfassen und automatisch lange oder kurze Positionen eröffnen, je nachdem, wie die Einstiegsbedingungen aussehen.
Analyse der Vorteile
- Einfach und einfach zu bedienen: Die Strategie basiert auf einem klaren 9:15-Hoch-/Tiefpunkt und einem klaren RSI-Indikator, mit einer klaren Logik, die leicht zu verstehen und umzusetzen ist.
- Hohe Automatisierungsgrad: Die Strategie umfasst integrierte Berechnungen für Zielpreise und Stop-Loss-Preise sowie Einstiegsbedingungen, die eine automatische Handelsausführung ermöglichen.
- Zeitnahe Stop-Loss: Die Stop-Loss-Preise werden auf der Grundlage der Höchst-/Tiefpunkte von 9:15 festgelegt, wodurch ein klares Stop-Loss-Niveau nach Eröffnung einer Position zur Verfügung steht und das Risiko effektiv kontrolliert wird.
- Trendverfolgung: Durch die Verwendung des RSI-Indikators, um überkaufte und überverkaufte Bedingungen zu beurteilen, tritt die Strategie zu Beginn der Trendbildung ein und hilft, dem Trend zu folgen.
Risikoanalyse
- Parameteroptimierungsrisiko: Strategieparameter wie RSI-Länge und Überkauf-/Überverkaufsschwellen müssen anhand der Merkmale des Marktes optimiert werden, und verschiedene Parameter können zu unterschiedlichen Ergebnissen führen.
- Risiko mit einem einzigen Indikator: Die Strategie stützt sich hauptsächlich auf den RSI-Indikator, der unter bestimmten Marktbedingungen unwirksam werden kann.
- Das Intraday-Volatilitätsrisiko: Kursschwankungen nach 9:15 Uhr können zu Stop-Losses führen und Trendbewegungen verpassen.
- Mangelnde Positionsverwaltung: Die Strategie hat keine Kontrolle über die Positionsgröße und das Geldmanagement, und zu häufige Positionseröffnungen können zusätzliche Risiken mit sich bringen.
Optimierungsrichtlinien
- Dynamischer Stop-Loss: Dynamische Anpassung der Stop-Loss-Level anhand von Preisvolatilität oder Indikatoren wie dem Average True Range (ATR) zur Verfolgung von Kursänderungen.
- Kombination mit anderen Indikatoren: Einführung anderer Indikatoren wie MACD und gleitender Durchschnittssysteme zur Bestätigung von Trendurteilen und Verbesserung der Eingangsgenauigkeit.
- Optimierung der Einstiegsbedingungen: Anpassungsfähige Anpassung der RSI-Überkauf-/Überverkaufsschwellenwerte, um Einschränkungen festgelegter Schwellenwerte zu vermeiden.
- Einführung von Positionsmanagement: Kontrolle der Positionsgröße auf der Grundlage von Marktvolatilitätsbedingungen, z. B. mit Hilfe von Risikomodellen.
Zusammenfassung
Diese Strategie basiert auf den 9:15-Hoch-/Tiefpunkten, verwendet den RSI-Indikator für das Trendbeurteilen, berechnet automatisch Zielpreise und Stop-Loss-Preise und eröffnet automatisch Long- oder Short-Positionen basierend auf den Einstiegsbedingungen. Die Strategielogik ist einfach und klar, mit einem hohen Grad an Automatisierung, was eine schnelle Erfassung von Trendbewegungen ermöglicht. Die Strategie birgt jedoch auch Risiken in Bezug auf Parameteroptimierung, Abhängigkeit von einem einzigen Indikator, Intraday-Volatilität und Mangel an Positionsmanagement. In Zukunft kann die Strategie in Aspekten wie dynamischer Stop-Loss, Kombination mit anderen Indikatoren, Optimierung der Einstiegsbedingungen und Einführung von Positionsmanagement optimiert und verbessert werden, um eine robustere Handelsleistung zu erzielen.
/*backtest
start: 2024-02-01 00:00:00
end: 2024-02-29 23:59:59
period: 1h
basePeriod: 15m
exchanges: [{"eid":"Futures_Binance","currency":"BTC_USDT"}]
*/

//@version=5
strategy("9:15 AM High/Low with Automatic Forecasting", overlay=true)

// Parameters
showSignals = input(true, title="Show Signals")

// Define session time
sessionStartHour = input(9, title="Session Start Hour")
sessionStartMinute = input(0, title="Session Start Minute")
sessionEndHour = input(9, title="Session End Hour")
sessionEndMinute = input(15, title="Session End Minute")

// Calculate session high and low
var float sessionHigh = na
var float sessionLow = na
if (hour == sessionStartHour and minute == sessionStartMinute)
    sessionHigh := high
    sessionLow := low

// Update session high and low if within session time
if (hour == sessionStartHour and minute >= sessionStartMinute and minute < sessionEndMinute)
    sessionHigh := high > sessionHigh or na(sessionHigh) ? high : sessionHigh
    sessionLow := low < sessionLow or na(sessionLow) ? low : sessionLow

// Plot horizontal lines for session high and low
plot(sessionHigh, color=color.green, title="9:00 AM High", style=plot.style_stepline, linewidth=1)
plot(sessionLow, color=color.red, title="9:00 AM Low", style=plot.style_stepline, linewidth=1)

// Calculate targets and stop loss
longTarget = sessionHigh + 200
longStopLoss = sessionLow
shortTarget = sessionLow - 200
shortStopLoss = sessionHigh

// Plot targets and stop loss
plot(longTarget, color=color.blue, title="Long Target", style=plot.style_cross, linewidth=1)
plot(longStopLoss, color=color.red, title="Long Stop Loss", style=plot.style_cross, linewidth=1)
plot(shortTarget, color=color.blue, title="Short Target", style=plot.style_cross, linewidth=1)
plot(shortStopLoss, color=color.red, title="Short Stop Loss", style=plot.style_cross, linewidth=1)

// RSI
rsiLength = input(14, title="RSI Length")
overboughtLevel = input(60, title="Overbought Level")
oversoldLevel = input(40, title="Oversold Level")
rsi = ta.rsi(close, rsiLength)

// Entry conditions
longCondition = close > sessionHigh and rsi > overboughtLevel
shortCondition = close < sessionLow and rsi < oversoldLevel

// Long entry
if (showSignals and longCondition)
    strategy.entry("Long", strategy.long)

// Short entry
if (showSignals and shortCondition)
    strategy.entry("Short", strategy.short)
- Automatische Vorhersage der Stop-Loss-Strategie für die langen und kurzen Ziele auf der Grundlage von 9:15 High/Low
- SMC-Strategie, die MACD und EMA kombiniert
- Dynamische Multi-SMA- und MACD-basierte XAUUSD-Handelsstrategie
- Zweifelhafter gleitender Durchschnittswert
- EMA 200 Crossover mit Volumen- und Trendstrategie
- RSI Dynamische Stop Loss und Take Profit-Strategie
- Ichimoku Cloud Lokal-Trend-Identifizierungsstrategie
- 9EMA Dynamische Positionsgrößenstrategie mit zwei 5-minütigen Nähe-Break-outs
- Eine lang-kurzfristige anpassungsfähige dynamische Netzstrategie auf der Grundlage
- ATR Chandelier Exit Strategie mit relativer Stärke
- Intraday-Hammer-Umkehrmuster Langstrategie
- Quantitative Handelsstrategie für CVD Divergenz
- Bollinger Bands und RSI-Kombinationsstrategie
- Ichimoku-Oszillator mit Stochastic Momentum Index Strategie
- KI-Trendprognose Handelsstrategie
- TrendHunter w/MF Mehrzeitrahmen-Trendstrategie
- Bollinger-Bänder und Fibonacci-Retracement-Strategie
- Die RSI- und MACD-Crossover-Strategie
- Eine Handelsstrategie auf der Grundlage eines doppelten gleitenden Durchschnitts-Crossovers
- Dynamische RSI und doppelte gleitende Durchschnitts-Kauf-/Verkaufsstrategie