Dynamischer ATR-Trend nach Strategie auf Basis von Support-Breakout
Schriftsteller:ChaoZhang, Datum: 2024-12-12 17:26:00Tags:ATREMASMC

Übersicht
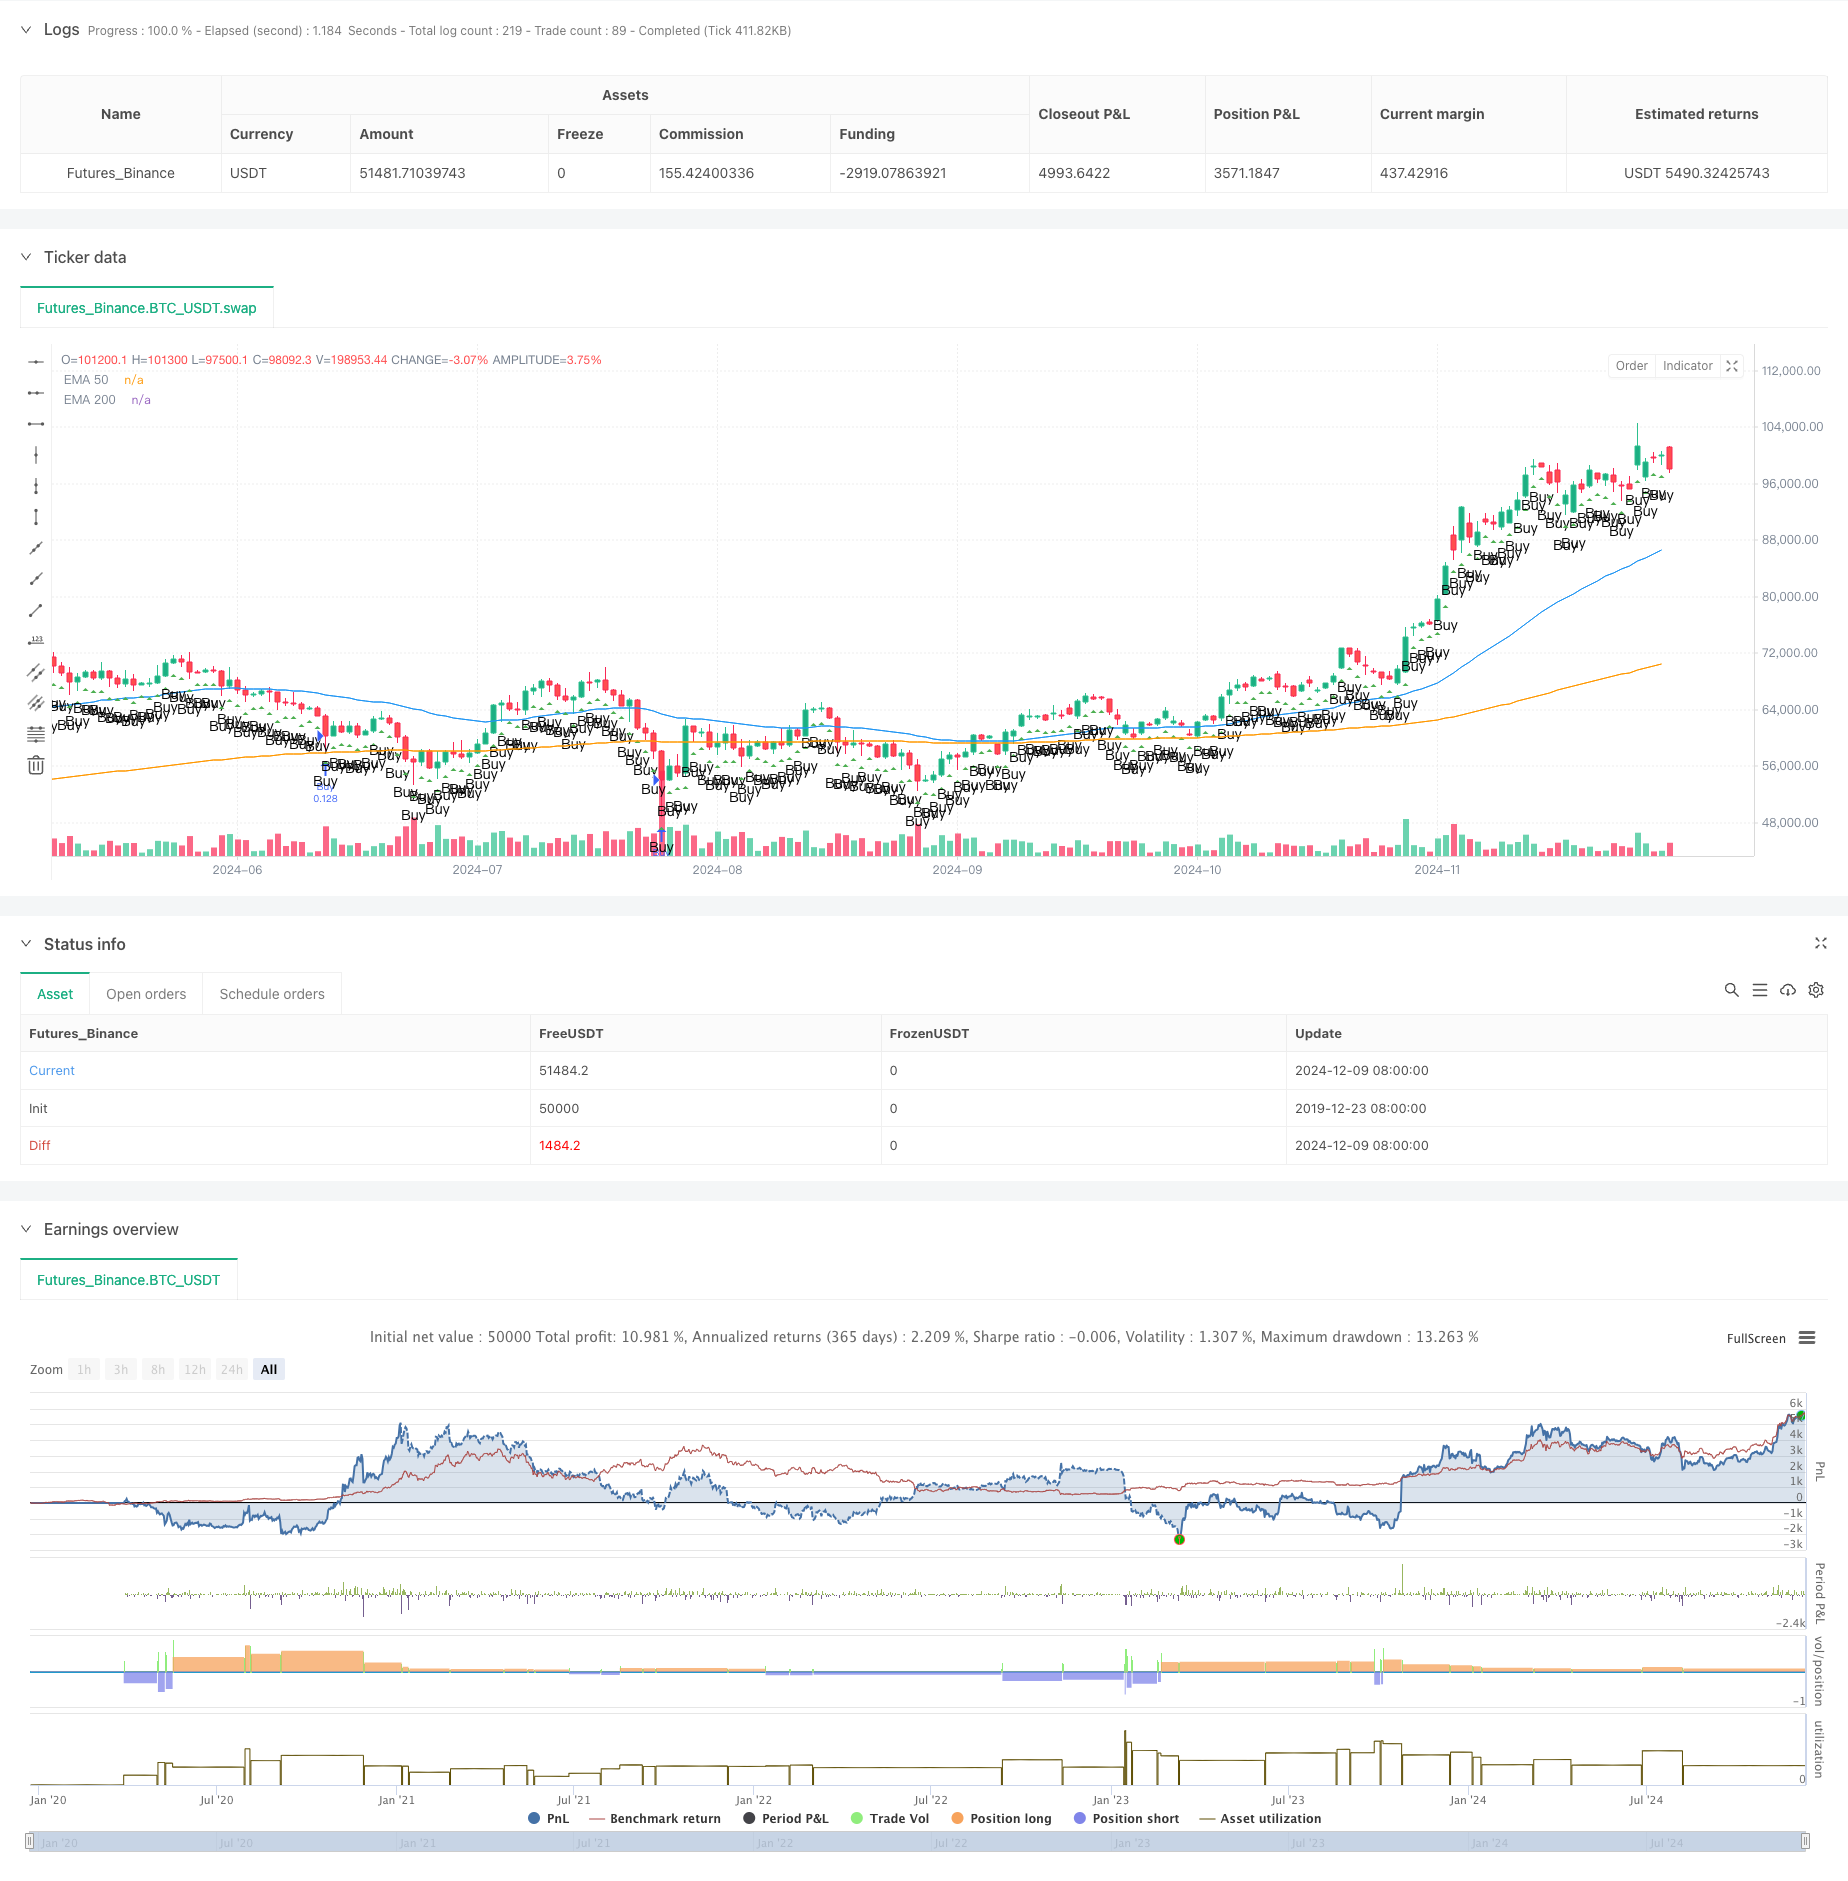
Dies ist ein dynamischer ATR-Trend nach einer Strategie, die auf einem Support-Breakout basiert. Die Strategie beinhaltet EMA-System, ATR-Volatilitätsindikator und Smart Money Concept (SMC), um Markttrends zu erfassen. Es erreicht ein effektives Risikomanagement durch dynamische Positionsgröße und Stop-Loss / Take-Profit-Platzierung.
Strategieprinzip
Die Strategie basiert auf mehreren Kernkomponenten: 1. Verwendet das EMA-System mit 50 und 200-Perioden, um die Markttrendrichtung zu bestätigen 2. Nutzt den ATR-Indikator, um die Stop-Loss- und Gewinnziele dynamisch anzupassen 3. Analysiert Bestellblöcke und Ungleichgewichtszonen, um optimale Einstiegspunkte zu finden 4. Berechnet automatisch die Positionsgröße basierend auf dem Kontorisikoprozentsatz 5. Bestimmt die Konsolidierung des Marktes durch Beobachtung der Preisspanne der letzten 20 Kerzen
Strategische Vorteile
- Umfassendes Risikomanagement durch dynamische Berechnungen
- Zuverlässiges Trend-Identifikationssystem, das Konsolidierungsmärkte vermeidet
- angemessene Stop-Loss- und Take-Profit-Einstellungen mit einem Risiko-Rendite-Verhältnis von 1: 3
- Gut an unterschiedliche Marktbedingungen angepasst
- Eine klare Codestruktur, die leicht zu pflegen und zu optimieren ist
Strategische Risiken
- Die EMA-Indikatoren weisen eine inhärente Verzögerung auf, die die Einstiegspunkte möglicherweise verzögert
- Kann auf stark volatilen Märkten falsche Signale erzeugen
- Strategie hängt von der Fortsetzung des Trends ab, kann in verschiedenen Märkten unterdurchschnittlich sein
- Eine breite Stop-Loss-Platzierung kann in bestimmten Situationen zu größeren Verlusten führen
Optimierungsrichtlinien
- Einbeziehung einer Analyse des Volumen-Preis-Verhältnisses zur Verbesserung der Trendbestimmung
- Hinzufügen von Marktstimmungsindikatoren zur Optimierung des Eintrittszeitpunkts
- Überlegen Sie, ob mehrere Zeitrahmen analysiert werden müssen, um die Systemstabilität zu verbessern
- Kriterien für die Bestimmung von Auftragsblöcken und Ungleichgewichtszonen verfeinern
- Optimierung der Stop-Loss-Methode, Überlegung der Implementierung von Trailing-Stops
Zusammenfassung
Diese Strategie ist ein umfassendes Trend-Folge-System, das durch ein angemessenes Risikomanagement und mehrfache Signalbestätigung eine Handelsstabilität erzielt. Trotz einer gewissen Verzögerung bei Signalen stellt sie insgesamt ein zuverlässiges Handelssystem dar. Es wird empfohlen, vor der Implementierung gründliches Backtesting durchzuführen und die Parameter entsprechend spezifischen Handelsinstrumenten und Marktbedingungen zu optimieren.
/*backtest
start: 2019-12-23 08:00:00
end: 2024-12-10 08:00:00
period: 1d
basePeriod: 1d
exchanges: [{"eid":"Futures_Binance","currency":"BTC_USDT"}]
*/

// TradingView Pine Script strategy for Smart Money Concept (SMC)
//@version=5
strategy("Smart Money Concept Strategy", overlay=true, default_qty_type=strategy.fixed, default_qty_value=100)

// === Input Parameters ===
input_risk_percentage = input.float(1, title="Risk Percentage", step=0.1)
input_atr_length = input.int(14, title="ATR Length")
input_ema_short = input.int(50, title="EMA Short")
input_ema_long = input.int(200, title="EMA Long")

// === Calculations ===
atr = ta.atr(input_atr_length)
ema_short = ta.ema(close, input_ema_short)
ema_long = ta.ema(close, input_ema_long)

// === Utility Functions ===
// Identify Order Blocks
is_order_block(price, direction) =>
    ((high[1] > high[2] and low[1] > low[2] and direction == 1) or (high[1] < high[2] and low[1] < low[2] and direction == -1))

// Identify Imbalance Zones
is_imbalance() =>
    range_high = high[1]
    range_low = low[1]
    range_high > close and range_low < close

// Calculate Lot Size Based on Risk
calculate_lot_size(stop_loss_points, account_balance) =>
    risk_amount = account_balance * (input_risk_percentage / 100)
    lot_size = risk_amount / (stop_loss_points * syminfo.pointvalue)
    lot_size

// Determine if Market is Consolidating
is_consolidating() =>
    (ta.highest(high, 20) - ta.lowest(low, 20)) / atr < 2

// === Visual Enhancements ===
// Plot Order Blocks
// if is_order_block(close, 1)
//     line.new(x1=bar_index[1], y1=low[1], x2=bar_index, y2=low[1], color=color.green, width=2, extend=extend.right)
// if is_order_block(close, -1)
//     line.new(x1=bar_index[1], y1=high[1], x2=bar_index, y2=high[1], color=color.red, width=2, extend=extend.right)

// Highlight Imbalance Zones
// if is_imbalance()
//     box.new(left=bar_index[1], top=high[1], right=bar_index, bottom=low[1], bgcolor=color.new(color.orange, 80))

// === Logic for Trend Confirmation ===
is_bullish_trend = ema_short > ema_long
is_bearish_trend = ema_short < ema_long

// === Entry Logic ===
account_balance = strategy.equity
if not is_consolidating()
    if is_bullish_trend
        stop_loss = close - atr * 2
        take_profit = close + (math.abs(close - (close - atr * 2)) * 3)
        stop_loss_points = math.abs(close - stop_loss) / syminfo.pointvalue
        lot_size = calculate_lot_size(stop_loss_points, account_balance)
        strategy.entry("Buy", strategy.long, qty=lot_size)
        strategy.exit("TP/SL", "Buy", stop=stop_loss, limit=take_profit)

    if is_bearish_trend
        stop_loss = close + atr * 2
        take_profit = close - (math.abs(close - (close + atr * 2)) * 3)
        stop_loss_points = math.abs(close - stop_loss) / syminfo.pointvalue
        lot_size = calculate_lot_size(stop_loss_points, account_balance)
        strategy.entry("Sell", strategy.short, qty=lot_size)
        strategy.exit("TP/SL", "Sell", stop=stop_loss, limit=take_profit)

// === Plotting Indicators ===
plot(ema_short, color=color.blue, title="EMA 50")
plot(ema_long, color=color.orange, title="EMA 200")
plotshape(series=is_bullish_trend and not is_consolidating(), style=shape.triangleup, location=location.belowbar, color=color.green, text="Buy")
plotshape(series=is_bearish_trend and not is_consolidating(), style=shape.triangledown, location=location.abovebar, color=color.red, text="Sell")
- Erweiterte Multi-Indikator-Momentum-Handelsstrategie
- Multi-Indikator-Trend nach Strategie mit dynamischem Kanal und gleitendem Durchschnittshandelssystem
- K Folge-Kerzen Bull-Bär Strategie
- Strategie zur Optimierung des lang-kurzen Marktes auf der Grundlage von Volatilität und linearer Regression
- Multi-EMA-Kreuzung mit Oszillator und dynamischer Handelsstrategie für Unterstützung/Widerstand
- Keltner Kanäle EMA ATR-Strategie
- SMC & EMA-Strategie mit Gewinn- und Verlustprognosen
- Dynamische Gewinn- und Stop-Loss-Anpassungsstrategie auf Basis von ATR und EMA
- Dynamische Entwicklung der EMA im Anschluss an die Handelsstrategie
- Strategie für die dreifache EMA-Überschreitung
- Doppelmomentum Durchbruch Bestätigung Quantitative Handelsstrategie
- MACD-RSI Trendmomentum-Kreuzstrategie mit Risikomanagementmodell
- Multiperiodische EMA-Crossover mit RSI-Impuls und ATR-Volatilitäts-basierter Tendenz nach Strategie
- Doppelte EMA-Crossover-Strategie mit intelligenter Risikovergütungskontrolle
- Multi-Moving Average Trend Following Strategy - Langfristiges Anlage-Signalsystem auf Basis von EMA- und SMA-Indikatoren
- Historisch hoher Durchbruch mit monatlichem gleitendem Durchschnitt Filter Trend nach Strategie
- Multi-Equilibrium-Kursentwicklung und Umkehrhandelsstrategie
- Dynamischer Volatilitätsindex (VIDYA) mit ATR-Trend-Folgende Umkehrstrategie
- Multi-Indikator-Adaptive Handelsstrategie auf Basis von RSI, MACD und Volumen
- Preismusterbasierte doppelte automatische Handelsstrategie mit unterem und oberem Niveau
- Mehrfacher gleitender Durchschnitt und Stochastischer Oszillator
- Adaptive Trendfollowing und Strategie zur Erkennung von Umkehrungen: Ein quantitatives Handelssystem auf Basis von ZigZag- und Aroon-Indikatoren
- Synergistische Handelsstrategie mit mehreren Indikatoren mit Bollinger-Bändern, Fibonacci, MACD und RSI
- Mittelreversion Bollinger Band Dollar-Kosten-Durchschnittsinvestitionsstrategie
- Multidimensionales Anomalien-Strategie-Analyse-System für Gold Freitag
- Multi-Zeitrahmen-Trend-Dynamische ATR-Verfolgungsstrategie
- Schritt für Schritt, um die RSI-Trenddynamik zu verfolgen
- Dynamische ATR-basierte Trailing Stop-Handelsstrategie
- Momentum-Trend nach der MACD-RSI-Doppelbestätigungs-Handelsstrategie
- Dynamische Drehpunkte mit Optimierungssystem Golden Cross