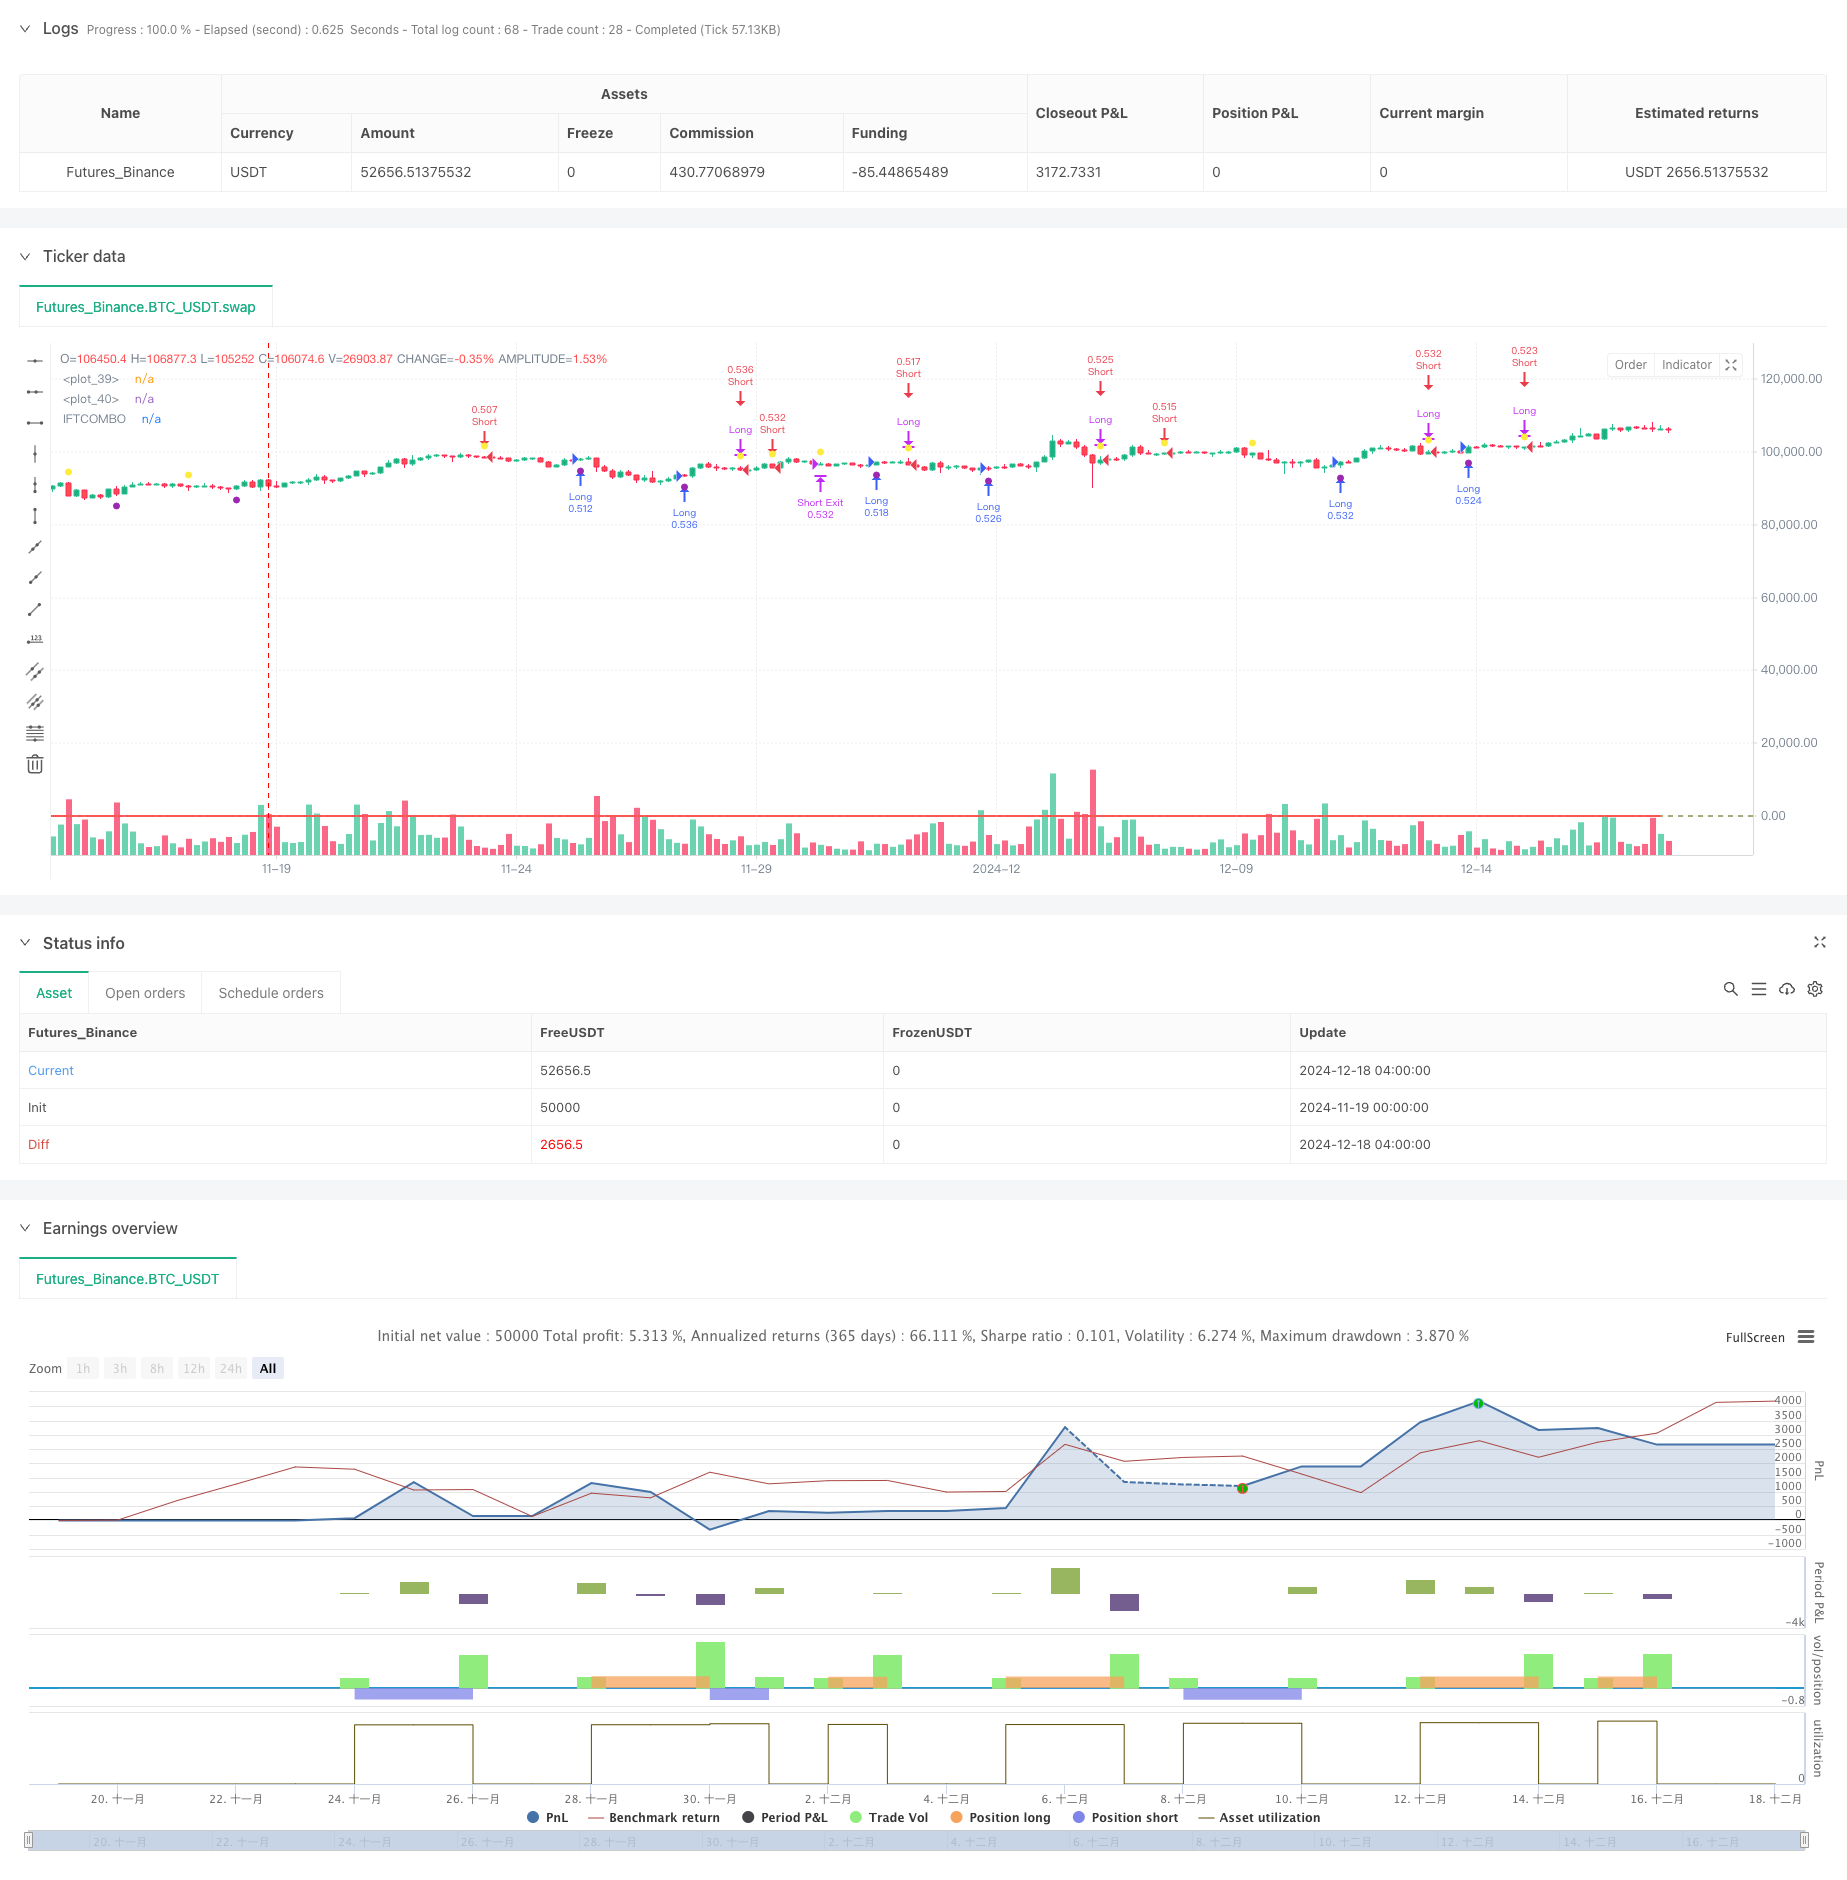
Multi-Indikator-Dynamische Optimierungsstrategie für den Handel
Schriftsteller:ChaoZhang, Datum: 2024-12-20 16:31:21Tags:CCIRSIMFIWMAIFT

Übersicht
Diese Strategie ist ein Handelssystem, das auf mehreren technischen Indikatoren basiert und CCI-, RSI-, Stochastic- und MFI-Indikatoren mit exponentieller Glättung integriert, um einen umfassenden Marktanalyserahmen zu erstellen.
Strategieprinzip
Der Kern der Strategie besteht darin, durch Multi-Indikatoren-Fusion zuverlässigere Handelssignale bereitzustellen.
- Berechnung und Normalisierung der Indikatoren CCI, RSI, Stochastic und MFI
- WMA-Gleichung auf Indikatorwerte anwenden
- Umwandeln von Werten in ein einheitliches Intervall mit IFT
- Berechnen Sie den Durchschnitt der vier transformierten Indikatoren als Endsignal
- Lange Signale erzeugen, wenn -0,5 überschritten wird, und kurze Signale, wenn 0,5 überschritten wird
- Für die Risikokontrolle werden 0,5% Stop-Loss und 1% Take-Profit festgelegt.
Strategische Vorteile
- Die Fusion mit mehreren Indikatoren bietet eine umfassende Marktperspektive
- IFT-Transformation sorgt für Konsistenz bei den Indikatorenergebnissen
- WMA-Gleichung verringert effektiv falsche Signale
- Berechtigte Stop-Loss- und Take-Profit-Einstellungen
- Klarer Mechanismus zur Erzeugung von Signalen für Debugging und Optimierung
Strategische Risiken
- Mehrere Indikatoren können auf volatilen Märkten zurückbleiben
- Festgelegte Stop-Loss- und Take-Profit-Parameter entsprechen möglicherweise nicht allen Marktbedingungen
- WMA-Gleichung könnte Signalverzögerungen verursachen
- Indikatorparameter müssen für verschiedene Märkte optimiert werden Vorschläge: Einführung eines dynamischen Risikomanagements, Einführung von Volatilitätsindikatoren, Optimierung der Ausgleichsparameter
Optimierungsrichtlinien
- Einführung anpassungsfähiger Stop-Loss- und Take-Profit-Mechanismen
- Filterung der Marktumgebung hinzufügen
- Optimierung der Signalsynthese durch gewichtete Durchschnittswerte
- Einführung von volumengewichteten und volatilitätsbereinigten Mechanismen
- Entwicklung eines automatischen Parameteroptimierungssystems
Zusammenfassung
Die Strategie baut ein relativ vollständiges Handelssystem durch Multi-Indikator-Fusion und Signaloptimierung auf. Ihre Stärken liegen in der Signalzuverlässigkeit und umfassender Risikokontrolle, aber die Parameter müssen immer noch basierend auf den Marktmerkmalen optimiert werden. Durch die vorgeschlagenen Optimierungsrichtungen hat die Strategie das Potenzial, in verschiedenen Marktumgebungen besser zu funktionieren.
/*backtest
start: 2024-11-19 00:00:00
end: 2024-12-18 08:00:00
period: 4h
basePeriod: 4h
exchanges: [{"eid":"Futures_Binance","currency":"BTC_USDT"}]
*/

//@version=5
strategy('wombocombo', overlay=true, default_qty_type=strategy.percent_of_equity, default_qty_value=100)

// IFTCOMBO Hesaplamaları
ccilength = input.int(5, 'CCI Length')
wmalength = input.int(9, 'Smoothing Length')
rsilength = input.int(5, 'RSI Length')
stochlength = input.int(5, 'STOCH Length')
mfilength = input.int(5, 'MFI Length')

// CCI
v11 = 0.1 * (ta.cci(close, ccilength) / 4)
v21 = ta.wma(v11, wmalength)
INV1 = (math.exp(2 * v21) - 1) / (math.exp(2 * v21) + 1)

// RSI
v12 = 0.1 * (ta.rsi(close, rsilength) - 50)
v22 = ta.wma(v12, wmalength)
INV2 = (math.exp(2 * v22) - 1) / (math.exp(2 * v22) + 1)

// Stochastic
v1 = 0.1 * (ta.stoch(close, high, low, stochlength) - 50)
v2 = ta.wma(v1, wmalength)
INVLine = (math.exp(2 * v2) - 1) / (math.exp(2 * v2) + 1)

// MFI
source = hlc3
up = math.sum(volume * (ta.change(source) <= 0 ? 0 : source), mfilength)
lo = math.sum(volume * (ta.change(source) >= 0 ? 0 : source), mfilength)
mfi = 100.0 - 100.0 / (1.0 + up / lo)
v13 = 0.1 * (mfi - 50)
v23 = ta.wma(v13, wmalength)
INV3 = (math.exp(2 * v23) - 1) / (math.exp(2 * v23) + 1)

// Ortalama IFTCOMBO değeri
AVINV = (INV1 + INV2 + INVLine + INV3) / 4

// Sinyal çizgileri
hline(0.5, color=color.red, linestyle=hline.style_dashed)
hline(-0.5, color=color.green, linestyle=hline.style_dashed)

// IFTCOMBO çizgisi
plot(AVINV, color=color.red, linewidth=2, title='IFTCOMBO')

// Long Trading Sinyalleri
longCondition = ta.crossover(AVINV, -0.5)
longCloseCondition = ta.crossunder(AVINV, 0.5)

// Short Trading Sinyalleri
shortCondition = ta.crossunder(AVINV, 0.5)
shortCloseCondition = ta.crossover(AVINV, -0.5)

// Stop-loss seviyesi (%0.5 kayıp)
stopLoss = strategy.position_avg_price * (1 - 0.005) // Long için
takeProfit = strategy.position_avg_price * (1 + 0.01) // Long için


// Long Strateji Kuralları
if longCondition
    strategy.entry('Long', strategy.long)
    strategy.exit('Long Exit', 'Long', stop=stopLoss, limit=takeProfit) // Stop-loss eklendi


if longCloseCondition
    strategy.close('Long')

// Stop-loss seviyesi (%0.5 kayıp)
stopLossShort = strategy.position_avg_price * (1 + 0.005) // Short için
takeProfitShort = strategy.position_avg_price * (1 - 0.01) // Short için

// Short Strateji Kuralları
if shortCondition
    strategy.entry('Short', strategy.short)
    strategy.exit('Short Exit', 'Short', stop=stopLossShort, limit=takeProfitShort) // Stop-loss eklendi


if shortCloseCondition
    strategy.close('Short')

// Sinyal noktalarını plotlama
plotshape(longCondition, title='Long Signal', location=location.belowbar, color=color.purple, size=size.small)
plotshape(shortCondition, title='Short Signal', location=location.abovebar, color=color.yellow, size=size.small)
- Die Kommission stellt fest, dass die in den Erwägungsgründen 1 und 2 genannten Maßnahmen nicht in Einklang mit den in den Erwägungsgründen 1 und 2 genannten Grundsätzen stehen.
- Multi-Indikator-Intelligente Pyramidenstrategie
- Swing Hull/rsi/EMA-Strategie
- CCI + EMA mit RSI-Kreuzstrategie
- Gewichtete gleitende Durchschnittswerte und Relative Strength Index Crossover-Strategie mit Optimierungssystem für das Risikomanagement
- MOST Indikator Doppelposition Adaptive Strategie
- Adaptive Entwicklung nach Strategie, die AlphaTrend und KAMA mit Risikomanagement kombiniert
- Finanzinstrumenten auf Basis von MFI-Überverkaufszonen-Ausgang und Signalvermittlungssystem
- Multi Moving Average Trading System mit Momentum- und Volumenbestätigung
- Super Scalper - 5 Minuten 15 Minuten
- Multi-EMA-Swing-Trading-Strategie mit ATR-basiertem Risikomanagement
- Erweiterte Mittelumkehrstrategie mit Bollinger-Bändern und RSI-Integration
- Mehrjährige RSI-Divergenz mit einer quantitativen Handelsstrategie für Unterstützung/Widerstand
- Adaptiver Trend nach Strategie mit dynamischem Abzugsteuerungssystem
- Multi-EMA-Golden Cross-Strategie mit getrennter Gewinnspanne
- Multi-Technische Indikator-Trend-Kreuzverfolgungsstrategie: RSI und Stochastisches RSI-Synergiehandelssystem
- Dynamische Buy-Entry-Strategie, die EMA-Crossing und Candle Body Penetration kombiniert
- Intelligente Wellen-Trend-Dollar-Kosten-Durchschnitts-Zyklische Handelsstrategie
- MACD-RSI Crossover Trend nach Strategie mit Bollinger Bands Optimierungssystem
- Anpassungsfähige EMA-Dynamische Position-Breakout-Handelsstrategie
- Multi-SMA-Zone Breakout mit dynamischer Gewinnverbindung
- Dynamische Wellen-Trend-Tracking-Strategie
- Auflösung der Struktur mit Volumenbestätigung Multi-Condition Intelligente Handelsstrategie
- Handelsstrategie für den Handel mit mehreren Indikatoren
- Multi-Condition-Trend nach quantitativer Handelsstrategie auf Basis von Fibonacci-Retracement-Levels
- Mehrzwecktrend nach Handelsstrategie
- Multi-Filter Trend Durchbruch Smart Moving Average Handelsstrategie
- Dynamische EMA-Strategie für Durchbruch und Umkehr
- Dynamische Trendmomentum-Optimierungsstrategie mit G-Kanal-Indikator
- Mehrstufige Strategie für die dynamische Dreifachverfolgung von ATH