Erweiterte quantitative Trendverfolgungs- und Cloud-Reversal-Kompositionsstrategie
Schriftsteller:ChaoZhang, Datum: 2025-01-06 10:56:42Tags:EMASMA

Übersicht
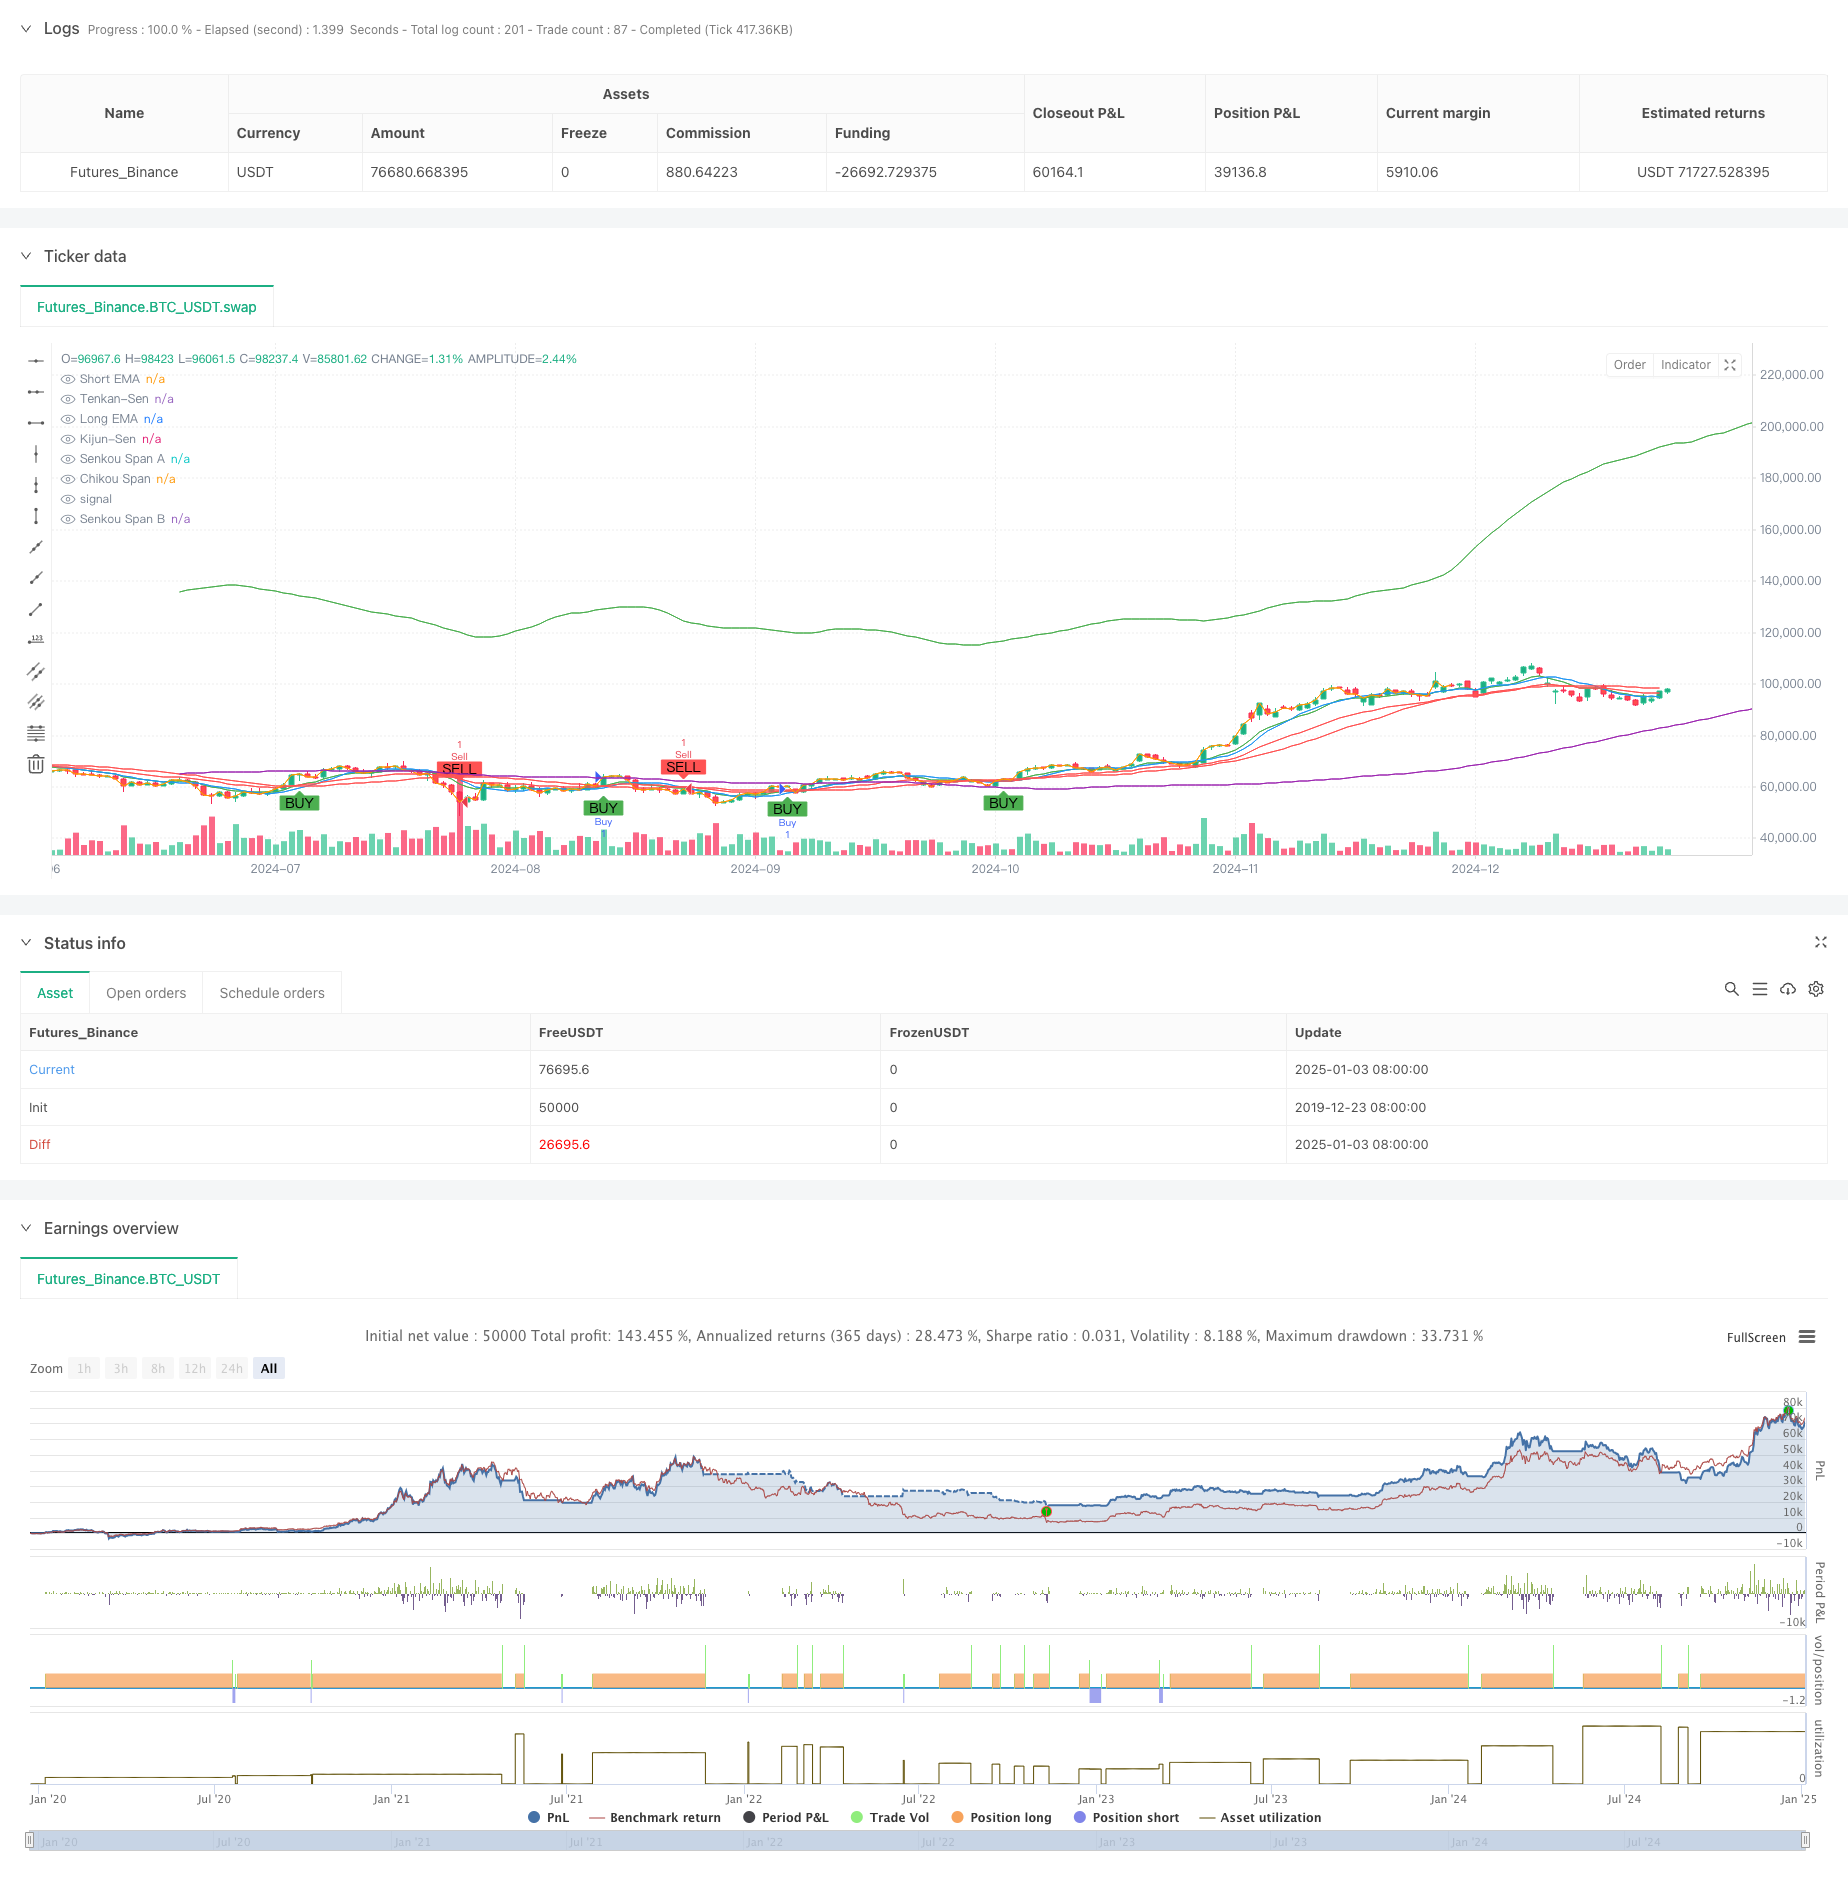
Diese Strategie ist ein zusammengesetztes Handelssystem, das den Crossover des exponentiellen gleitenden Durchschnitts (EMA) und die Ichimoku-Cloud kombiniert. Der EMA-Crossover wird hauptsächlich verwendet, um Trendinitiationssignale zu erfassen und Kaufmöglichkeiten zu bestätigen, während die Ichimoku-Cloud verwendet wird, um Marktumkehrungen zu identifizieren und Verkaufspunkte zu bestimmen. Durch die Koordination mehrdimensionaler technischer Indikatoren kann die Strategie Trends effektiv erfassen und gleichzeitig Risiken vermeiden.
Strategieprinzip
Die Strategie setzt sich aus zwei Kernkomponenten zusammen:
- EMA Crossover Buy Signal: Verwendet das Crossover von kurzfristigen (9-tägigen) und langfristigen (21-tägigen) exponentiellen gleitenden Durchschnitten, um die Trendrichtung zu bestätigen.
- Ichimoku Cloud Sell Signal: Bestimmt Trendumkehrungen durch die Preisposition im Verhältnis zur Cloud und der internen Cloud-Struktur. Verkaufssignale werden ausgelöst, wenn der Preis unter die Cloud bricht oder wenn Leading Span A unter Leading Span B überschreitet. Die Strategie umfasst Stop-Loss bei 1,5% und Take-Profit bei 3%.
Strategische Vorteile
- Mehrdimensionale Signalbestätigung: Die Kombination von EMA Crossover und Ichimoku Cloud validiert Handelssignale aus verschiedenen Perspektiven.
- Umfassende Risikokontrolle: Feste Prozentsatz-Stop-Loss- und Gewinnziele kontrollieren das Risiko für jeden Handel effektiv.
- Starke Trend-Erfassungskapazität: Der EMA-Crossover erfasst den Beginn des Trends, während die Ichimoku Cloud effektiv die Enden des Trends identifiziert.
- Klare und objektive Signale: Handelssignale werden automatisch durch technische Indikatoren erzeugt, wodurch die subjektive Beurteilung verringert wird.
Strategische Risiken
- Das Marktrisiko kann häufige falsche Signale in seitlichen Märkten erzeugen, was zu aufeinanderfolgenden Stopps führt.
- Verzögerungsrisiko: Sowohl gleitende Durchschnitte als auch die Ichimoku Cloud haben eine inhärente Verzögerung, die bei schnellen Marktbewegungen möglicherweise optimale Einstiegspunkte verfehlt.
- Parameterempfindlichkeit: Die Strategieleistung ist an die Parameter-Einstellungen angepaßt und muss unter unterschiedlichen Marktbedingungen angepasst werden.
Optimierung der Strategie
- Hinzufügen von Marktumfeldfiltern: Hinzufügen von Volatilitäts- oder Trendstärkenindikatoren zur Anpassung der Strategieparameter an die Marktbedingungen.
- Optimieren Sie den Stop-Loss-Mechanismus: Überlegen Sie, dynamische Stopps wie Trailing Stops oder ATR-basierte Stopps zu implementieren.
- Verbessern Sie die Signalbestätigung: Fügen Sie Lautstärke- und Impulsindikatoren hinzu, um die Signalzuverlässigkeit zu verbessern.
- Implementieren von Positionsgrößen: Dynamische Anpassung der Positionsgröße basierend auf der Signalstärke und der Marktvolatilität.
Zusammenfassung
Diese Strategie baut ein Handelssystem auf, das sowohl Trendverfolgung als auch Umkehrung durch die organische Kombination von EMA Crossover und Ichimoku Cloud erfassen kann. Das Strategiedesign ist rational mit angemessener Risikokontrolle und zeigt einen guten praktischen Anwendungswert. Durch die vorgeschlagenen Optimierungsrichtungen gibt es Raum für weitere Verbesserungen. Für den Live-Handel wird empfohlen, zunächst geeignete Parameterkombinationen durch Backtesting zu bestimmen und dynamische Anpassungen anhand der tatsächlichen Marktbedingungen vorzunehmen.
/*backtest
start: 2019-12-23 08:00:00
end: 2025-01-04 08:00:00
period: 1d
basePeriod: 1d
exchanges: [{"eid":"Futures_Binance","currency":"BTC_USDT"}]
*/

//@version=5
strategy("EMA Crossover Buy + Ichimoku Cloud Sell Strategy", overlay=true)

// Input Parameters for the EMAs
shortEmaPeriod = input.int(9, title="Short EMA Period", minval=1)
longEmaPeriod = input.int(21, title="Long EMA Period", minval=1)

// Input Parameters for the Ichimoku Cloud
tenkanPeriod = input.int(9, title="Tenkan-Sen Period", minval=1)
kijunPeriod = input.int(26, title="Kijun-Sen Period", minval=1)
senkouSpanBPeriod = input.int(52, title="Senkou Span B Period", minval=1)
displacement = input.int(26, title="Displacement", minval=1)

// Calculate the EMAs
shortEma = ta.ema(close, shortEmaPeriod)
longEma = ta.ema(close, longEmaPeriod)

// Ichimoku Cloud Calculations
tenkanSen = ta.sma(close, tenkanPeriod)
kijunSen = ta.sma(close, kijunPeriod)
senkouSpanA = ta.sma(tenkanSen + kijunSen, 2)
senkouSpanB = ta.sma(close, senkouSpanBPeriod)
chikouSpan = close[displacement]

// Plot the EMAs on the chart
plot(shortEma, color=color.green, title="Short EMA")
plot(longEma, color=color.red, title="Long EMA")

// Plot the Ichimoku Cloud
plot(tenkanSen, color=color.blue, title="Tenkan-Sen")
plot(kijunSen, color=color.red, title="Kijun-Sen")
plot(senkouSpanA, color=color.green, title="Senkou Span A", offset=displacement)
plot(senkouSpanB, color=color.purple, title="Senkou Span B", offset=displacement)
plot(chikouSpan, color=color.orange, title="Chikou Span", offset=-displacement)

// Buy Condition: Short EMA crosses above Long EMA
buyCondition = ta.crossover(shortEma, longEma)

// Sell Condition: Tenkan-Sen crosses below Kijun-Sen, and price is below the cloud
sellCondition = ta.crossunder(tenkanSen, kijunSen) and close < senkouSpanA and close < senkouSpanB

// Plot Buy and Sell signals
plotshape(series=buyCondition, title="Buy Signal", location=location.belowbar, color=color.green, style=shape.labelup, text="BUY")
plotshape(series=sellCondition, title="Sell Signal", location=location.abovebar, color=color.red, style=shape.labeldown, text="SELL")

// Execute Buy and Sell Orders
if (buyCondition)
    strategy.entry("Buy", strategy.long)

if (sellCondition)
    strategy.entry("Sell", strategy.short)

// Optional: Add Stop Loss and Take Profit (risk management)
stopLossPercentage = input.float(1.5, title="Stop Loss Percentage", minval=0.1) / 100
takeProfitPercentage = input.float(3.0, title="Take Profit Percentage", minval=0.1) / 100

longStopLoss = close * (1 - stopLossPercentage)
longTakeProfit = close * (1 + takeProfitPercentage)

shortStopLoss = close * (1 + stopLossPercentage)
shortTakeProfit = close * (1 - takeProfitPercentage)

strategy.exit("Take Profit/Stop Loss", "Buy", stop=longStopLoss, limit=longTakeProfit)
strategy.exit("Take Profit/Stop Loss", "Sell", stop=shortStopLoss, limit=shortTakeProfit)
- Dynamische Kanalprozentsatzstrategie
- Hull-4ema
- MOST- und Doppel gleitender Durchschnitts-Crossover-Strategie
- BMSB-Ausbruchstrategie
- Multi-Moving Average Trend Following Strategy - Langfristiges Anlage-Signalsystem auf Basis von EMA- und SMA-Indikatoren
- Kauf-/Verkaufsstrategie auf Basis von Volumen- und Kerzenmustern
- Multi-EMA-Kreuzstrategie mit Trendbestätigung
- Breakout-Zone-Momentum-Handelsstrategie
- Doppeltzeitlich dynamisches Handelssystem mit Unterstützung
- Strategie für eine doppelte Kreuzung von gleitenden Durchschnitten
- Entwicklung der anpassungsfähigen Strategie zur Bewertung des erwarteten Wertes auf der Grundlage von gleitenden Durchschnitten
- Multi-Indikator-Dynamische Volatilitätshandelsstrategie
- Dynamische Handelstheorie: Exponentielle gleitende Durchschnitts- und kumulative Volumen-Perioden-Kreuzung
- Dynamische EMA-Crossover-Strategie mit dem ADX-Strength-Trendfiltersystem
- Mehrzeitrahmen-Trend-Linear-Engulfing-Muster Quantitative Handelsstrategie
- Adaptive Kanal-Breakout-Strategie mit dynamischem Unterstützungs- und Widerstandshandelssystem
- Dynamische Filterung EMA-Kreuzstrategie für die tägliche Trendanalyse
- Multi-EMA-Crossover mit Camarilla-Trendhandelssystem für Unterstützung/Widerstand
- Erweiterte Trend-Mehrsignaldynamische Handelsstrategie
- Anpassungsmomentum Martingale Handelssystem
- Trend nach RSI und gleitendem Durchschnitt kombinierte quantitative Handelsstrategie
- 5-Tage-EMA-basierter Trend nach Strategieoptimierungsmodell
- Mehrstufige, mehrjährige EMA-Kreuzung für dynamische Gewinnoptimierungsstrategie
- Synergistisches Handelssystem für mehrere technische Indikatoren
- Hochfrequenz-Dynamikoptimierungsstrategie auf der Grundlage mehrfacher technischer Indikatoren
- Triple Supertrend und exponentieller gleitender Durchschnittstrend nach quantitativer Handelsstrategie
- Cloud-basierte Bollinger-Bänder Doppel gleitender Durchschnitt Quantitative Trendstrategie
- Mehrstufige quantitative Handelsstrategie auf der Grundlage der Trenddivergenz der Bollinger-Bänder
- Quantitative Handelsstrategie auf der Grundlage von Fibonacci 0,7-Level-Trend-Durchbruch
- Anpassungsfähige Handelsstrategie für mehrjährige Fractal-Breakout-Order
- Optimierte Strategie für das Risiko-Rendite-Verhältnis auf der Grundlage eines gleitenden Durchschnitts-Crossovers