概述
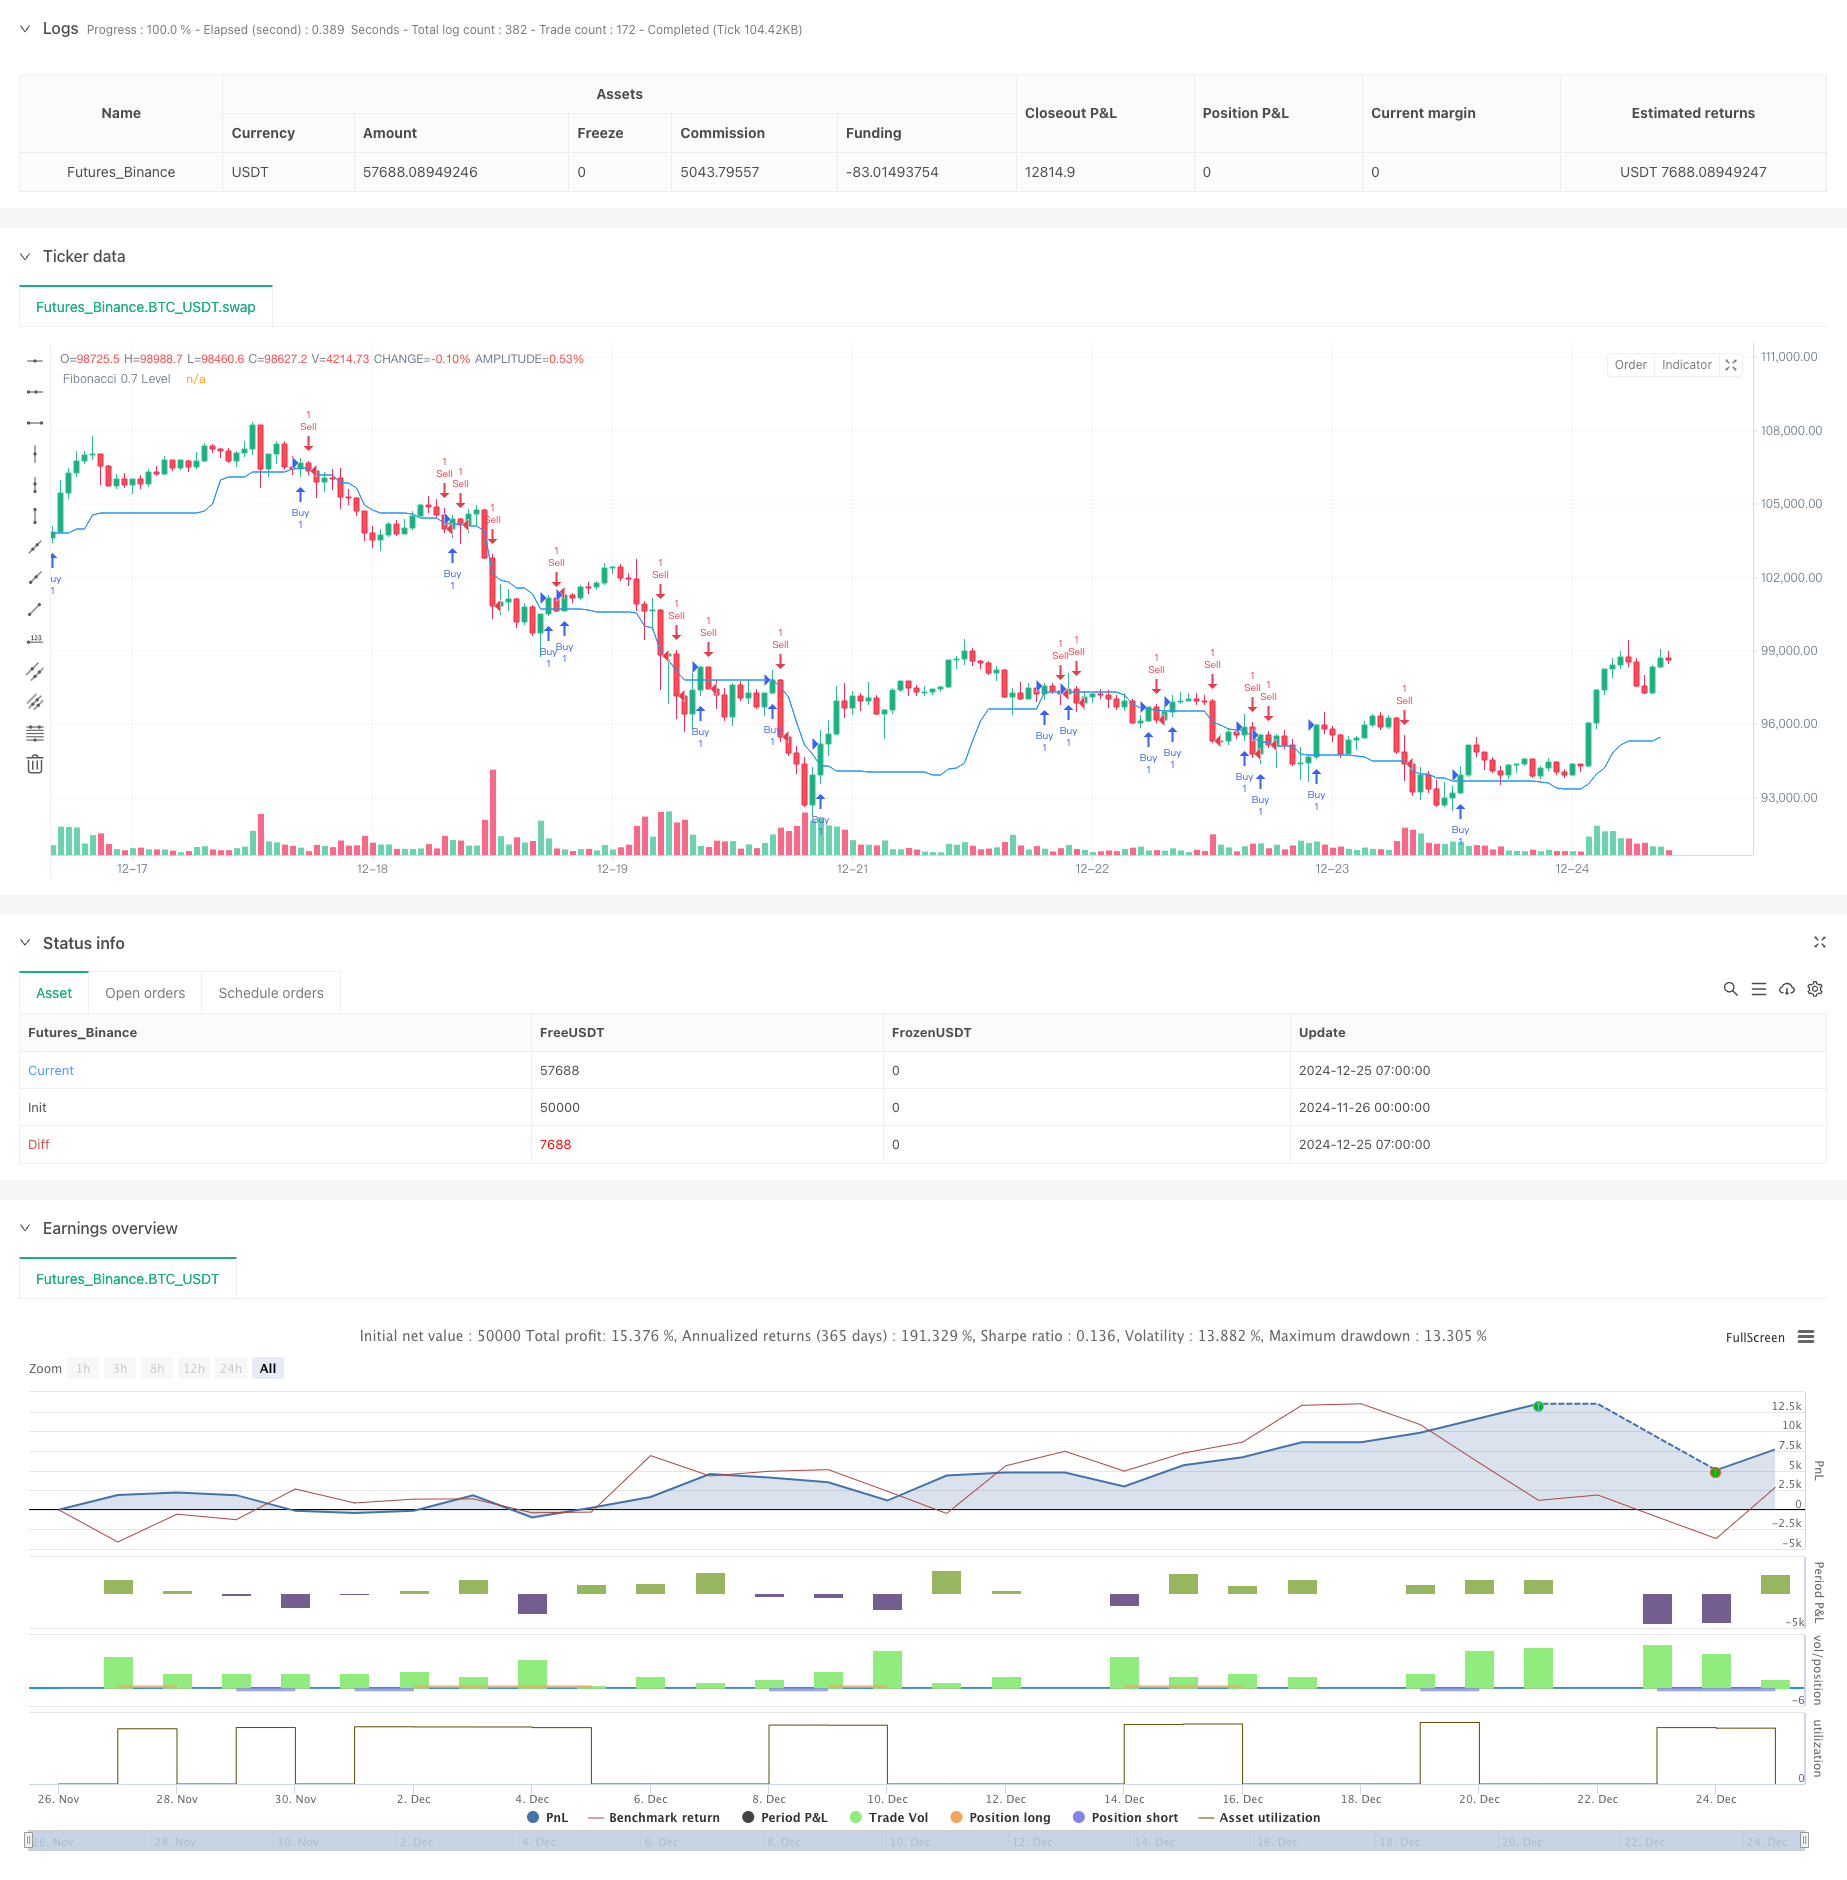
该策略是一个基于斐波那契0.7回撤水平的趋势突破交易系统。它通过计算指定回看期内的最高价和最低价来确定斐波那契0.7水平,并在价格突破该水平时产生交易信号。策略采用了固定百分比的止盈止损来管理风险,默认使用账户总值的5%作为单次交易金额。
策略原理
策略的核心逻辑基于以下几个关键要素: 1. 动态计算斐波那契水平:在指定的回看期(默认20个周期)内,持续追踪最高价和最低价,并计算0.7斐波那契回撤位置。 2. 突破信号确认:当收盘价从下方突破0.7水平时产生做多信号;当从上方突破时产生做空信号。 3. 风险管理:系统设置了对称的止盈止损条件,默认止盈为1.8%,止损为1.2%,这种设置体现了正期望值的理念。 4. 仓位管理:采用账户总值的固定比例作为开仓金额,这种方式有助于资金的动态管理和风险的稳定控制。
策略优势
- 技术指标选择科学:斐波那契回撤是市场广泛认可的技术分析工具,0.7水平通常代表较强的支撑或阻力。
- 信号逻辑清晰:使用价格突破作为交易触发条件,避免了复杂的信号组合可能带来的滞后性。
- 风险收益比合理:止盈止损比例的设置体现了正期望值,有利于长期稳定盈利。
- 资金管理灵活:采用账户比例进行开仓,能够随着账户规模的变化自动调整交易量。
策略风险
- 市场环境依赖:在震荡市场中可能产生频繁的假突破信号,增加交易成本。
- 参数敏感性:回看周期、止盈止损比例等参数的选择会显著影响策略表现。
- 滑点影响:在交易量较小的市场中,可能面临较大的滑点风险。
- 技术局限性:单一技术指标可能无法充分捕捉市场的多维度信息。
策略优化方向
- 信号过滤:可以引入成交量、波动率等辅助指标来过滤假突破信号。
- 动态参数:考虑根据市场波动率动态调整回看周期和止盈止损比例。
- 时间过滤:增加交易时间窗口的限制,避开波动性较大的时段。
- 多周期验证:增加多个时间周期的确认机制,提高信号的可靠性。
总结
该策略基于经典的斐波那契理论,结合了趋势突破和风险管理的核心要素。虽然存在一定的局限性,但通过合理的参数优化和信号过滤,有望在多种市场环境下保持稳定的表现。策略的成功运行需要交易者深入理解市场特征,并根据实际情况进行适当的调整和优化。
策略源码
/*backtest
start: 2024-11-26 00:00:00
end: 2024-12-25 08:00:00
period: 1h
basePeriod: 1h
exchanges: [{"eid":"Futures_Binance","currency":"BTC_USDT"}]
*/

//@version=5
strategy("Fibonacci 0.7 Strategy - 60% Win Rate", overlay=true)

// Input parameters
fibonacci_lookback = input.int(20, minval=1, title="Fibonacci Lookback Period")
take_profit_percent = input.float(1.8, title="Take Profit (%)")
stop_loss_percent = input.float(1.2, title="Stop Loss (%)")

// Calculating Fibonacci levels
var float high_level = na
var float low_level = na
if (ta.change(ta.highest(high, fibonacci_lookback)))
    high_level := ta.highest(high, fibonacci_lookback)
if (ta.change(ta.lowest(low, fibonacci_lookback)))
    low_level := ta.lowest(low, fibonacci_lookback)

fib_level_0_7 = high_level - ((high_level - low_level) * 0.7)

// Entry Conditions
buy_signal = close > fib_level_0_7 and close[1] <= fib_level_0_7
sell_signal = close < fib_level_0_7 and close[1] >= fib_level_0_7

// Risk management
long_take_profit = strategy.position_avg_price * (1 + take_profit_percent / 100)
long_stop_loss = strategy.position_avg_price * (1 - stop_loss_percent / 100)
short_take_profit = strategy.position_avg_price * (1 - take_profit_percent / 100)
short_stop_loss = strategy.position_avg_price * (1 + stop_loss_percent / 100)

// Execute trades
if (buy_signal)
    strategy.entry("Buy", strategy.long)
if (sell_signal)
    strategy.entry("Sell", strategy.short)

// Take Profit and Stop Loss
if (strategy.position_size > 0)
    strategy.exit("Take Profit/Stop Loss", "Buy", stop=long_stop_loss, limit=long_take_profit)
if (strategy.position_size < 0)
    strategy.exit("Take Profit/Stop Loss", "Sell", stop=short_stop_loss, limit=short_take_profit)

// Plot Fibonacci Level
plot(fib_level_0_7, color=color.blue, title="Fibonacci 0.7 Level")
相关推荐