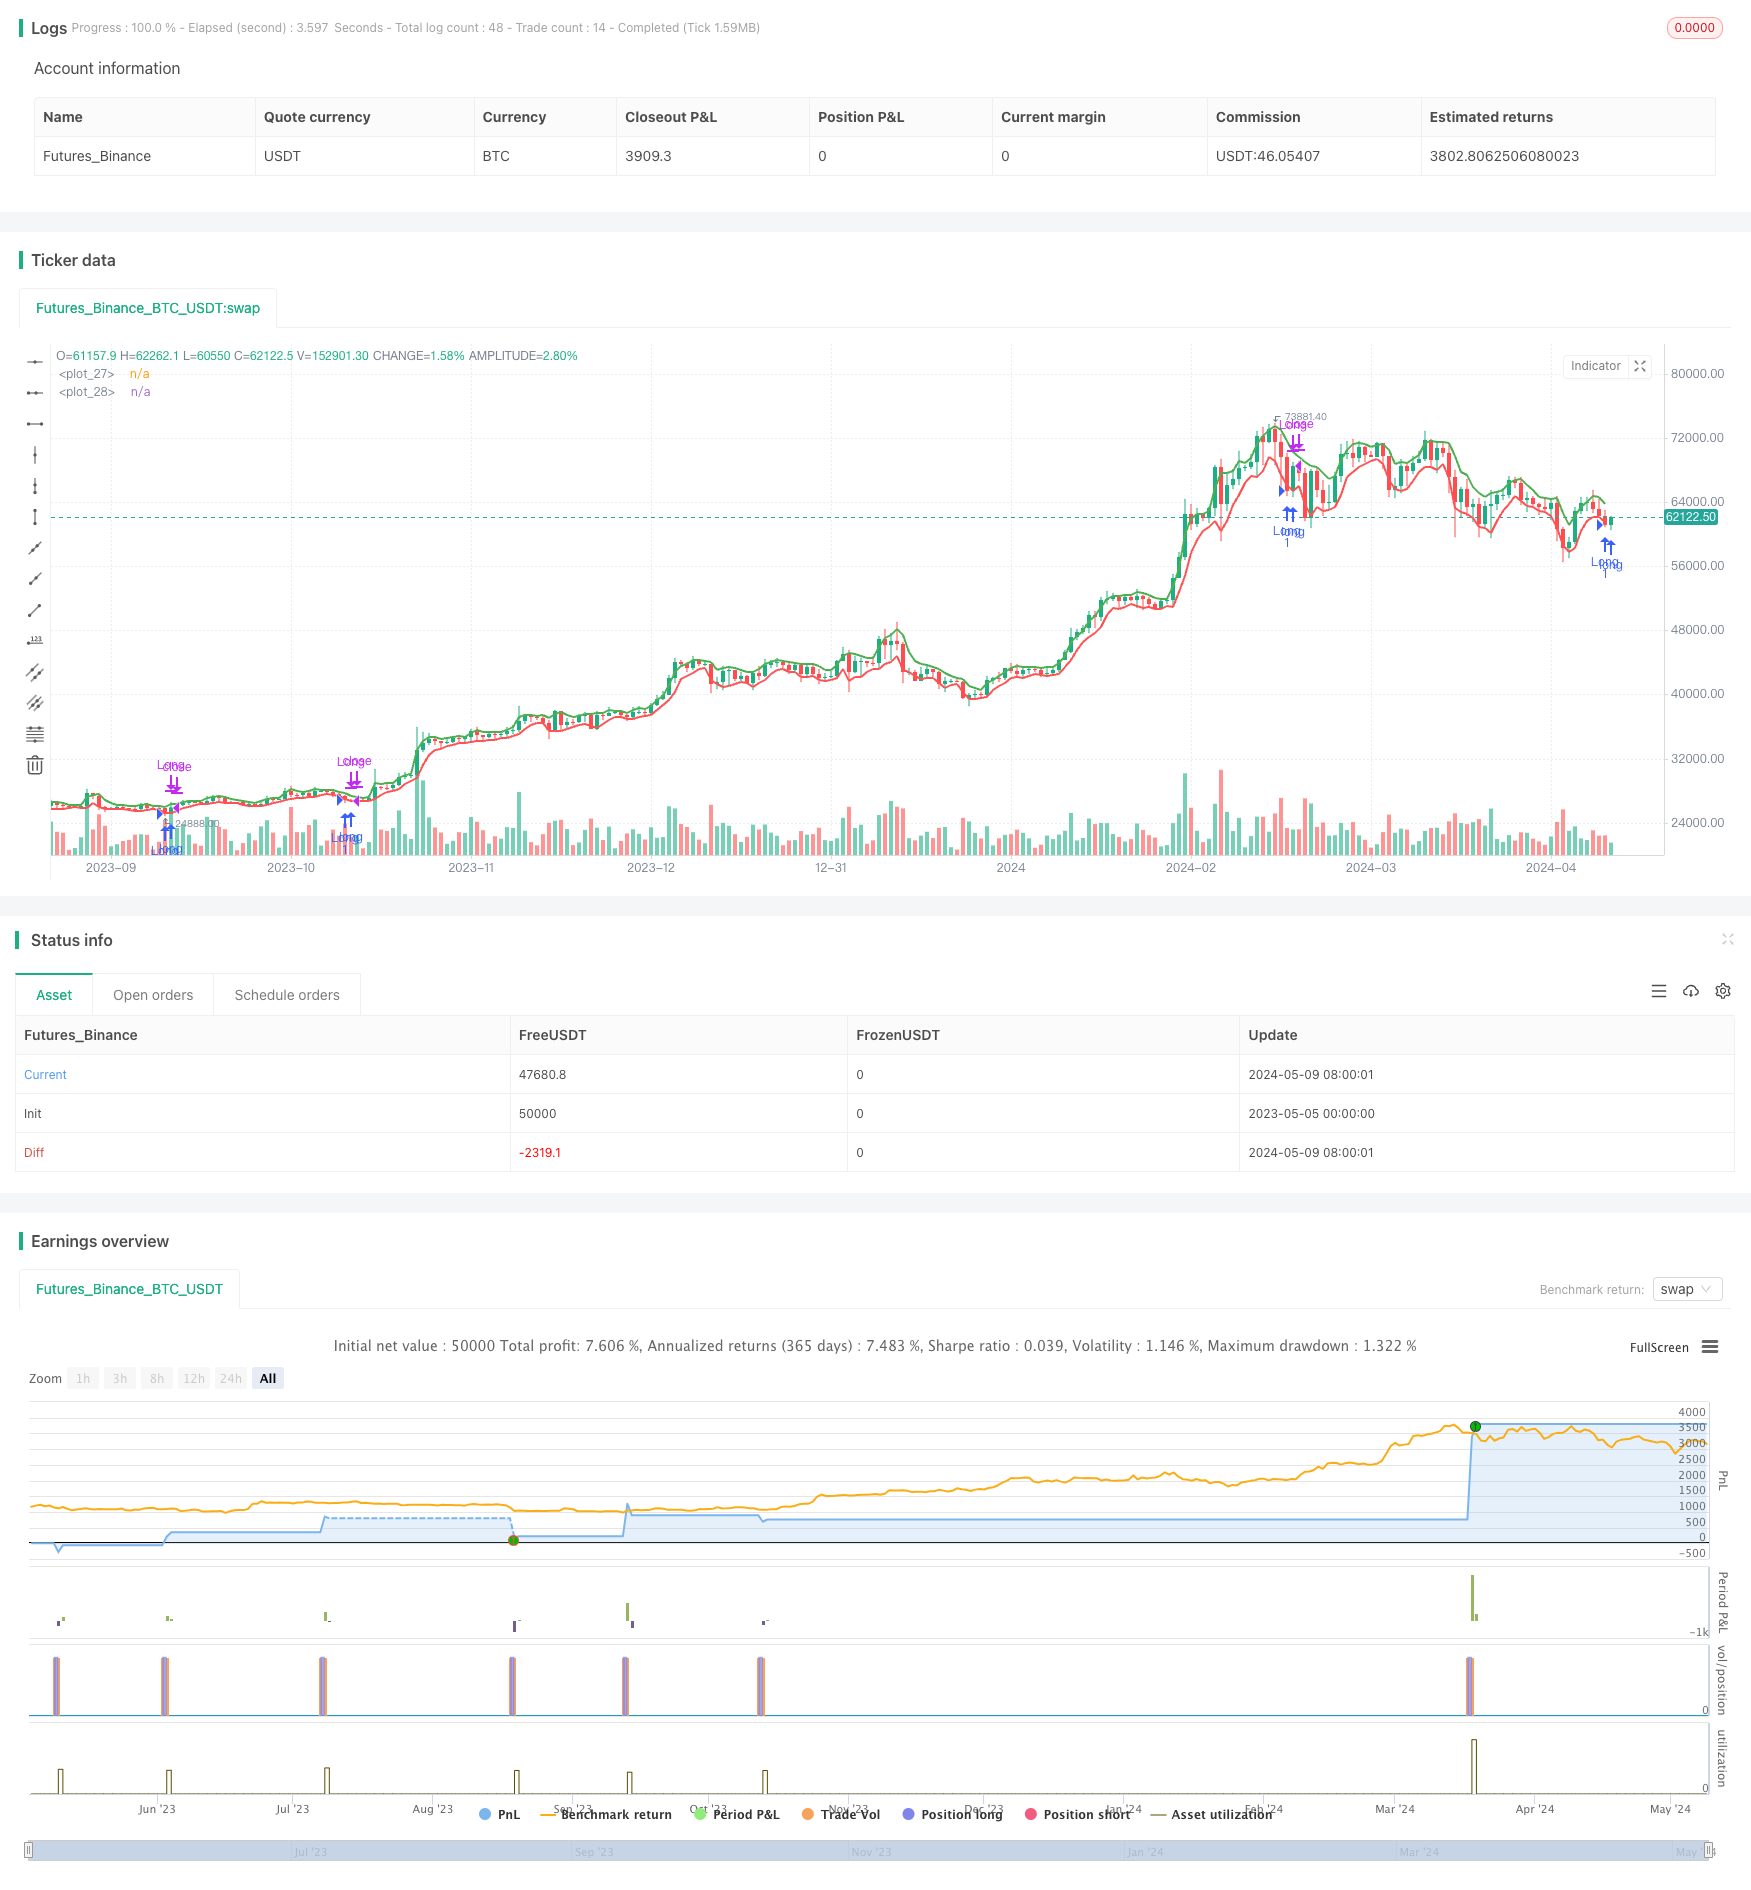
Larry Williams' Three-Period Dynamic Moving Average Trading Strategy
Author: ChaoZhang, Date: 2024-05-11 17:35:22Tags: EMA

Overview
This article introduces a trading strategy based on Larry Williams’ three-period dynamic moving average. The strategy utilizes two exponential moving averages (EMAs) to capture price trends and generates trading signals when the closing price of three consecutive candles breaks through the EMAs. The strategy parameters are adjustable and suitable for different markets and timeframes.
Strategy Principles
- Calculate two EMAs: high price EMA and low price EMA of closing prices, with adjustable periods.
- Determine if the current time is within the set trading interval.
- Determine if the last three candles consecutively closed above (bullish) or below (bearish) the EMAs.
- If condition 3 is met and the position is 0, open a long position; if the opposite of condition 3 is met and a long position is held, close the position.
- Close the position at the end of each trading day if holding a position.
Strategy Advantages
- Flexible parameters: EMA periods, trading time intervals, and other parameters are adjustable to adapt to different markets.
- Trend tracking: Utilizes EMAs and the direction of consecutive candles to identify trends, which helps capture trending markets.
- Timely stop-loss: Immediately closes the position when the price breaks through the EMAs against the trend, controlling drawdowns.
- Intraday position closing: Closes positions at the end of each trading day, avoiding overnight risks.
Strategy Risks
- Choppy market risk: Frequent trading in trendless markets may lead to losses.
- Parameter risk: Performance varies greatly with different parameters in different markets, requiring targeted optimization.
- Gap risk: Opening gaps may cause slippage in the strategy’s entry price, increasing risk.
Strategy Optimization Directions
- Trend filters: Incorporate indicators like ATR and RSI to help assess trend strength and avoid choppy markets.
- Dynamic parameter optimization: Dynamically adjust parameters based on recent market characteristics to improve adaptability.
- Position management: Adjust positions based on trend strength and capital, controlling risks.
- Incorporate stop-loss and profit-taking: Set reasonable stop-loss levels and profit targets to reduce single-trade risk.
Summary
Larry Williams’ three-period dynamic moving average trading strategy is a trend-following strategy based on dual EMAs and the direction of consecutive candles. With parameter optimization, it can adapt to different markets. However, the strategy itself is relatively simple, performs poorly in choppy markets, and lacks risk control measures, requiring further optimization and improvement. Considering the strategy’s pros and cons, it is more suitable for use in markets with clear trends and should be combined with position management and risk control measures to improve overall performance and stability.
/*backtest
start: 2023-05-05 00:00:00
end: 2024-05-10 00:00:00
period: 1d
basePeriod: 1h
exchanges: [{"eid":"Futures_Binance","currency":"BTC_USDT"}]
*/

//@version=5
strategy("Larry Williams 3 Periodos Editável de MarcosJr", overlay=true, process_orders_on_close=true)

// Parametrização do período do EMA
emaPeriodHighs = input.int(title="Highs Period", defval=3, minval=1, maxval=9999)
emaPeriodLows = input.int(title="Lows Period", defval=3, minval=1, maxval=9999)

// Parametrização da data de início e fim do período a ser coletado
startYear = input.int(title="Start Year", defval=2020)
startMonth = input.int(title="Start Month", defval=1, minval=1, maxval=12)
startDay = input.int(title="Start Day", defval=1, minval=1, maxval=31)

endYear = input.int(title="End Year", defval=2020)
endMonth = input.int(title="End Month", defval=12, minval=1, maxval=12)
endDay = input.int(title="End Day", defval=31, minval=1, maxval=31)

// Convertendo data de início e fim para timestamp
startDate = timestamp(startYear, startMonth, startDay, 00, 00)
endDate = timestamp(endYear, endMonth, endDay, 23, 59)

// EMA
emaH = ta.ema(high, emaPeriodHighs)
emaL = ta.ema(low, emaPeriodLows)

// PLOT:
// Desenha as linhas EMA no gráfico
plot(emaH, color=color.green, linewidth=2)
plot(emaL, color=color.red, linewidth=2)

// Condições
inDateRange = true

// Verifica se houve mais de três candles consecutivos do mesmo sentido
checkThreeConsecutiveCandles = (close[0] > close[1] and close[1] > close[2] and close[2] > close[3]) or (close[0] < close[1] and close[1] < close[2] and close[2] < close[3])

if(close < emaL and inDateRange and checkThreeConsecutiveCandles and barstate.isconfirmed)
    strategy.entry("Long", strategy.long, comment="Long", when=strategy.position_size == 0)
if(close > emaH and inDateRange and checkThreeConsecutiveCandles and barstate.isconfirmed)
    strategy.close("Long", comment="Close Long")

// Fechar a operação no fechamento do pregão
if(strategy.position_size > 0 and na(time_close[0]))
    strategy.close("Long", comment="Close Long")
- Multi-Dimensional Trend Analysis with ATR-Based Dynamic Stop Management Strategy
- Advanced Multi-Indicator Trend Confirmation Trading Strategy
- Adaptive Trend Following and Multi-Confirmation Trading Strategy
- Dynamic EMA System Combined with RSI Momentum Indicator for Optimized Intraday Trading Strategy
- Multi-Technical Indicator Crossover Momentum Trend Following Strategy
- EMA Trend with Round Number Breakout Trading Strategy
- Dynamic RSI Quantitative Trading Strategy with Multiple Moving Average Crossover
- Dynamic Trend RSI Indicator Crossing Strategy
- Dual Crossover Trend Following Strategy: EMA and MACD Synergistic Trading System
- Advanced Multi-Indicator Multi-Dimensional Trend Cross Quantitative Strategy
- Multi-Smoothed Moving Average Dynamic Crossover Trend Following Strategy with Multiple Confirmations
- EMA Cross Strategy with RSI Divergence, 30-Minute Trend Identification, and Price Exhaustion
- No Upper Wick Bullish Candle Breakout Strategy
- Relative Strength Index Mean Reversion Strategy
- BMSB Bollinger SuperTrend Trading Strategy
- EMA Dual Crossover Fixed Risk Stop Loss/Take Profit
- SMA Dual Moving Average Trading Strategy
- Short-Term Trading Strategy Based on Bollinger Bands, Moving Average, and RSI
- Dual Moving Average Crossover Strategy
- EMA, MACD, and RSI Triple Indicator Momentum Strategy
- Multi-Timeframe Reversal Confirmation Trading Strategy
- Multi-Moving Average Trend Trading Strategy
- Advanced MACD Strategy with Limited Martingale
- H1 Trend Bias + M15 MACD Signal + M5 Fast Volatility Gap Strategy
- Short-Medium-Long Term Triple Moving Average Trend Following Strategy
- MACD Dual Moving Average Crossover Strategy
- Automated Trading Strategy Based on RSI Overbought and Oversold Levels
- Trading Strategy Based on Support and Resistance Levels Using Technical Analysis
- RSI50_EMA Long Only Strategy
- KDJ Trending View with Signals and MA Strategy
- VWAP and RSI Crossover Strategy