SMA Crossover Long-Short Strategy with Peak Drawdown Control and Auto-Termination
Author: ChaoZhang, Date: 2024-07-29 14:16:58Tags: SMA
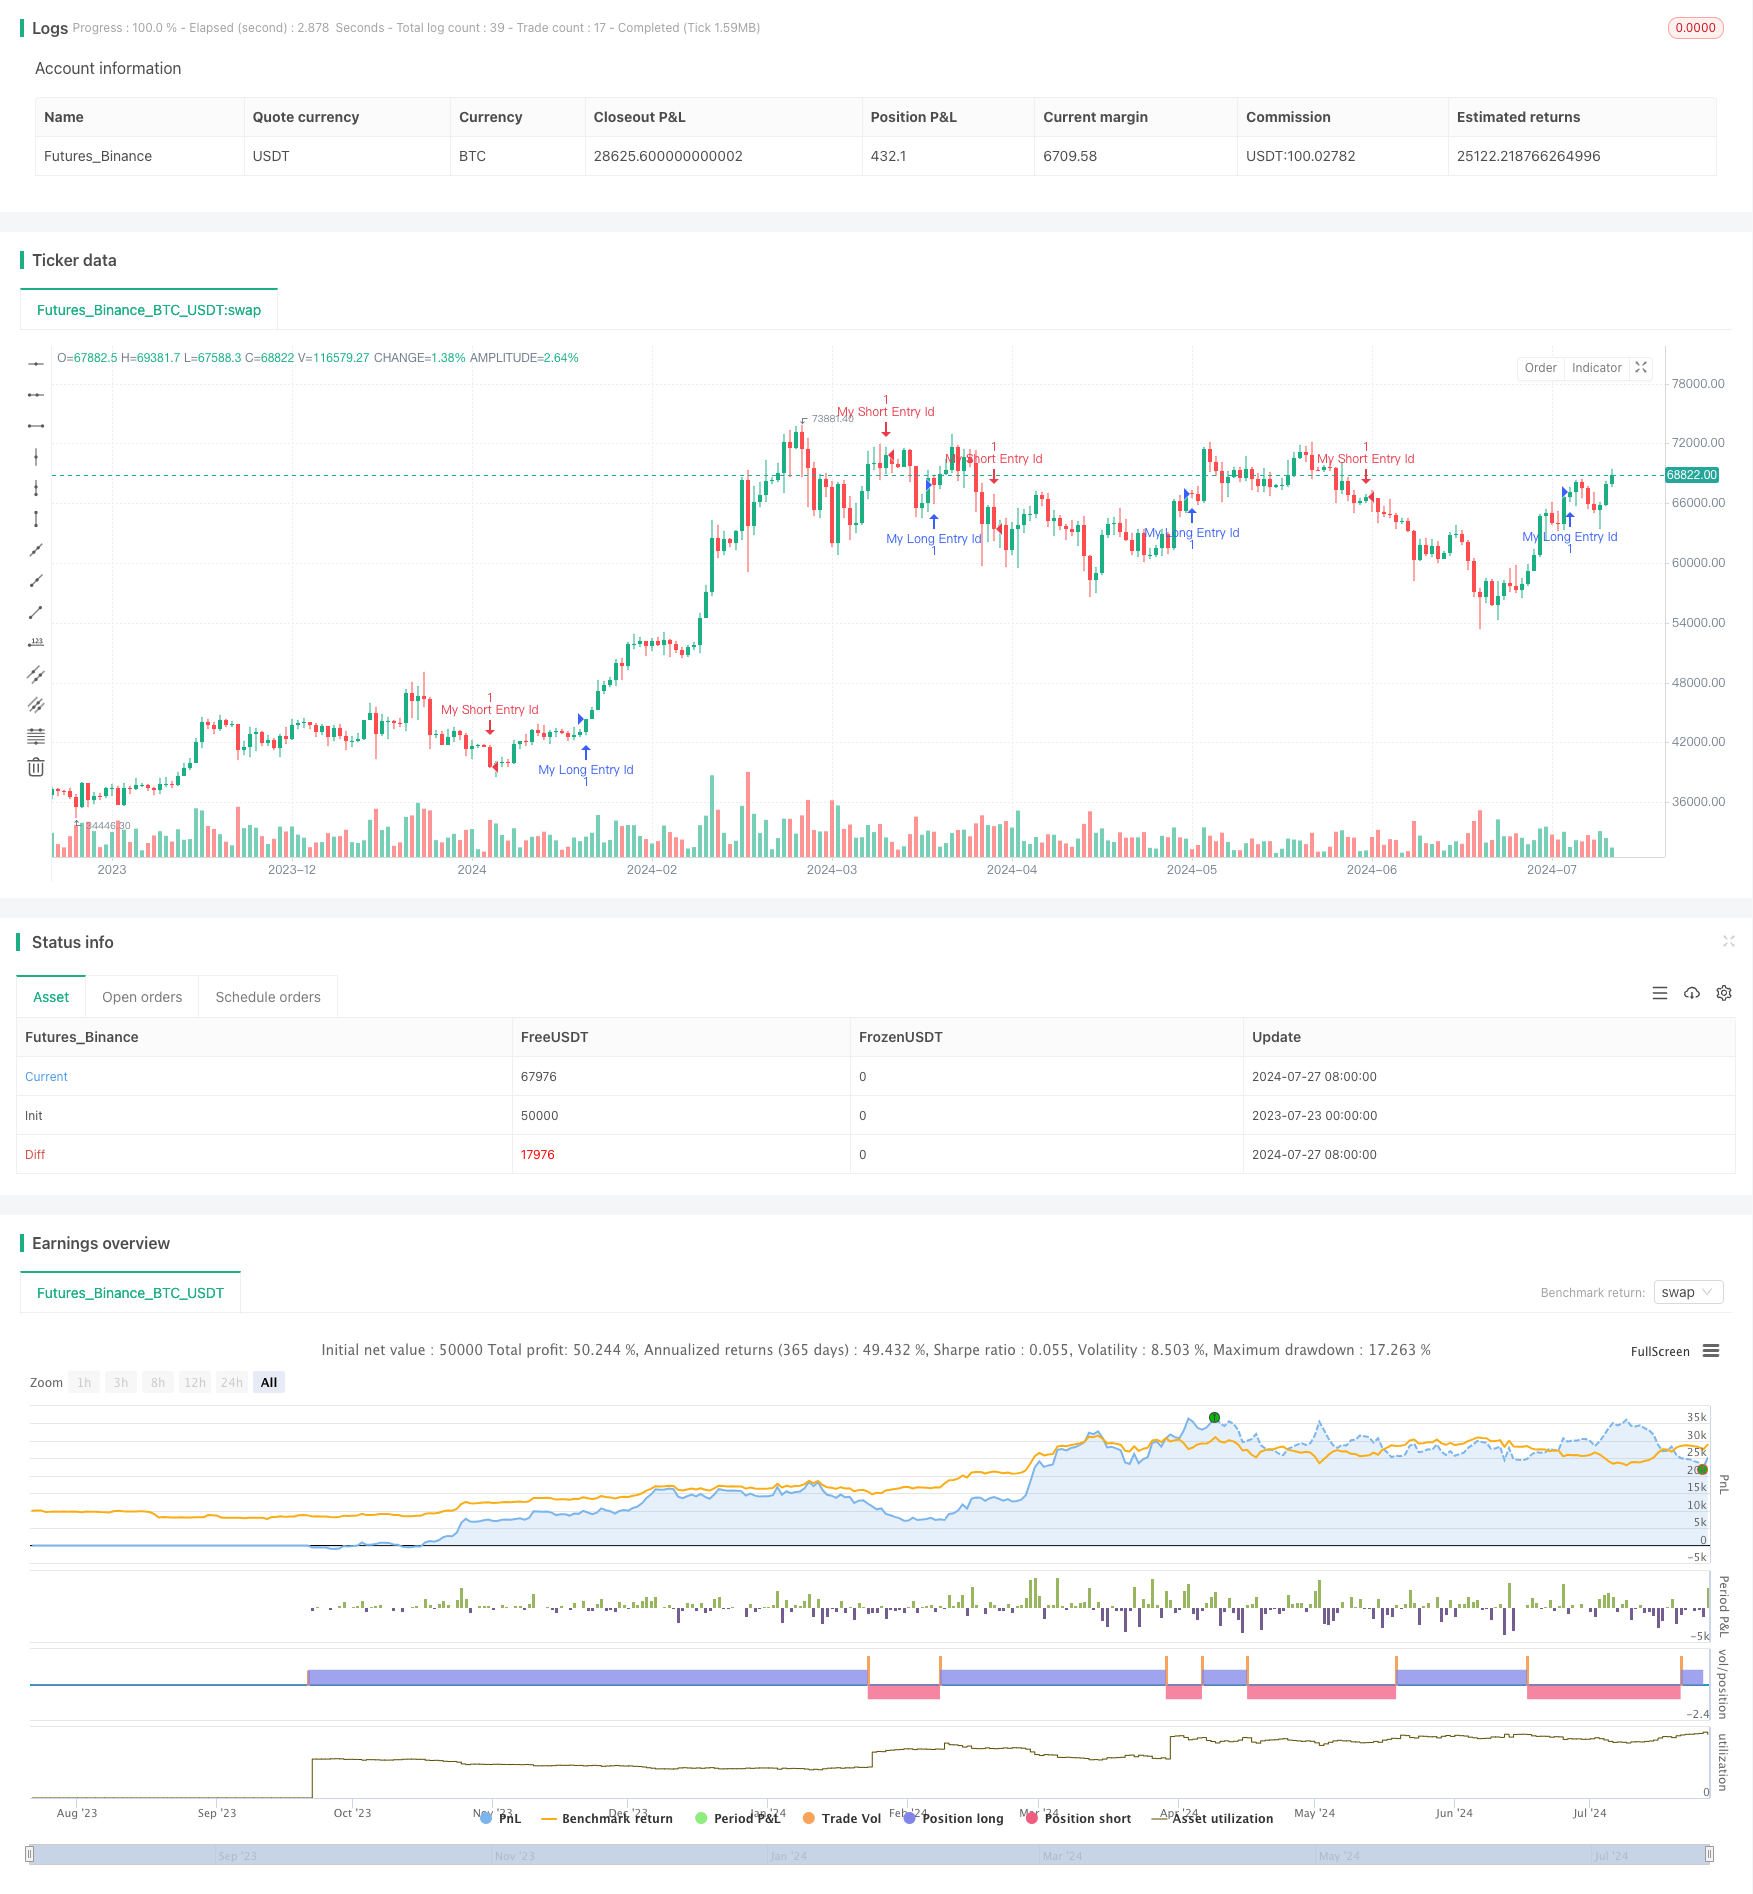
Overview
This strategy is a long-short trading system that combines Simple Moving Average (SMA) crossover signals with peak drawdown control. It uses the crossover of 14-period and 28-period SMAs to generate long and short trading signals while simultaneously monitoring the strategy’s peak drawdown. When the drawdown exceeds a preset threshold, the strategy automatically stops trading. Additionally, the strategy includes a detailed peak-to-trough cycle analysis feature to help traders better understand the risk characteristics of the strategy.
Strategy Principle
Trade Signal Generation:
- A long signal is generated when the 14-period SMA crosses above the 28-period SMA.
- A short signal is generated when the 14-period SMA crosses below the 28-period SMA.
Peak Drawdown Control:
- Real-time tracking of the strategy’s equity curve, recording historical high points (peaks).
- When current equity falls below the peak, it enters a drawdown state, recording the lowest point (trough).
- Drawdown percentage is calculated as: (Peak - Trough) / Peak * 100%.
- If the drawdown percentage exceeds the preset maximum drawdown threshold, the strategy stops opening new positions.
Peak-to-Trough Cycle Analysis:
- Set a minimum drawdown percentage to define valid peak-to-trough cycles.
- For each completed valid cycle, record the cycle number, previous run-up percentage, drawdown percentage, and end time.
- Display analysis results in a table format for easy review of the strategy’s historical performance.
Strategy Advantages
Combines Trend Following and Risk Control: The SMA crossover strategy is a classic trend-following method, while peak drawdown control provides an additional layer of risk management. This combination can effectively control downside risk while capturing market trends.
High Adaptability: By parameterizing the maximum drawdown and minimum drawdown thresholds, the strategy can be flexibly adjusted to different market environments and personal risk preferences.
Transparent Risk Indicators: The peak-to-trough cycle analysis provides detailed historical drawdown information, allowing traders to intuitively understand the strategy’s risk characteristics, aiding in more informed trading decisions.
Automated Risk Control: When drawdown exceeds the preset threshold, the strategy automatically stops trading. This mechanism can effectively prevent continued losses in unfavorable market conditions.
Comprehensive Performance Analysis: In addition to conventional backtesting metrics, the strategy provides detailed peak-to-trough cycle data, including run-up percentages, drawdown percentages, and time information, facilitating in-depth analysis of strategy performance.
Strategy Risks
Over-reliance on Historical Data: The SMA crossover strategy is based on historical price data and may react slowly in rapidly changing markets, leading to false signals.
Frequent Trading: In oscillating markets, SMAs may cross frequently, resulting in excessive trading and high transaction costs.
Potential for Large Drawdowns: Despite maximum drawdown control, a single large drop during severe market volatility can still result in significant losses.
Parameter Sensitivity: Strategy performance is highly dependent on the choice of SMA periods and drawdown thresholds. Improper parameter settings may lead to suboptimal results.
Missing Reversal Opportunities: When trading stops after reaching the maximum drawdown threshold, the strategy may miss opportunities brought by market reversals.
Strategy Optimization Directions
Introduce Dynamic Parameter Adjustment: Consider dynamically adjusting SMA periods and drawdown thresholds based on market volatility to adapt to different market environments.
Add Additional Market Filters: Incorporate other technical indicators or fundamental factors, such as RSI or volume, to filter potential false signals.
Implement Phased Entry and Exit: Instead of all-or-nothing operations, implement phased position building and closing to reduce the risk of single decisions.
Add Take-Profit Mechanism: On top of drawdown control, add a dynamic take-profit function to lock in profits and improve overall returns.
Optimize Money Management: Implement dynamic position sizing based on account size and market volatility for better risk control.
Introduce Machine Learning Algorithms: Use machine learning techniques to optimize parameter selection and signal generation processes, improving strategy adaptability and accuracy.
Conclusion
The SMA crossover long-short strategy combined with peak drawdown control and auto-termination is a quantitative trading system that balances trend following and risk management. It captures market trends through simple moving average crossovers while managing downside risk using peak drawdown control. The strategy’s unique feature lies in its detailed peak-to-trough cycle analysis, providing traders with a tool to deeply understand the strategy’s risk characteristics.
While the strategy has some inherent risks, such as over-reliance on historical data and parameter sensitivity, it can significantly improve its robustness and profitability through appropriate optimization and improvements. These include introducing dynamic parameter adjustments, adding additional market filters, and implementing smarter money management.
Overall, this strategy provides traders with a good starting point that can be further customized and optimized to meet individual trading goals and risk preferences. The modular design of the strategy also makes it easy to integrate with other trading strategies or risk management techniques, laying the foundation for building more complex and comprehensive trading systems.
/*backtest
start: 2023-07-23 00:00:00
end: 2024-07-28 00:00:00
period: 1d
basePeriod: 1h
exchanges: [{"eid":"Futures_Binance","currency":"BTC_USDT"}]
*/

// This Pine Script™ code is subject to the terms of the Mozilla Public License 2.0 at https://mozilla.org/MPL/2.0/

capital = 10000

//@version=5
strategy(title = "Correct Strategy Peak-Drawdown Cycles [Tradingwhale]", shorttitle = "Peak-Draw [Tradingwhale]", initial_capital = capital, overlay=true, margin_long=100, margin_short=100)

// The code below is from Tradingwhale LLC
/// ==============================================================================
//  Peak-Trough Cycles with Date and Prev. RunUp
// Initialize variables
showTable = input.bool(true, title = "Plot Peak to Bottom Drawdown Cycles table?")
min_trough = input.float(3.0, title = "Define Minimum Drawdown/Trough to Display (%)", minval = 1, maxval = 100, step = 0.5, tooltip = "Peaks and Trough Cycles have to be roped in by either a lookback period or minmimum troughs to show. If you don't then every bar could be a peak or trough/bottom. I've decided to use minimum declines here because lookback seems more arbitrary.")
maxdraw = input.float(40.0, title = "Max Drawdown", minval = 1, maxval = 100, step = 0.5, tooltip = "Define the drawdown level where the srtategy stops executing trades.")

var float equityPeak = na
var float equityTrough = na
var int cycleCount = 0
var bool inDrawdown = false
var float initialCapital = capital
var float prevTrough = initialCapital
var float prevRunUp = na
var bool useLighterGray = true
var int lastYear = na

// Variable to indicate whether the strategy should end
var bool end_strategy = false

// Table to display data
var table resultTable = table.new(position.top_right, 5, 30, bgcolor=#ffffff00, frame_color=#4f4040, frame_width=1)

// Function to convert float to percentage string
f_to_percent(value) =>
    str.tostring(value, "#.##") + "%"

// Function to get month/year string without commas
get_month_year_string() =>
    str.tostring(year) + "/" + str.tostring(month)

// Update the table headers
if (bar_index == 0 and showTable)
    table.cell(resultTable, 0, 0, "Show Min Trough: " + f_to_percent(min_trough), bgcolor=#a8a8a88f, text_size=size.normal)
    table.cell(resultTable, 1, 0, "Cycle Count", bgcolor=#a8a8a88f, text_size=size.normal)
    table.cell(resultTable, 2, 0, "Prev.RunUp(%)", bgcolor=#a8a8a88f, text_size=size.normal)
    table.cell(resultTable, 3, 0, "Drawdown(%)", bgcolor=#a8a8a88f, text_size=size.normal)
    table.cell(resultTable, 4, 0, "Year/Month", bgcolor=#a8a8a88f, text_size=size.normal)

// Track peaks and troughs in equity
if (na(equityPeak) or strategy.equity > equityPeak)
    if (inDrawdown and strategy.equity > equityPeak and not na(equityTrough)) // Confirm end of drawdown cycle
        drawdownPercentage = (equityPeak - equityTrough) / equityPeak * 100
        if drawdownPercentage > min_trough
            cycleCount += 1
            prevRunUp := (equityPeak - prevTrough) / prevTrough * 100
            if cycleCount <= 20 and showTable
                currentYear = year
                if na(lastYear) or currentYear != lastYear
                    useLighterGray := not useLighterGray
                    lastYear := currentYear
                rowColor = useLighterGray ? color.new(color.gray, 80) : color.new(color.gray, 50)
                table.cell(resultTable, 1, cycleCount, str.tostring(cycleCount), bgcolor=rowColor, text_size=size.normal)
                table.cell(resultTable, 2, cycleCount, f_to_percent(prevRunUp), bgcolor=rowColor, text_size=size.normal)
                table.cell(resultTable, 3, cycleCount, f_to_percent(drawdownPercentage), bgcolor=rowColor, text_size=size.normal)
                table.cell(resultTable, 4, cycleCount, get_month_year_string(), bgcolor=rowColor, text_size=size.normal)
            prevTrough := equityTrough
    equityPeak := strategy.equity
    equityTrough := na
    inDrawdown := false
else if (strategy.equity < equityPeak)
    equityTrough := na(equityTrough) ? strategy.equity : math.min(equityTrough, strategy.equity)
    inDrawdown := true

// Calculate if the strategy should end
if not na(equityPeak) and not na(equityTrough)
    drawdownPercentage = (equityPeak - equityTrough) / equityPeak * 100
    if drawdownPercentage >= maxdraw
        end_strategy := true


// This code below is from Tradingview, but with additions where commented (see below)

longCondition = ta.crossover(ta.sma(close, 14), ta.sma(close, 28))
if (longCondition) and not end_strategy // Add 'and not end_strategy' to your order conditions to automatically end the strategy if max_draw is exceeded/
    strategy.entry("My Long Entry Id", strategy.long)

shortCondition = ta.crossunder(ta.sma(close, 14), ta.sma(close, 28))
if (shortCondition) and not end_strategy // Add 'and not end_strategy' to your order conditions to automatically end the strategy if max_draw is exceeded/
    strategy.entry("My Short Entry Id", strategy.short)
- Multi-Dimensional Trend Analysis with ATR-Based Dynamic Stop Management Strategy
- Adaptive Bollinger Bands Mean-Reversion Trading Strategy
- Advanced Multi-Indicator Trend Confirmation Trading Strategy
- Dual Moving Average-RSI Multi-Signal Trend Trading Strategy
- Adaptive Trend Following and Multi-Confirmation Trading Strategy
- Dynamic Stop-Loss Adjustment Elephant Bar Trend Following Strategy
- Dynamic RSI Quantitative Trading Strategy with Multiple Moving Average Crossover
- Multi-Dimensional KNN Algorithm with Volume-Price Candlestick Pattern Trading Strategy
- SMA-Based Intelligent Trailing Stop Strategy with Intraday Pattern Recognition
- Adaptive Multi-Strategy Dynamic Switching System: A Quantitative Trading Strategy Combining Trend Following and Range Oscillation
- Advanced Multi-Indicator Multi-Dimensional Trend Cross Quantitative Strategy
- High-Precision RSI and Bollinger Bands Breakout Strategy with Optimized Risk-Reward Ratio
- Advanced EMA Crossover Strategy: Adaptive Trading System with Dynamic Stop-Loss and Take-Profit Targets
- EMA Crossover with Dual Take Profit and Stop Loss Strategy
- Multi-Timeframe Hull Moving Average Crossover Strategy
- Dynamic Trailing Stop Dual Target Moving Average Crossover Strategy
- Dynamic Adaptive Momentum Breakout Strategy
- Adaptive Moving Average Crossover with Trailing Stop-Loss Strategy
- EMA Trend-Following Automated Trading Strategy
- Darvas Box Breakout and Risk Management Strategy
- Multi-Timeframe Exponential Moving Average Crossover Strategy with Risk-Reward Optimization
- High-Frequency Flip Percentage Tracking Momentum Strategy
- SMI and Pivot Point Momentum Crossover Strategy
- Support and Resistance Strategy with Dynamic Risk Management System
- RSI-Bollinger Bands Integration Strategy: A Dynamic Self-Adaptive Multi-Indicator Trading System
- Multi-Timeframe Trend Following and Order Block Quantitative Trading Strategy
- Technical Support and Resistance Indicator Precision Trading Strategy
- Multi-Moving Average Crossover Trend Following Strategy with Volatility Filter
- MACD Crossover Momentum Strategy with Dynamic Take Profit and Stop Loss Optimization
- Big Red Candle Breakout Buy Strategy
- Adaptive Multi-Moving Average Crossover Dynamic Trading Strategy