Magic Channel Price Action Trading Strategy
Author: ChaoZhang, Date: 2024-07-29 16:53:37Tags: MAEMAATR
Overview
The Magic Channel Price Action Trading Strategy is an advanced technical analysis method that combines classic channel analysis with modern indicator techniques. This strategy utilizes historical price data and moving averages to calculate key price levels, forming a dynamic trading channel. By analyzing the interaction between price and these channel levels, the strategy can generate precise buy and sell signals. Additionally, the strategy incorporates automatic stop-loss and take-profit functionality for effective risk management. The strategy’s visualization components include price channel display, trade signal markers, and color-coded trading zones, all of which help traders quickly identify potential trading opportunities.
Strategy Principles
The core of the Magic Channel strategy is to construct dynamic price channels by calculating price data over multiple time periods. Specifically:
- Conversion Line: Calculated using short-term price data, reflecting short-term market trends.
- Base Line: Calculated using medium-term price data, representing medium-term market trends.
- Leading Span 1: Derived from the average of the Conversion and Base Lines, displaced forward by a certain period to predict future support/resistance levels.
- Leading Span 2: Calculated using longer-term price data, also displaced forward, forming a price channel together with Leading Span 1.
The buy conditions for the strategy are: - Closing price is above the displaced Leading Span 2 - Displaced Leading Span 1 is above displaced Leading Span 2 - Closing price breaks above the Base Line
Sell conditions are the opposite: - Closing price is below the displaced Leading Span 1 - Displaced Leading Span 1 is below displaced Leading Span 2 - Closing price breaks below the Base Line
The strategy also manages risk and locks in profits by setting percentage-based stop-loss and take-profit levels. Furthermore, the strategy’s visualization includes plotting various channel lines, marking buy and sell signals, and using background colors to highlight different trading zones.
Strategy Advantages
Multi-dimensional Analysis: By considering price data across multiple time periods, the strategy can capture market dynamics more comprehensively, reducing false signals.
Dynamic Adaptation: The price channels continuously adjust based on the latest market data, allowing the strategy to adapt to different market environments.
Clear Trading Signals: With well-defined buy and sell conditions, combined with visualized signal markers, trading decisions become intuitive and straightforward.
Built-in Risk Management: Automatically set stop-loss and take-profit orders help control risk and protect profits.
Highly Visual: Through color coding and graphical markers, traders can quickly understand current market conditions and potential opportunities.
Flexibility: Strategy parameters can be optimized and adjusted for different trading instruments and timeframes.
Trend Following Capability: By analyzing the relationship between price and different channel lines, the strategy can effectively capture market trends.
Sentiment Indicator: The formation of channels and price position within them can reflect market sentiment, providing additional reference for trading decisions.
Strategy Risks
Overtrading: In ranging markets, price may frequently break channel lines, leading to excessive trading signals and potential losses.
Lag: Due to the use of moving averages and displacement, the strategy may not react quickly enough in rapidly changing markets.
False Breakouts: Market noise can lead to short-term false breakouts, triggering unnecessary trades.
Parameter Sensitivity: The strategy’s performance is highly dependent on chosen parameters; inappropriate parameter settings may cause strategy failure.
Drawdown Risk: During strong trend reversals, the strategy may not exit positions in time, leading to significant drawdowns.
Over-reliance on Technical Indicators: Ignoring fundamental and macroeconomic factors may lead to incorrect decisions during important events.
Liquidity Risk: In less liquid markets, it may be difficult to execute trades at ideal prices, affecting strategy performance.
To mitigate these risks, consider: - Combining other technical indicators or fundamental analysis to filter trading signals - Optimizing parameter selection, considering using adaptive parameters - Implementing stricter risk management measures, such as dynamically adjusting position sizes - Pausing trading before important economic data releases - Applying the strategy only in markets with sufficient liquidity
Strategy Optimization Directions
Adaptive Parameters: Consider introducing adaptive mechanisms to automatically adjust channel periods and displacement parameters based on market volatility. This can improve the strategy’s adaptability under different market conditions.
Multi-Timeframe Analysis: Integrate signals from multiple timeframes to increase the reliability of trading decisions. For example, require the trend direction of larger timeframes to align with trading signals.
Volatility Filter: Introduce the ATR (Average True Range) indicator to reduce or pause trading during low volatility periods, avoiding overtrading in ranging markets.
Dynamic Stop-Loss/Take-Profit: Dynamically set stop-loss and take-profit levels based on ATR or channel width, making risk management more flexible.
Trend Strength Filter: Add trend strength indicators like ADX (Average Directional Index) to open positions only in strong trend markets, improving the strategy’s win rate.
Sentiment Indicator Integration: Consider incorporating indicators like RSI (Relative Strength Index) or MACD (Moving Average Convergence/Divergence) to better assess overbought or oversold market conditions.
Machine Learning Optimization: Use machine learning algorithms to optimize parameter selection and signal generation, enhancing the strategy’s predictive accuracy.
Backtesting and Forward Testing: Conduct more comprehensive backtests across different markets and periods, and perform forward testing to verify the strategy’s robustness.
Capital Management Optimization: Implement more sophisticated capital management strategies, such as Kelly criterion-based position sizing, to optimize long-term returns.
Event-Driven Integration: Consider adjusting strategy behavior before important economic data releases, such as pausing trading or adjusting parameters.
These optimization directions aim to enhance the strategy’s adaptability, stability, and profitability while reducing potential risks. When implementing these optimizations, it’s crucial to carefully test the impact of each change on the overall performance of the strategy.
Conclusion
The Magic Channel Price Action Trading Strategy is a comprehensive technical analysis tool that provides traders with a powerful decision-making framework through dynamic price channels and clear trading rules. It combines traditional channel analysis techniques with modern risk management methods, capable of adapting to different market environments. The strategy’s strengths lie in its multi-dimensional analysis, clear signal generation, and built-in risk management mechanisms, making it a potentially effective trading tool.
However, like all trading strategies, it also faces some inherent risks, such as overtrading and parameter sensitivity issues. To fully leverage the strategy’s potential, traders need to deeply understand its principles, carefully select parameters, and continuously optimize in practical applications.
Through the proposed optimization directions, such as introducing adaptive parameters,multi-timeframe analysis, and machine learning techniques, the strategy has the potential to further enhance its performance. These optimizations not only can improve the strategy’s adaptability and robustness but may also open up new research directions, pushing forward the development of quantitative trading strategies.
Overall, the Magic Channel Price Action Trading Strategy provides traders with a structured approach to analyze and participate in the market. Through continuous research, testing, and optimization, it has the potential to become a valuable asset in a trader’s toolkit. However, users should always remember that there is no perfect strategy, and reasonable risk management and a continuous learning attitude remain key to successful trading.
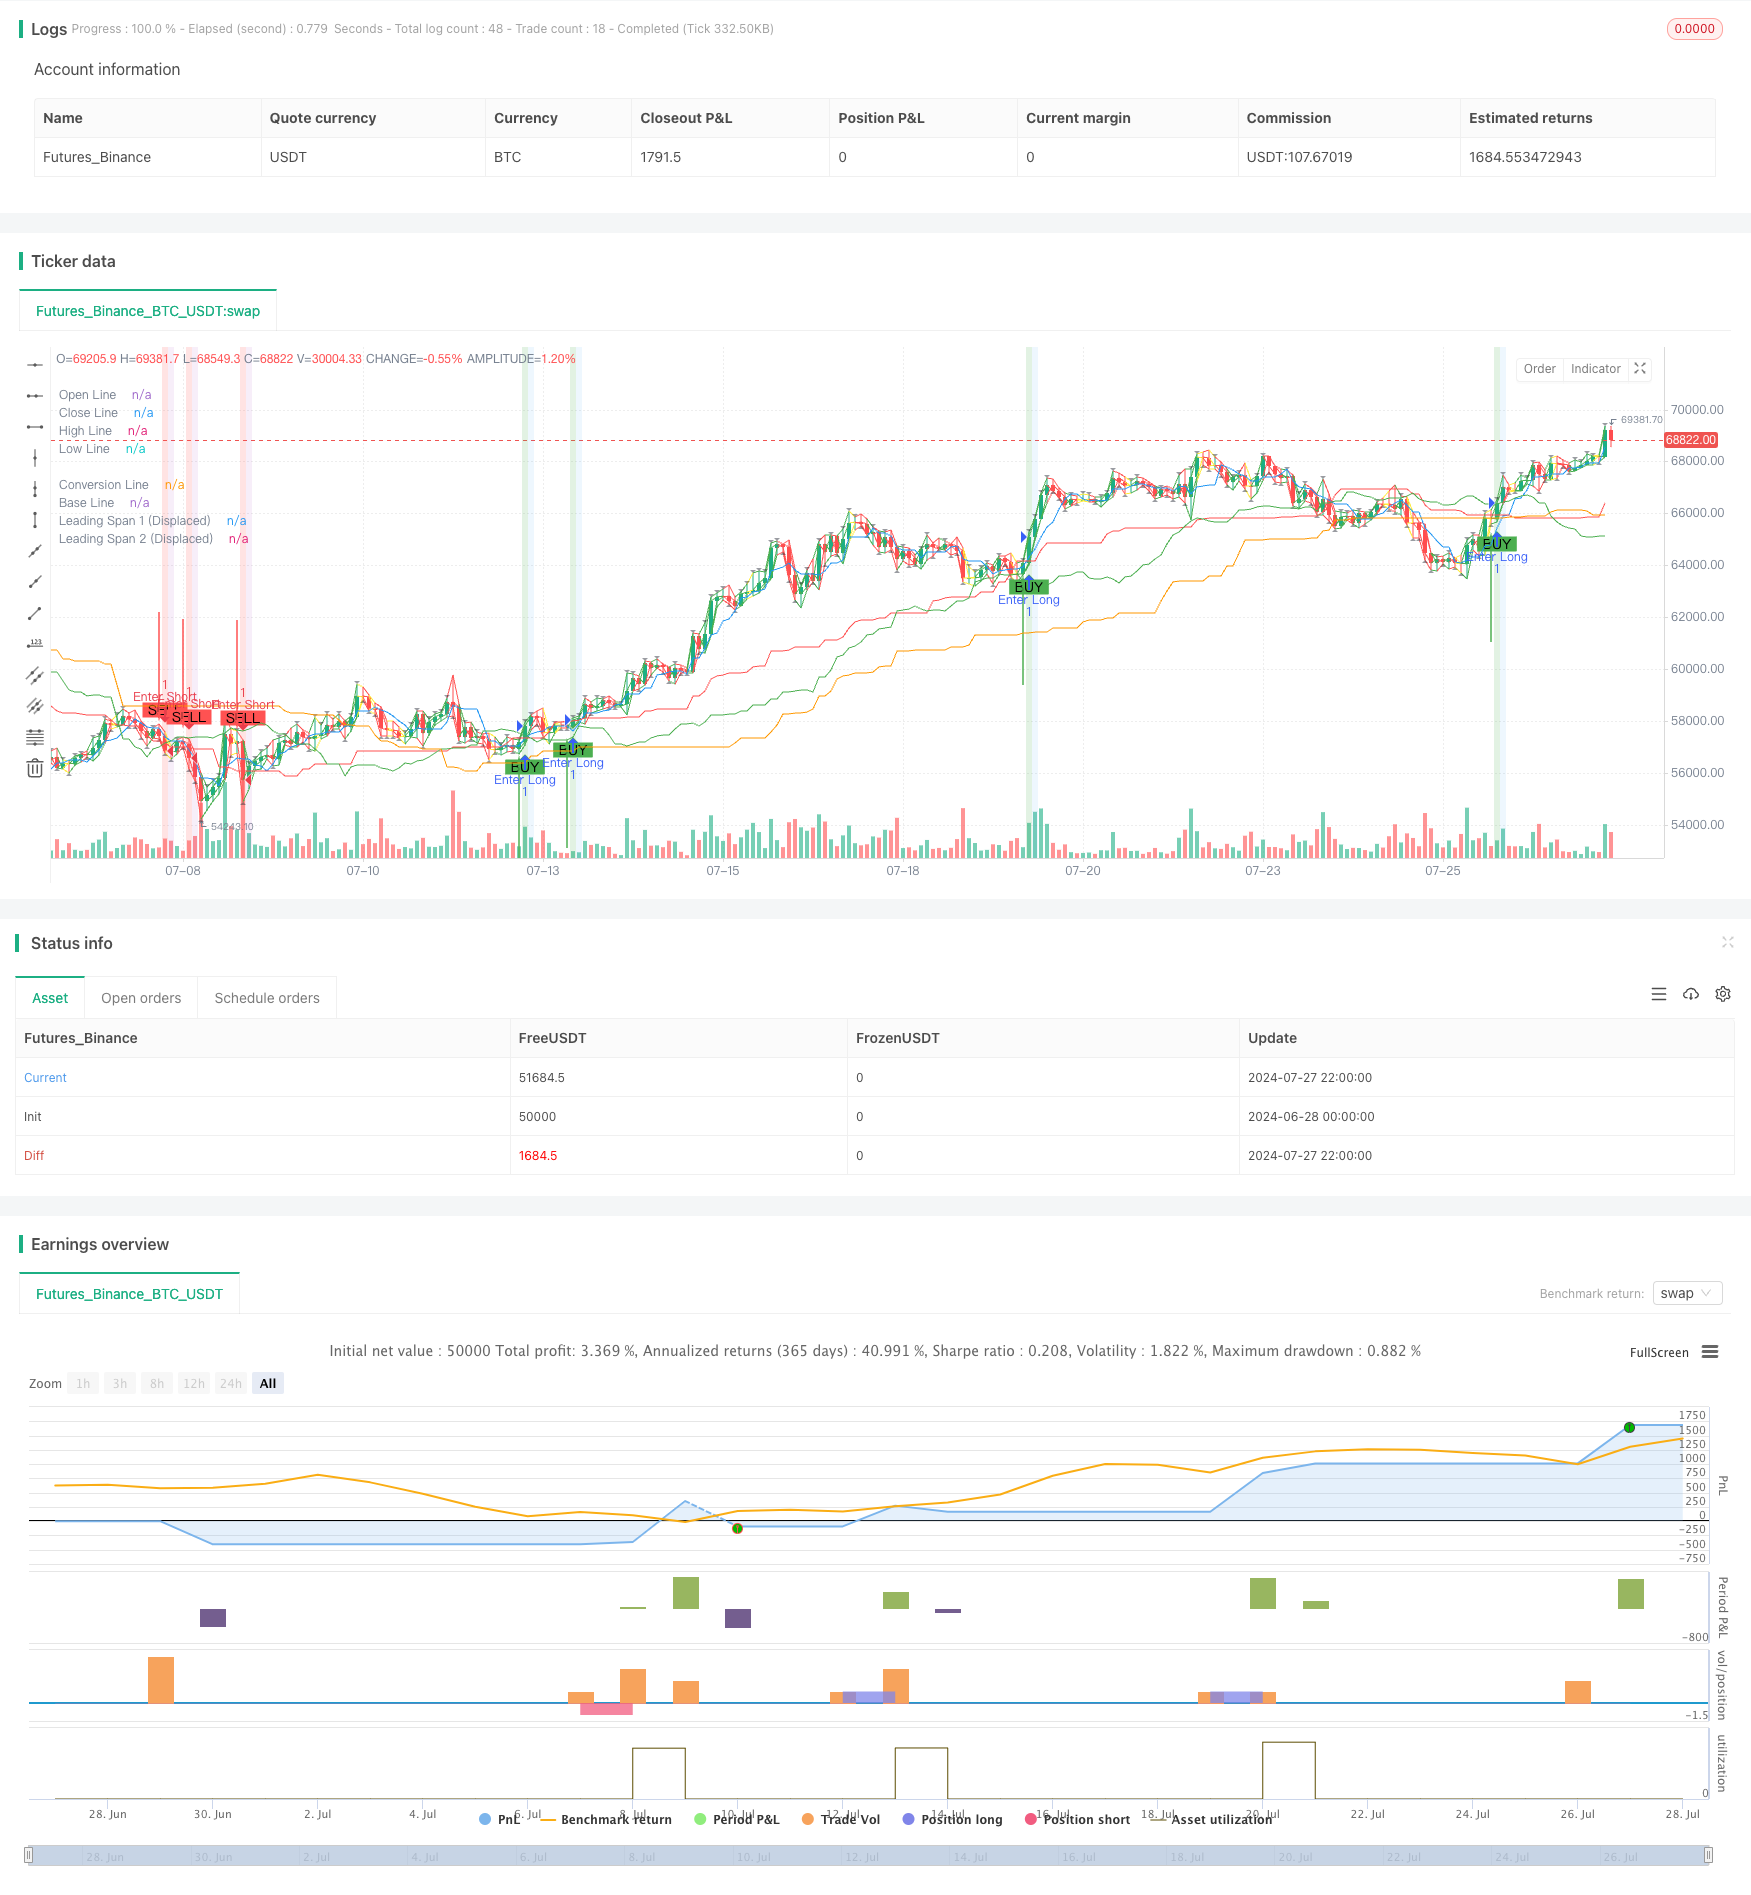
/*backtest
start: 2024-06-28 00:00:00
end: 2024-07-28 00:00:00
period: 2h
basePeriod: 15m
exchanges: [{"eid":"Futures_Binance","currency":"BTC_USDT"}]
*/

//@version=5
strategy("Magic Channel", shorttitle="Magic Channel", overlay=true)

// Magic channel settings with optimization options
conversionPeriod = input.int(5, title="Conversion Period", minval=1, maxval=20)
basePeriod = input.int(51, title="Base Period", minval=1, maxval=100)
laggingSpanPeriod = input.int(68, title="Lagging Span Period", minval=1, maxval=100)
displace = input.int(21, title="Displacement", minval=1, maxval=30)

// Stoploss and Take Profit settings with more granularity
stoplossPercent = input.float(0.1, title="Stoploss Percentage", minval=0.01) / 100
takeProfitPercent = input.float(0.1, title="Take Profit Percentage", minval=0.01) / 100

// Function definition for Magic channel calculation
computeMagicChannel(period) =>
    (ta.lowest(low, period) + ta.highest(high, period)) / 2

// Calculating the lines
convLine = computeMagicChannel(conversionPeriod)
baseLine = computeMagicChannel(basePeriod)
leadingSpan1 = (convLine + baseLine) / 2
leadingSpan2 = computeMagicChannel(laggingSpanPeriod)
displacedLead1 = leadingSpan1[displace]
displacedLead2 = leadingSpan2[displace]

// Defining entry signals
buyCondition = close > displacedLead2 and displacedLead1 > displacedLead2 and ta.crossover(close, baseLine)
sellCondition = close < displacedLead1 and displacedLead1 < displacedLead2 and ta.crossunder(close, baseLine)

// Executing strategy entries based on signals
if (buyCondition)
    strategy.entry("Enter Long", strategy.long)

if (sellCondition)
    strategy.entry("Enter Short", strategy.short)

// Stoploss and Take Profit conditions
stopLossLong = close * (1 - stoplossPercent)
stopLossShort = close * (1 + stoplossPercent)
takeProfitLong = close * (1 + takeProfitPercent)
takeProfitShort = close * (1 - takeProfitPercent)

// Apply stop-loss and take profit orders
if (strategy.position_size > 0)
    strategy.exit("Exit Long", from_entry="Enter Long", stop=stopLossLong, limit=takeProfitLong)

if (strategy.position_size < 0)
    strategy.exit("Exit Short", from_entry="Enter Short", stop=stopLossShort, limit=takeProfitShort)

// Plotting the Magic Channel lines on the chart
plot(convLine, color=color.blue, title="Conversion Line")
plot(baseLine, color=color.red, title="Base Line")
plot(displacedLead1, color=color.green, title="Leading Span 1 (Displaced)")
plot(displacedLead2, color=color.orange, title="Leading Span 2 (Displaced)")

// Highlighting buy and sell signals on the chart
plotshape(series=buyCondition, location=location.belowbar, color=color.green, style=shape.labelup, title="Buy Signal", text="BUY")
plotshape(series=sellCondition, location=location.abovebar, color=color.red, style=shape.labeldown, title="Sell Signal", text="SELL")

// Adding gradient background colors
bgcolor(buyCondition ? color.new(color.green, 80) : na, title="Buy Zone Background")
bgcolor(sellCondition ? color.new(color.red, 80) : na, title="Sell Zone Background")

// Fancy Candle Colors with Borders (Workaround)
bullishColor = color.new(color.green, 0)  // Bright green for bullish candles
bearishColor = color.new(color.red, 0)    // Bright red for bearish candles
dojiColor = color.new(color.yellow, 0)    // Yellow for doji candles
borderColor = color.new(color.black, 50)  // Semi-transparent black for borders

isBullish = close > open
isBearish = close < open
isDoji = math.abs(close - open) < (high - low) * 0.1

candleColor = isDoji ? dojiColor : (isBullish ? bullishColor : bearishColor)

// Plotting Candles
plot(open, color=candleColor, style=plot.style_linebr, linewidth=1, title="Open Line")
plot(close, color=candleColor, style=plot.style_linebr, linewidth=1, title="Close Line")
plot(high, color=candleColor, style=plot.style_linebr, linewidth=1, title="High Line")
plot(low, color=candleColor, style=plot.style_linebr, linewidth=1, title="Low Line")

// Draw borders and candle bodies using plotshape
plotshape(series=isBullish ? high : na, location=location.absolute, color=borderColor, style=shape.triangledown, size=size.small, title="Bullish Border")
plotshape(series=isBearish ? low : na, location=location.absolute, color=borderColor, style=shape.triangleup, size=size.small, title="Bearish Border")

// Trend Arrows
plotarrow(series=buyCondition ? 1 : sellCondition ? -1 : na, colorup=color.green, colordown=color.red, offset=-1, title="Trend Arrows")

// Optional: Overlay Background color based on overall trend or conditions
bgcolor(strategy.position_size > 0 ? color.new(color.blue, 90) : na, title="Long Position Background")
bgcolor(strategy.position_size < 0 ? color.new(color.purple, 90) : na, title="Short Position Background")

// Enhanced Alerts
alertcondition(buyCondition, title="Buy Alert", message="Buy signal detected at {{ticker}} on {{time}}. Conditions met: Close > Displaced Lead 2, Displaced Lead 1 > Displaced Lead 2, Close crossover Base Line.")
alertcondition(sellCondition, title="Sell Alert", message="Sell signal detected at {{ticker}} on {{time}}. Conditions met: Close < Displaced Lead 1, Displaced Lead 1 < Displaced Lead 2, Close crossunder Base Line.")
- Advanced Dual EMA Strategy with ATR Volatility Filter System
- Dynamic Trend Following ATR Multi-Period Trading Strategy
- Triple Bottom Rebound Momentum Breakthrough Strategy
- AlphaTradingBot Trading Strategy
- Dual EMA Pullback Trading System with ATR-Based Dynamic Stop-Loss Optimization
- Dynamic Moving Average Crossover Trend Following Strategy with ATR Risk Management System
- Enhanced Price-Volume Trend Momentum Strategy
- Multi-Indicator Fusion Mean Reversion Trend Following Strategy
- Dual EMA Trend Momentum Trading Strategy
- MACD-V and Fibonacci Multi-Timeframe Dynamic Take Profit Strategy
- Advanced Mean Reversion Trading Strategy: Dynamic Range Breakout System Based on Standard Deviation
- EMA Crossover with Bollinger Bands Double Entry Strategy: A Quantitative Trading System Combining Trend Following and Volatility Breakout
- Adaptive Trend-Following Trading Strategy: 200 EMA Breakout with Dynamic Risk Management System
- Multi-Timeframe Market Momentum Crossover Strategy
- Multi-Indicator Trend Following Strategy
- ChandelierExit-EMA Dynamic Stop-Loss Trend-Following Strategy
- Multi-Indicator Divergence Trading Strategy with Adaptive Take Profit and Stop Loss
- Breakout Zone Momentum Trading Strategy
- Precision Trading Strategy and Risk Management System Based on SuperTrend Indicator
- EMA, RSI, Volume-Price Trend, Engulfing Pattern
- Multi-Indicator Options Trading Strategy
- Dual Moving Average Mean Reversion Strategy with Risk Control
- Dual Moving Average Trend Following Strategy with RSI Filter
- Multi-EMA Crossover with Fibonacci Extension Trend Following Strategy
- Multi-EMA Crossover Stop Strategy
- Adaptive Momentum Trading Strategy with SMA Crossover and SuperTrend
- Weighted Moving Average and Relative Strength Index Crossover Strategy with Risk Management Optimization System
- Double-Smoothed Heiken Ashi Trend Following Strategy
- RSI Reversal Cross Momentum Profit Target Quantitative Trading Strategy
- Multi-Indicator Adaptive Trend Following Strategy