Dynamic Trend Following Strategy - Multi-Indicator Integrated Momentum Analysis System
Author: ChaoZhang, Date: 2024-07-30 12:16:32Tags: MARSIADXSMASLTP
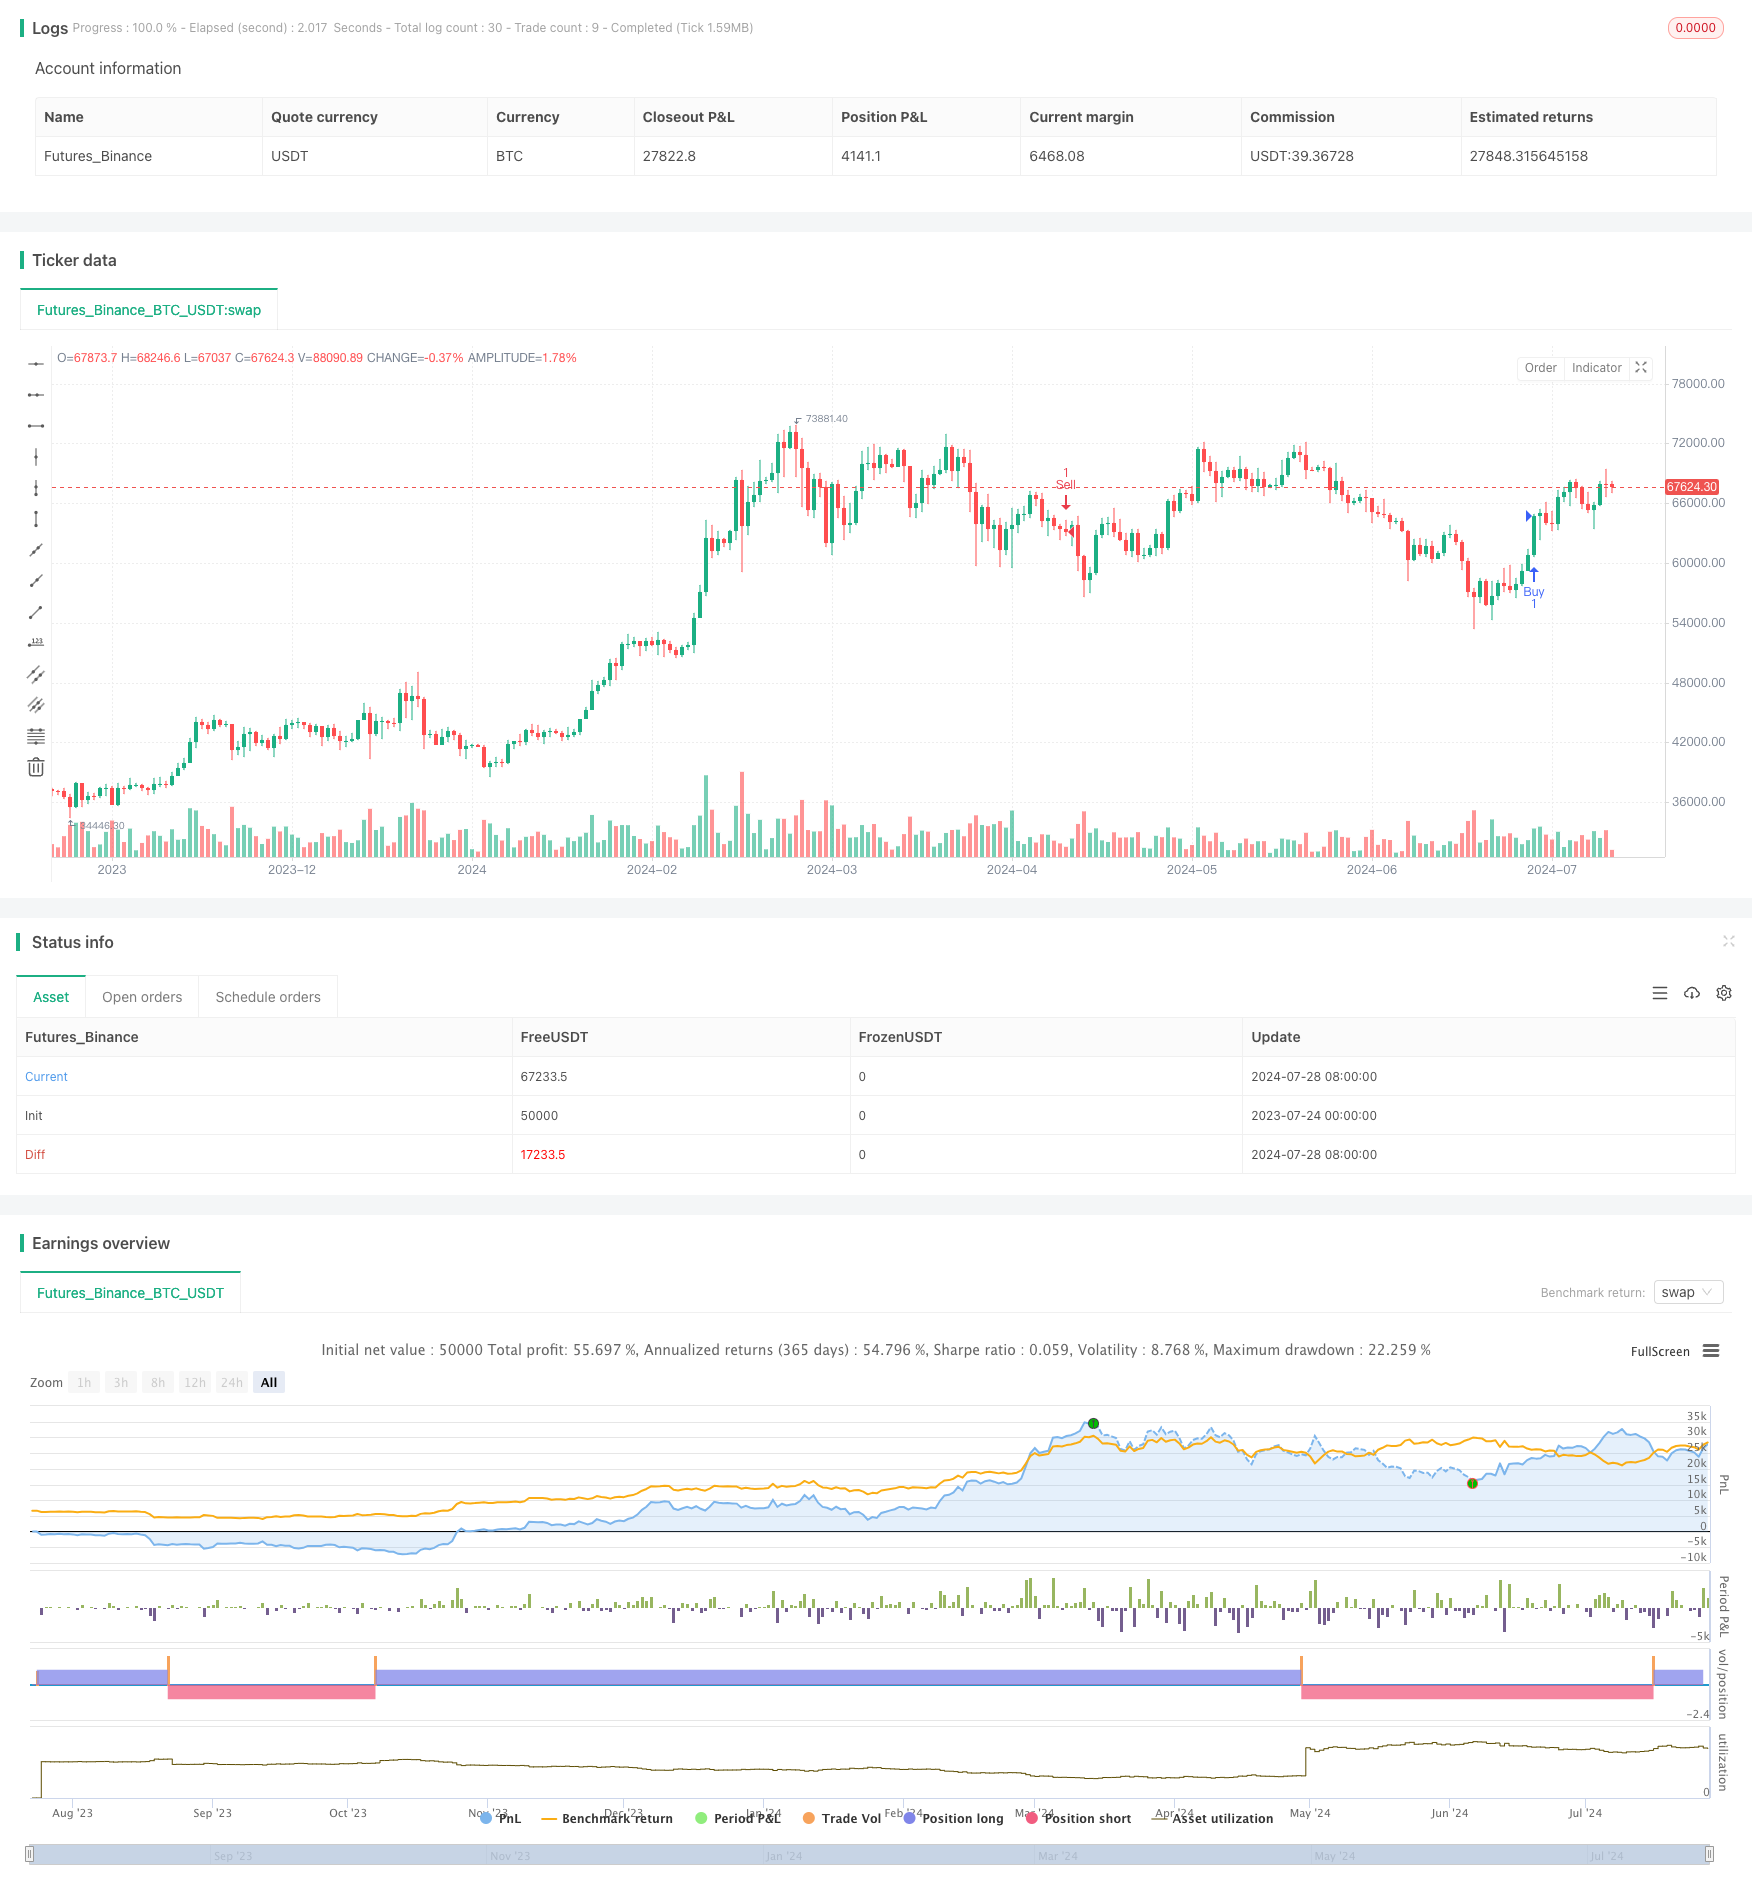
Overview
This strategy is a dynamic trend following system that combines multiple technical indicators. It primarily uses Moving Average (MA), Relative Strength Index (RSI), and Average Directional Index (ADX) to capture market trends, while managing risk through stop-loss and take-profit levels. The strategy aims to identify strong market trends and execute trades as trends develop.
Strategy Principles
Moving Average (MA): Uses a 20-period Simple Moving Average (SMA) as the primary indicator for trend direction. When the price is above the MA, it’s considered an uptrend; otherwise, a downtrend.
Relative Strength Index (RSI): Employs a 14-period RSI to measure market overbought or oversold conditions. Although not directly used for trade decisions in the code, it provides a foundation for future optimization.
Average Directional Index (ADX): Utilizes a 14-period ADX to measure trend strength. When ADX is above 20, it indicates a strong trend, and the strategy considers entry.
Trade Signals:
- Long condition: Price above MA and ADX greater than 20
- Short condition: Price below MA and ADX greater than 20
Risk Management:
- Stop loss set at 150 pips
- Take profit set at 300 pips
- Position size for each trade is 0.1 lot
Strategy Advantages
Multi-indicator Comprehensive Analysis: Combines MA, RSI, and ADX to consider trend direction, market momentum, and trend strength comprehensively, increasing the reliability of trading signals.
Dynamic Market Adaptation: Filters strong trends using ADX, avoiding frequent trading in choppy markets and reducing losses from false breakouts.
Risk Control Mechanism: Sets fixed stop-loss and take-profit levels, effectively controlling risk exposure for each trade and preventing excessive losses from single trades.
Flexible Parameter Settings: Key parameters such as MA period and ADX threshold can be adjusted for different market environments, increasing strategy adaptability.
Clear and Concise Trading Logic: Entry and exit conditions are clear, easy to understand and execute, reducing errors from subjective judgment.
Strategy Risks
Trend Reversal Risk: In strong trends, sudden market reversals may lead to significant losses. Consider adding trend reversal indicators to mitigate this risk.
Overtrading Risk: The low ADX threshold (20) may lead to frequent trading even in weak trends. Recommend adjusting the ADX threshold based on backtesting results.
Limitations of Fixed Stop-Loss and Take-Profit: Fixed levels may not be flexible enough for different market volatilities. Consider using dynamic stop-loss and take-profit strategies.
Single Timeframe Limitation: Relying on indicators from a single timeframe may overlook larger trends. Recommend introducing multi-timeframe analysis.
Lack of Market Environment Filtering: No distinction between different market states (e.g., trending, ranging), which may generate false signals in unsuitable market environments.
Optimization Directions
Incorporate RSI Filtering: Utilize the already calculated RSI indicator to add extra entry confirmation in extreme overbought or oversold areas, improving trade quality.
Dynamic Stop-Loss and Take-Profit: Consider using Average True Range (ATR) to set dynamic stop-loss and take-profit levels, better adapting to market volatility.
Multi-Timeframe Analysis: Add trend confirmation on longer timeframes, such as confirming trend direction on daily charts before seeking entry opportunities on smaller timeframes.
Market Environment Classification: Introduce volatility indicators (like ATR) to distinguish between high and low volatility environments, using different trading parameters for each.
Optimize ADX Usage: Consider using the rate of change of ADX, not just its absolute level, to potentially capture trend formation and decay earlier.
Add Volume Analysis: Consider volume factors when generating trading signals to ensure trends have sufficient market participation.
Parameter Optimization: Conduct systematic optimization tests on key parameters like MA period and ADX threshold to find the best parameter combinations for different market environments.
Conclusion
This dynamic trend following strategy aims to capture strong market trends by integrating multiple technical indicators. Its core strength lies in combining judgments of trend direction (MA) and trend strength (ADX), while leaving room for future optimization with momentum analysis (RSI). The strategy’s risk management mechanism helps control single trade risk, but there’s still room for improvement.
By introducing multi-timeframe analysis, dynamic stop-loss and take-profit, and market environment classification, this strategy has the potential to become a more robust and adaptive trading system. However, any trading strategy requires rigorous backtesting and live market validation, with continuous adjustment and optimization based on actual performance. Traders using this strategy should fully understand its principles and risks, and decide whether to adopt it based on their risk tolerance and trading objectives.
/*backtest
start: 2023-07-24 00:00:00
end: 2024-07-29 00:00:00
period: 1d
basePeriod: 1h
exchanges: [{"eid":"Futures_Binance","currency":"BTC_USDT"}]
*/

//@version=5
strategy("TrendFollower", overlay=true)

input_ma_period = input.int(50, title="MA Period")
input_rsi_period = input.int(14, title="RSI Period")
input_lot_size = input.float(1, title="Lot Size")
input_stop_loss_pips = input.float(300, title="Stop Loss (Pips)")
input_take_profit_pips = input.float(600, title="Take Profit (Pips)")
input_adx_period = input.int(14, title="ADX Period")
input_adx_threshold = input.float(25.0, title="ADX Threshold")

// Calculate Indicators
ma = ta.sma(close, input_ma_period)
rsi = ta.rsi(close, input_rsi_period)

// Calculate ADX manually
adx_smoothing = input.int(14, title="ADX Smoothing")
[plus_di, minus_di, adx_line] = ta.dmi(input_adx_period, adx_smoothing)

// Calculate Stop Loss and Take Profit in terms of price
stop_loss = input_stop_loss_pips * syminfo.pointvalue
take_profit = input_take_profit_pips * syminfo.pointvalue

// Define trade logic
long_condition = close > ma and adx_line > input_adx_threshold
short_condition = close < ma and adx_line > input_adx_threshold

// Execute trades
if (long_condition)
    strategy.entry("Buy", strategy.long, qty=input_lot_size, stop=close - stop_loss, limit=close + take_profit)
if (short_condition)
    strategy.entry("Sell", strategy.short, qty=input_lot_size, stop=close + stop_loss, limit=close - take_profit)
- Multi-Period Technical Indicator Dynamic Trading System Strategy
- Moving Average Crossover with RSI Trend Momentum Tracking Strategy
- Dual Moving Average-RSI Synergy Options Quantitative Trading Strategy
- Trend Following RSI and Moving Average Combined Quantitative Trading Strategy
- Smooth Moving Average Stop Loss & Take Profit Strategy with Trend Filter and Exception Exit
- Multi-Smoothed Moving Average Dynamic Crossover Trend Following Strategy with Multiple Confirmations
- Volume-based Dynamic DCA Strategy
- Trend Breakout Trading System with Moving Average (TBMA Strategy)
- Adaptive Quantitative Trading Strategy with Dual Moving Average Crossover and Take Profit/Stop Loss
- Dynamic Trailing Stop Dual Target Moving Average Crossover Strategy
- Adaptive Standard Deviation Breakout Trading Strategy: Multi-Period Optimization System Based on Dynamic Volatility
- Dynamic Position Dual Moving Average Crossover Strategy
- Dynamic Signal Line Trend Following Strategy Combining ATR and Volume
- Multi-Indicator Dynamic Volatility Alert Trading System
- Dynamic Trend-Following Trading Strategy Based on Gann Angles
- VWAP-ATR Trend Following and Price Reversal Strategy
- Bollinger Bands RSI Neutral Market Quantitative Trading Strategy
- Multi-Level Oversold Oscillator Buy Strategy
- Adaptive Trend Following Strategy Combining AlphaTrend and KAMA with Risk Management
- Dual Indicator Cross-Confirmation Momentum Volume Quantitative Trading Strategy
- Multi-EMA and Supertrend Crossover Strategy
- Dynamic Mean Reversion and Momentum Strategy
- Dual EMA Dynamic Trend Capture Trading System
- Multi-Confirmation Reversal Buy Strategy
- Enhanced Dual EMA Pullback Breakout Trading Strategy
- Multi-Timeframe Exponential Moving Average Crossover Strategy
- Multi-Period Dynamic Channel Crossover Strategy
- Comprehensive Price Gap Short-Term Trend Capture Strategy
- Multi-Stochastic Oscillation and Momentum Analysis System
- Multi-Timeframe Moving Average and RSI Trend Trading Strategy