Multi-Level Oversold Oscillator Buy Strategy
Author: ChaoZhang, Date: 2024-07-30 15:45:44Tags: RSIDCA
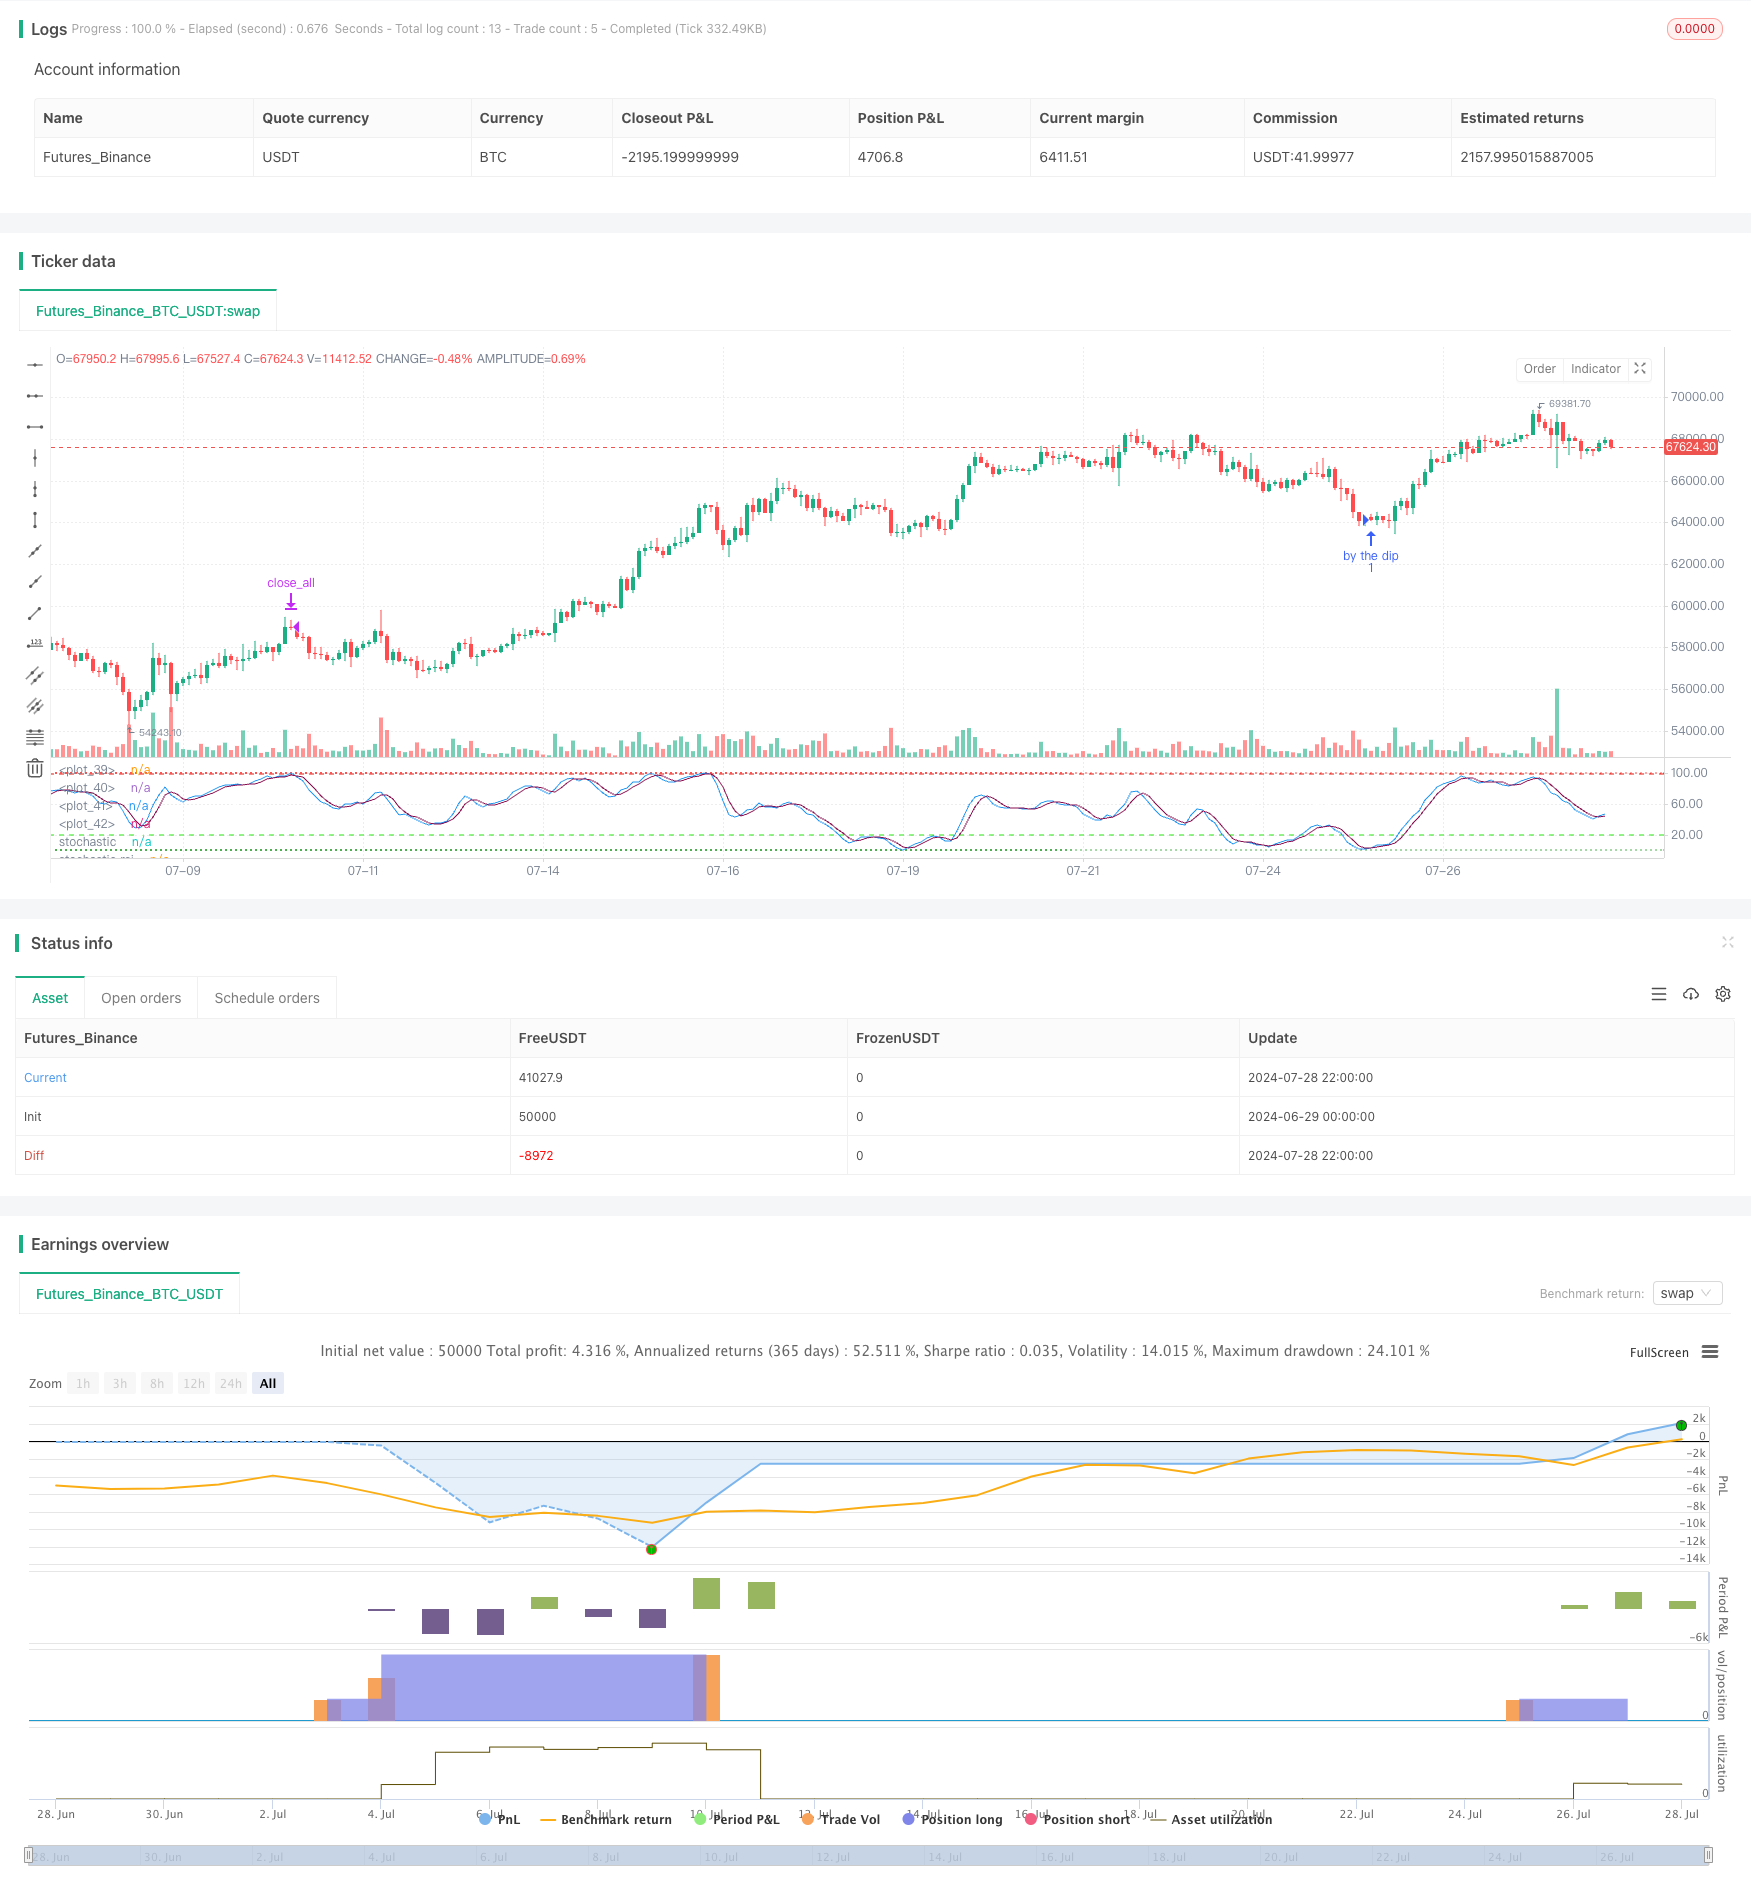
Overview
The Multi-Level Oversold Oscillator Buy Strategy is a long-only trading system designed specifically for bullish market environments. This strategy utilizes a combination of the Stochastic Oscillator and the Stochastic Relative Strength Index (Stochastic RSI) to identify optimal buying opportunities during market corrections. The strategy employs a three-level pyramiding approach to emulate the effects of Dollar Cost Averaging (DCA), aiming to capitalize on market pullbacks.
Strategy Principles
The core principle of this strategy is to “buy the dips” by identifying buy signals in oversold territory. Specifically:
- It uses a long-period (66) Stochastic Oscillator (K) and Stochastic RSI (Kr).
- Sets upwardly biased oversold (20) and overbought (99) lines to suit bullish markets.
- When both K and Kr fall below the oversold line (20), the strategy starts looking for buying opportunities.
- Under these conditions, a buy signal is triggered when the Kr line crosses above the D line.
- Implements a 3-level pyramiding approach, investing 20% of the account value each time.
- All positions are closed for profit when the Kr line reaches or exceeds the overbought line (99).
The strategy does not employ a stop-loss, reflecting strong confidence in the bullish trend.
Strategy Advantages
- Trend-following: Designed for bull markets, effectively utilizing pullbacks in uptrends.
- Multiple confirmations: Combines two indicators to increase the reliability of entry signals.
- Flexible position sizing: Three-level pyramiding approach lowers average cost while controlling risk.
- High adaptability: Can be adjusted to different market conditions through parameter tuning.
- Simplicity and clarity: Clear strategy logic that is easy to understand and execute.
- Automation-friendly: Concise code, easily implementable for automated trading.
Strategy Risks
False breakout risk: May trigger frequent false signals in choppy markets. Solution: Incorporate additional trend confirmation indicators, such as moving averages.
Over-leveraging risk: Continuous declines may lead to excessive positions. Solution: Set maximum position limits or dynamically adjust the pyramiding ratio.
Missing rebound risk: Strict entry conditions may cause missing quick rebounds. Solution: Consider adding more sensitive short-term indicators as supplements.
Lack of stop-loss mechanism: May incur significant losses during severe corrections. Solution: Introduce a volatility-based dynamic stop-loss mechanism.
Parameter sensitivity: Strategy performance may overly depend on parameter settings. Solution: Conduct comprehensive parameter optimization and backtesting.
Strategy Optimization Directions
Dynamic parameter adjustment: Automatically adjust Stochastic and RSI periods based on market volatility. Reason: Enhance strategy adaptability to different market environments.
Introduce trend filters: Add long-term moving averages for trend confirmation. Reason: Reduce false signals in choppy markets and improve entry quality.
Implement dynamic position sizing: Adjust each pyramiding ratio based on market volatility and account performance. Reason: Better risk control and improved capital efficiency.
Enhance profit-taking mechanism: Implement partial position reduction when Kr reaches overbought territory instead of full closure. Reason: Avoid missing extended trends and improve long-term returns.
Integrate market sentiment indicators: Such as VIX or fund flow indicators to optimize entry timing. Reason: Increase strategy sensitivity to macro market environments.
Conclusion
The Multi-Level Oversold Oscillator Buy Strategy is an ingeniously designed bull market trading system that effectively captures buying opportunities during market corrections by combining Stochastic and Stochastic RSI indicators. Its three-level pyramiding approach not only emulates the advantages of DCA strategy but also provides more flexible position management. While the strategy design leans towards optimism, it has the potential to become a robust long-term investment tool with proper risk management and continuous optimization. Future optimization should focus on enhancing the strategy’s adaptability and risk control capabilities to cope with various market environments. Overall, this is a promising trading strategy worthy of further research and improvement.
/*backtest
start: 2024-06-29 00:00:00
end: 2024-07-29 00:00:00
period: 2h
basePeriod: 15m
exchanges: [{"eid":"Futures_Binance","currency":"BTC_USDT"}]
*/

// This Pine Script™ code is subject to the terms of the Mozilla Public License 2.0 at https://mozilla.org/MPL/2.0/
// © aeperalta

//@version=5
strategy("Buy The Dips [aep]", overlay=false, pyramiding = 3)

//-------  strategy details ------------ {
// The strategy is to buy the dips by entering the market in the territory of oversold
// When both Stochastic (K) and Stochastic RSI (Kr) are below OS line is time to look for
// crossovers in the Stochastic RSI indicator and buy @ market
// Take profit will happend when Kr is way up near the 100% as Overbought territory
// Since we are buy dips of during bullmarkets, there is no stoploss
//}


// ------stochastics --------{
periodK = input.int(66, title="%K Length", minval=1)
smoothK = input.int(3, title="%K Smoothing", minval=1)
periodD = input.int(3, title="%D Smoothing", minval=1)

// classic stochastic
k = ta.sma(ta.stoch(close, high, low, periodK), smoothK)


// stochastic rsi
periodRSI = input(14)
rsi = ta.rsi(close,periodRSI)
kr = ta.sma(ta.stoch(rsi, rsi, rsi, periodK), smoothK)
d = ta.sma(kr, periodD)

// plots
OB = input.int(99, "Overbought")
OS = input.int(20, 'Oversold')

plot(k,'stochastic',color.white,2)
plot(kr, 'stochastic rsi', color.blue, 1)
plot(d, '%rsi D',color.maroon, 1 )

hline(OS, color = color.rgb(39, 230, 18), linestyle= hline.style_dashed)
hline(OB, color = color.rgb(229, 28, 18), linestyle= hline.style_dashed)
hline(100, color = color.red, linestyle= hline.style_dotted)
hline(0, color = color.green, linestyle= hline.style_dotted)

//}
// -------------- strategy excecution --------------- {

if  ta.crossover(kr, d) and kr < OS and k < OS
	strategy.entry("by the dip",strategy.long)
if kr >= OB
	strategy.close_all()

//}
- Multi-Indicator Intelligent Pyramiding Strategy
- Dynamic Cost Averaging Strategy System Based on Bollinger Bands and RSI
- Volume-based Dynamic DCA Strategy
- High-Frequency Reversal Trading Strategy Based on Momentum RSI Indicator
- RSI+Supertrend Trend-Following Trading Strategy
- RSI Dynamic Range Reversal Quantitative Strategy with Volatility Optimization Model
- RSI Momentum Divergence Breakout Strategy
- Relative Strength Index - Divergences - Libertus
- RSI Relative Strength Index Strategy
- RSI Direction Change Strategy
- Multi-Moving Average Trend Following and Reversal Pattern Recognition Strategy
- Advanced Composite Moving Average and Market Momentum Trend Capture Strategy
- Advanced Fibonacci Retracement and Volume-Weighted Price Action Trading Strategy
- Adaptive Standard Deviation Breakout Trading Strategy: Multi-Period Optimization System Based on Dynamic Volatility
- Dynamic Position Dual Moving Average Crossover Strategy
- Dynamic Signal Line Trend Following Strategy Combining ATR and Volume
- Multi-Indicator Dynamic Volatility Alert Trading System
- Dynamic Trend-Following Trading Strategy Based on Gann Angles
- VWAP-ATR Trend Following and Price Reversal Strategy
- Bollinger Bands RSI Neutral Market Quantitative Trading Strategy
- Adaptive Trend Following Strategy Combining AlphaTrend and KAMA with Risk Management
- Dual Indicator Cross-Confirmation Momentum Volume Quantitative Trading Strategy
- Dynamic Trend Following Strategy - Multi-Indicator Integrated Momentum Analysis System
- Multi-EMA and Supertrend Crossover Strategy
- Dynamic Mean Reversion and Momentum Strategy
- Dual EMA Dynamic Trend Capture Trading System
- Multi-Confirmation Reversal Buy Strategy
- Enhanced Dual EMA Pullback Breakout Trading Strategy
- Multi-Timeframe Exponential Moving Average Crossover Strategy
- Multi-Period Dynamic Channel Crossover Strategy