Advanced Fibonacci Retracement and Volume-Weighted Price Action Trading Strategy
Author: ChaoZhang, Date: 2024-07-30 16:13:37Tags: MAFIBONACCI
Overview
This strategy is an advanced trading system that combines Fibonacci retracement levels, price action patterns, and volume analysis. It utilizes Fibonacci retracement levels to identify key support and resistance areas, uses candlestick patterns such as pin bars and engulfing patterns to identify potential reversal points, and incorporates volume confirmation to enhance the reliability of trading signals. The strategy aims to capture high-probability trading opportunities within market trends while managing risk through multiple confirmation mechanisms.
Strategy Principles
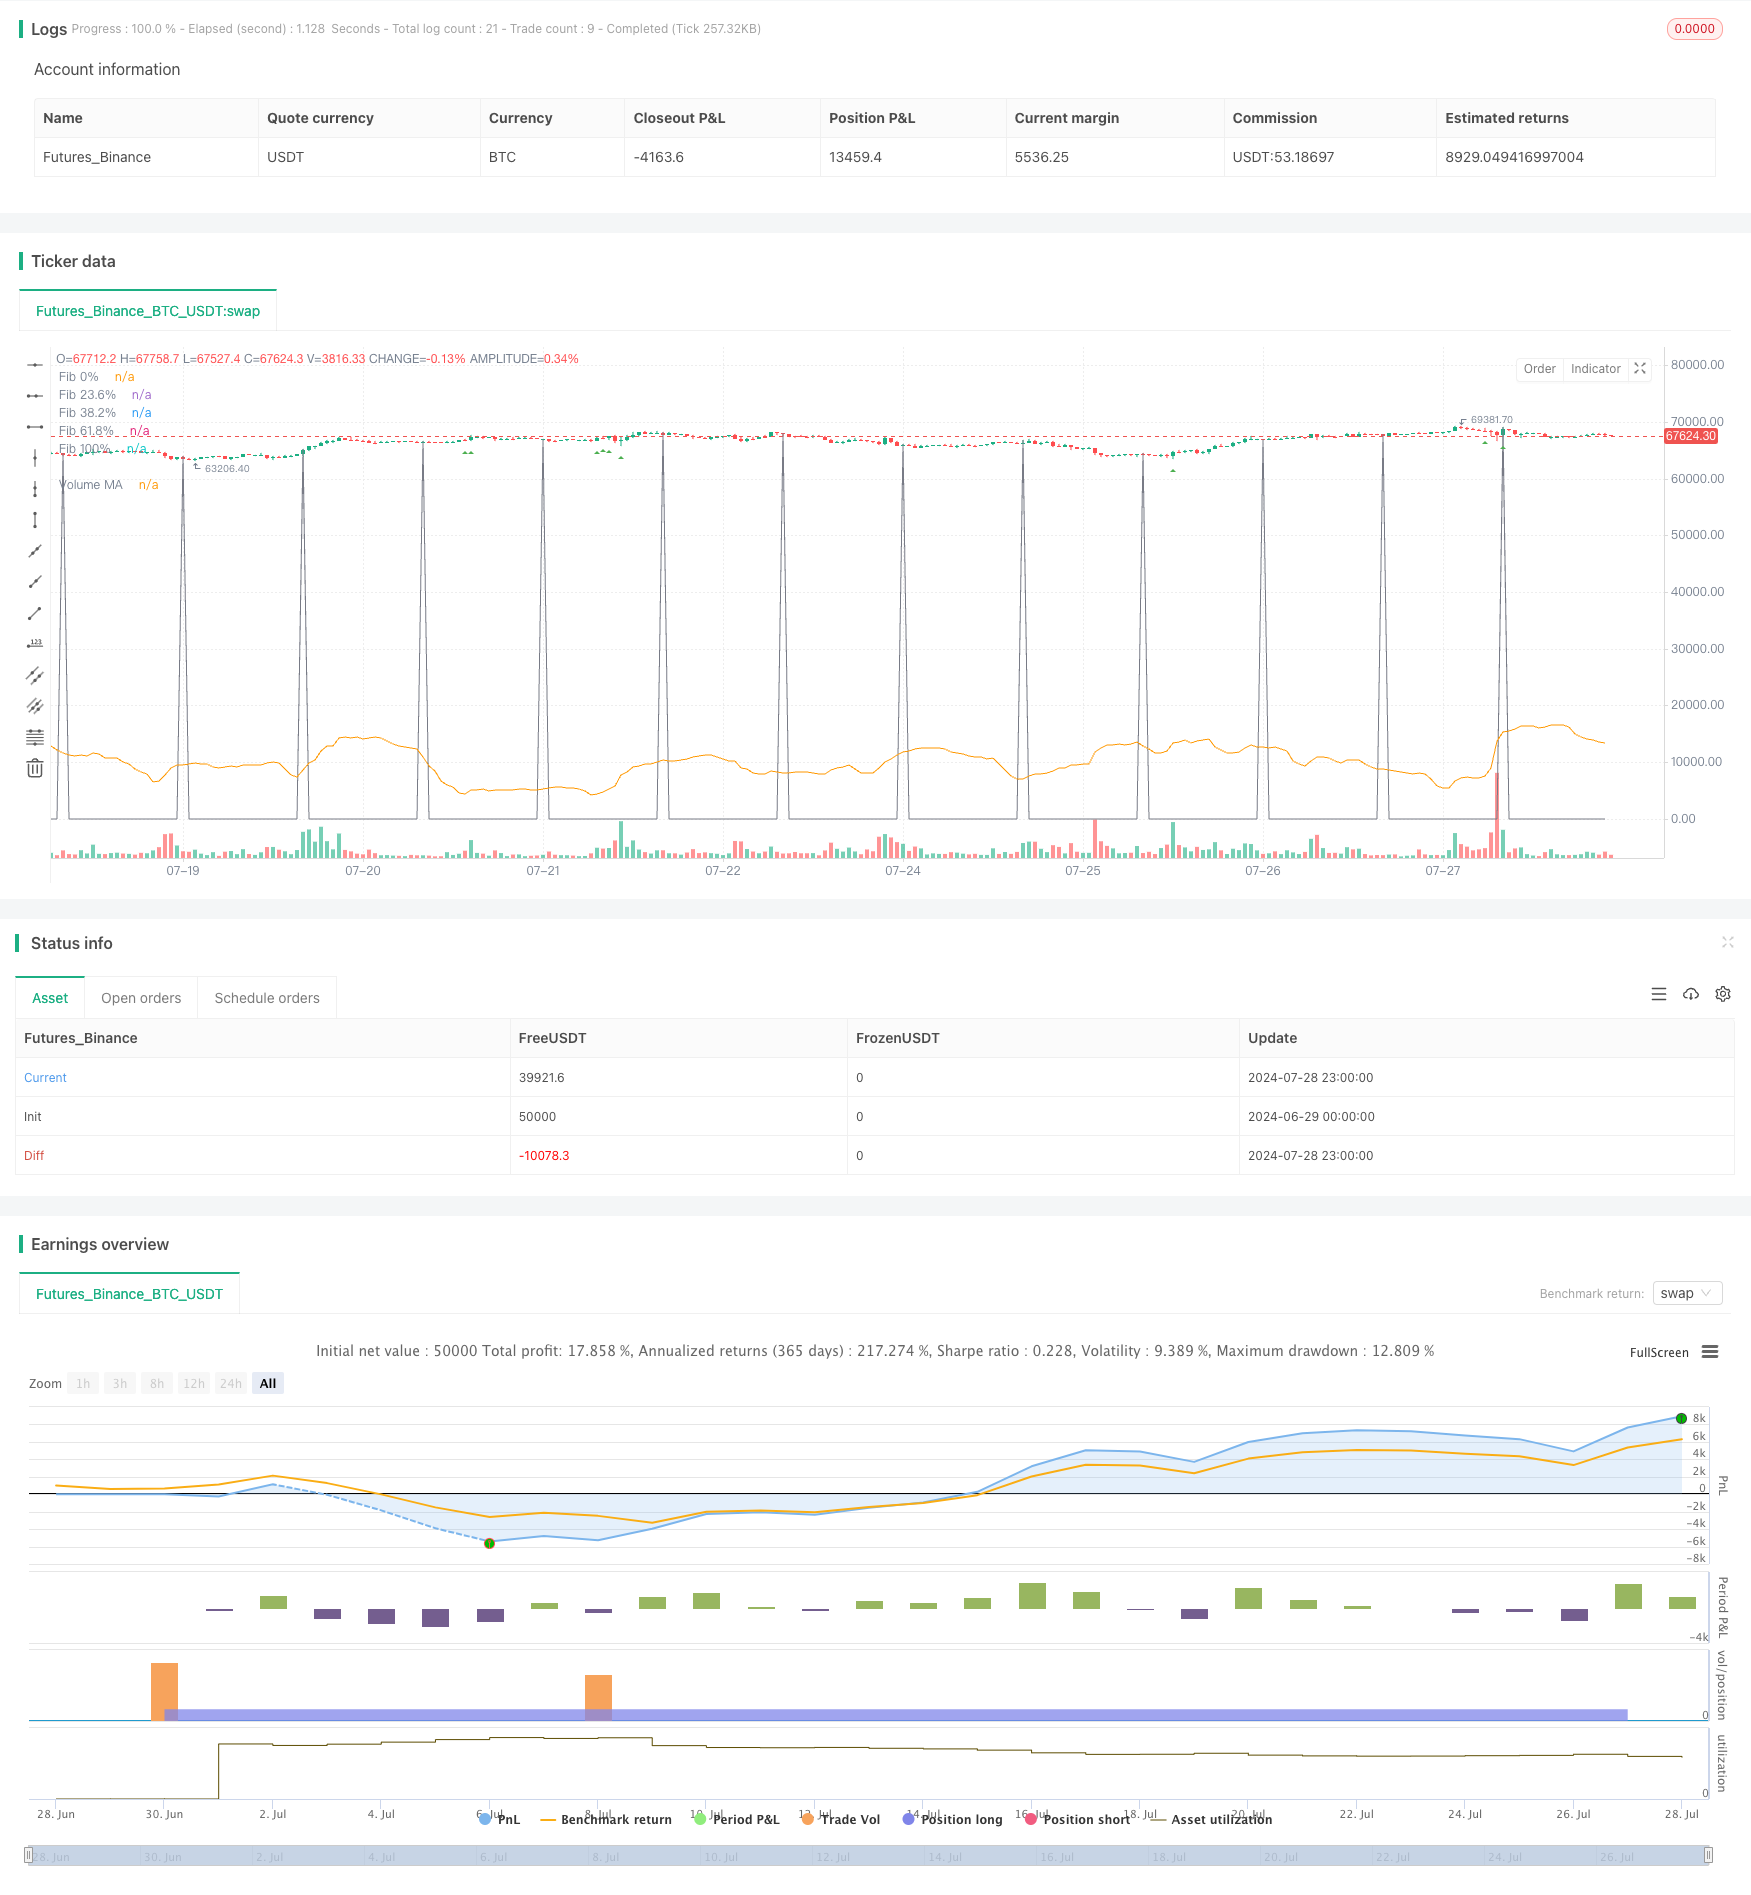
Fibonacci Retracement: The strategy uses 20-period high and low points to calculate Fibonacci retracement levels (0%, 23.6%, 38.2%, 61.8%, 100%). These levels are used to identify potential support and resistance areas.
Price Action Patterns:
- Pin Bar: Identified by comparing the candlestick body and wick lengths. A valid pin bar is recognized when the wick length is more than twice the body length.
- Engulfing Pattern: Identified by comparing the open and close prices of adjacent candles.
Volume Analysis: The strategy calculates a 20-period moving average of volume and requires the current volume to exceed 1.5 times this average to confirm the strength of trading signals.
Trading Logic:
- Long Entry: Bullish pin bar or bullish engulfing pattern occurs, price is above the 38.2% Fibonacci retracement level, and volume condition is met.
- Short Entry: Bearish pin bar or bearish engulfing pattern occurs, price is below the 38.2% Fibonacci retracement level, and volume condition is met.
Strategy Advantages
Multiple Confirmation Mechanism: Combines several important concepts in technical analysis (Fibonacci, price action, volume), increasing the reliability of trading signals.
High Adaptability: Fibonacci levels dynamically adjust to market fluctuations, allowing the strategy to adapt to different market environments.
Risk Management: Reduces the risk of false breakouts by requiring price to be above or below key Fibonacci levels and incorporating volume confirmation.
Combines Trend Following and Reversal: The strategy can capture both trend continuation opportunities (price above or below key levels) and identify potential reversal points (through price action patterns).
Visualization: Provides clear chart markings, including Fibonacci levels, trade signals, and volume moving average, allowing traders to intuitively understand market conditions.
Strategy Risks
Overtrading: In highly volatile markets, the strategy may generate too many trading signals, increasing transaction costs and potentially leading to overtrading.
Lagging Indicators: Using moving averages to calculate volume thresholds may result in lagging signals, missing opportunities in rapidly changing markets.
False Signals: Despite multiple confirmations, false signals may still occur in ranging markets or low volatility environments.
Parameter Sensitivity: Strategy performance may be sensitive to parameter settings such as Fibonacci length, volume MA length, and volume threshold.
Lack of Stop Loss Mechanism: The current strategy does not include explicit stop loss logic, which may lead to excessive losses in adverse market conditions.
Strategy Optimization Directions
Dynamic Parameter Adjustment: Implement adaptive adjustment of Fibonacci length, volume MA length, and volume threshold to suit different market conditions.
Add Trend Filter: Introduce additional trend indicators (such as moving averages or ADX) to avoid counter-trend trading in strong trends.
Improve Risk Management: Incorporate stop loss and take profit logic, such as dynamic stops based on ATR or using Fibonacci levels to set stop points.
Optimize Entry Timing: Consider setting limit orders near key Fibonacci levels to obtain better entry prices.
Incorporate Multiple Timeframe Analysis: Combine analysis from higher timeframes to improve the accuracy of trade direction.
Add Volatility Filter: Reduce trading frequency during low volatility periods to avoid trading in unsuitable market conditions.
Enhance Volume Analysis: Consider using more sophisticated volume indicators, such as OBV or Chaikin Money Flow, to more accurately assess volume trends.
Conclusion
This Advanced Fibonacci Retracement and Volume-Weighted Price Action Trading Strategy demonstrates the powerful potential of multi-factor analysis in quantitative trading. By combining Fibonacci retracement, price action patterns, and volume analysis, the strategy provides more reliable trading signals based on technical analysis. Its adaptability and multiple confirmation mechanisms are its main advantages, helping to identify high-probability trading opportunities in various market environments.
However, the strategy still has some potential risks, such as overtrading and parameter sensitivity. By implementing the suggested optimization measures, such as dynamic parameter adjustment, adding trend filters, and improving risk management, the strategy’s robustness and performance can be further enhanced.
Overall, this is a well-designed strategy framework with broad application prospects and optimization potential. For traders seeking to build more complex and reliable trading systems based on technical analysis, this strategy provides an extremely valuable starting point. Through continuous backtesting, optimization, and live trading validation, it has the potential to become a powerful trading tool.
/*backtest
start: 2024-06-29 00:00:00
end: 2024-07-29 00:00:00
period: 1h
basePeriod: 15m
exchanges: [{"eid":"Futures_Binance","currency":"BTC_USDT"}]
*/

//@version=5
strategy("Fibonacci and Price Action with Volume Strategy", overlay=true)

// Inputs for Fibonacci levels
fibLength = input.int(20, title="Fibonacci Length")
fibonacciLevels = array.new_float(5, 0)
var float fibHigh = na
var float fibLow = na

// Inputs for Volume
volumeMA_length = input.int(20, title="Volume MA Length")  // Moving average length for volume
volumeThreshold = input.float(1.5, title="Volume Threshold Multiplier")  // Multiplier for volume condition

// Calculate Fibonacci retracement levels
if (na(fibHigh) or na(fibLow))
    fibHigh := high
    fibLow := low

if (high > fibHigh)
    fibHigh := high
if (low < fibLow)
    fibLow := low

if (bar_index % fibLength == 0)
    fibHigh := high
    fibLow := low
    array.set(fibonacciLevels, 0, fibHigh)
    array.set(fibonacciLevels, 1, fibHigh - 0.236 * (fibHigh - fibLow))
    array.set(fibonacciLevels, 2, fibHigh - 0.382 * (fibHigh - fibLow))
    array.set(fibonacciLevels, 3, fibHigh - 0.618 * (fibHigh - fibLow))
    array.set(fibonacciLevels, 4, fibLow)

// Plot Fibonacci levels
plot(array.get(fibonacciLevels, 0), color=color.gray, linewidth=1, title="Fib 0%")
plot(array.get(fibonacciLevels, 1), color=color.gray, linewidth=1, title="Fib 23.6%")
plot(array.get(fibonacciLevels, 2), color=color.gray, linewidth=1, title="Fib 38.2%")
plot(array.get(fibonacciLevels, 3), color=color.gray, linewidth=1, title="Fib 61.8%")
plot(array.get(fibonacciLevels, 4), color=color.gray, linewidth=1, title="Fib 100%")

// Price Action Patterns
isPinBar(bullish) =>
    wickSize = bullish ? high - math.max(open, close) : math.min(open, close) - low
    bodySize = math.abs(close - open)
    wickSize > bodySize * 2

isBullishEngulfing() =>
    open[1] > close[1] and close > open and open <= close[1] and close >= open[1]

isBearishEngulfing() =>
    close[1] > open[1] and open > close and open >= close[1] and close <= open[1]

// Calculate Volume Moving Average
volumeMA = ta.sma(volume, volumeMA_length)
volumeCondition = volume > volumeThreshold * volumeMA

// Buy and Sell Conditions with Volume
longEntry = (isPinBar(true) or isBullishEngulfing()) and close > array.get(fibonacciLevels, 2) and volumeCondition
shortEntry = (isPinBar(false) or isBearishEngulfing()) and close < array.get(fibonacciLevels, 2) and volumeCondition

// Execute Trades
if (longEntry)
    strategy.entry("Buy", strategy.long)

if (shortEntry)
    strategy.entry("Sell", strategy.short)

// Plot buy and sell signals
plotshape(series=longEntry, title="Buy Signal", location=location.belowbar, color=color.green, style=shape.triangleup, size=size.small)
plotshape(series=shortEntry, title="Sell Signal", location=location.abovebar, color=color.red, style=shape.triangledown, size=size.small)

// Plot Volume MA
plot(volumeMA, title="Volume MA", color=color.orange, linewidth=1, style=plot.style_line)

// Plot Performance Metrics
// if (strategy.closedtrades > 0)
//     winRate = (strategy.wintrades / strategy.closedtrades) * 100
//     profitFactor = strategy.grossprofit / strategy.grossloss
//     label.new(bar_index, high, "Win Rate: " + str.tostring(winRate, "#.##") + "%\nProfit Factor: " + str.tostring(profitFactor, "#.##"),
//               color=color.new(color.blue, 80), style=label.style_label_down, size=size.small)
- MA, SMA, MA Slope, Trailing Stop Loss, Re-Entry
- Adaptive Multi-Level Trading Strategy Based on Fibonacci Retracement
- Adaptive Trend Following Strategy Based on Fibonacci Retracement
- Dual Timeframe Trend Reversal Candlestick Pattern Quantitative Trading Strategy
- Continuous Candle Based Dynamic Grid Adaptive Moving Average with Dynamic Stop Loss Strategy
- Cloud-Based Bollinger Bands Double Moving Average Quantitative Trend Strategy
- Moving Average Crossover Strategy Based on Dual Moving Averages
- Multi-Timeframe EMA Trend Strategy with Daily High-Low Breakout System
- Cross-Market Overnight Position Strategy with EMA Filter
- MA Cross Strategy
- Multi-Order Breakout Trend Following Strategy
- Multi-EMA Crossover with Time Interval Integration Strategy
- Dual Moving Average Crossover Confirmation Strategy with Volume-Price Integration Optimization Model
- Dual Dynamic Indicator Optimization Strategy
- VWAP Crossover Dynamic Profit Target Trading Strategy
- Bollinger Bands Breakout Quantitative Trading Strategy
- Fibonacci Extension and Retracement Channel Breakout Strategy
- Multi-Dimensional Order Flow Analysis and Trading Strategy
- Multi-Moving Average Trend Following and Reversal Pattern Recognition Strategy
- Advanced Composite Moving Average and Market Momentum Trend Capture Strategy
- Adaptive Standard Deviation Breakout Trading Strategy: Multi-Period Optimization System Based on Dynamic Volatility
- Dynamic Position Dual Moving Average Crossover Strategy
- Dynamic Signal Line Trend Following Strategy Combining ATR and Volume
- Multi-Indicator Dynamic Volatility Alert Trading System
- Dynamic Trend-Following Trading Strategy Based on Gann Angles
- VWAP-ATR Trend Following and Price Reversal Strategy
- Bollinger Bands RSI Neutral Market Quantitative Trading Strategy
- Multi-Level Oversold Oscillator Buy Strategy
- Adaptive Trend Following Strategy Combining AlphaTrend and KAMA with Risk Management
- Dual Indicator Cross-Confirmation Momentum Volume Quantitative Trading Strategy