概述
本策略是一个基于斐波那契回撤原理的趋势跟踪交易系统。它利用斐波那契水平来确定市场趋势和潜在的反转点,并根据这些水平来执行交易。策略的核心在于识别价格与关键斐波那契水平的交叉,以此作为入场和出场的信号。同时,策略还融入了动态的止盈止损机制,以管理风险并锁定利润。
策略原理
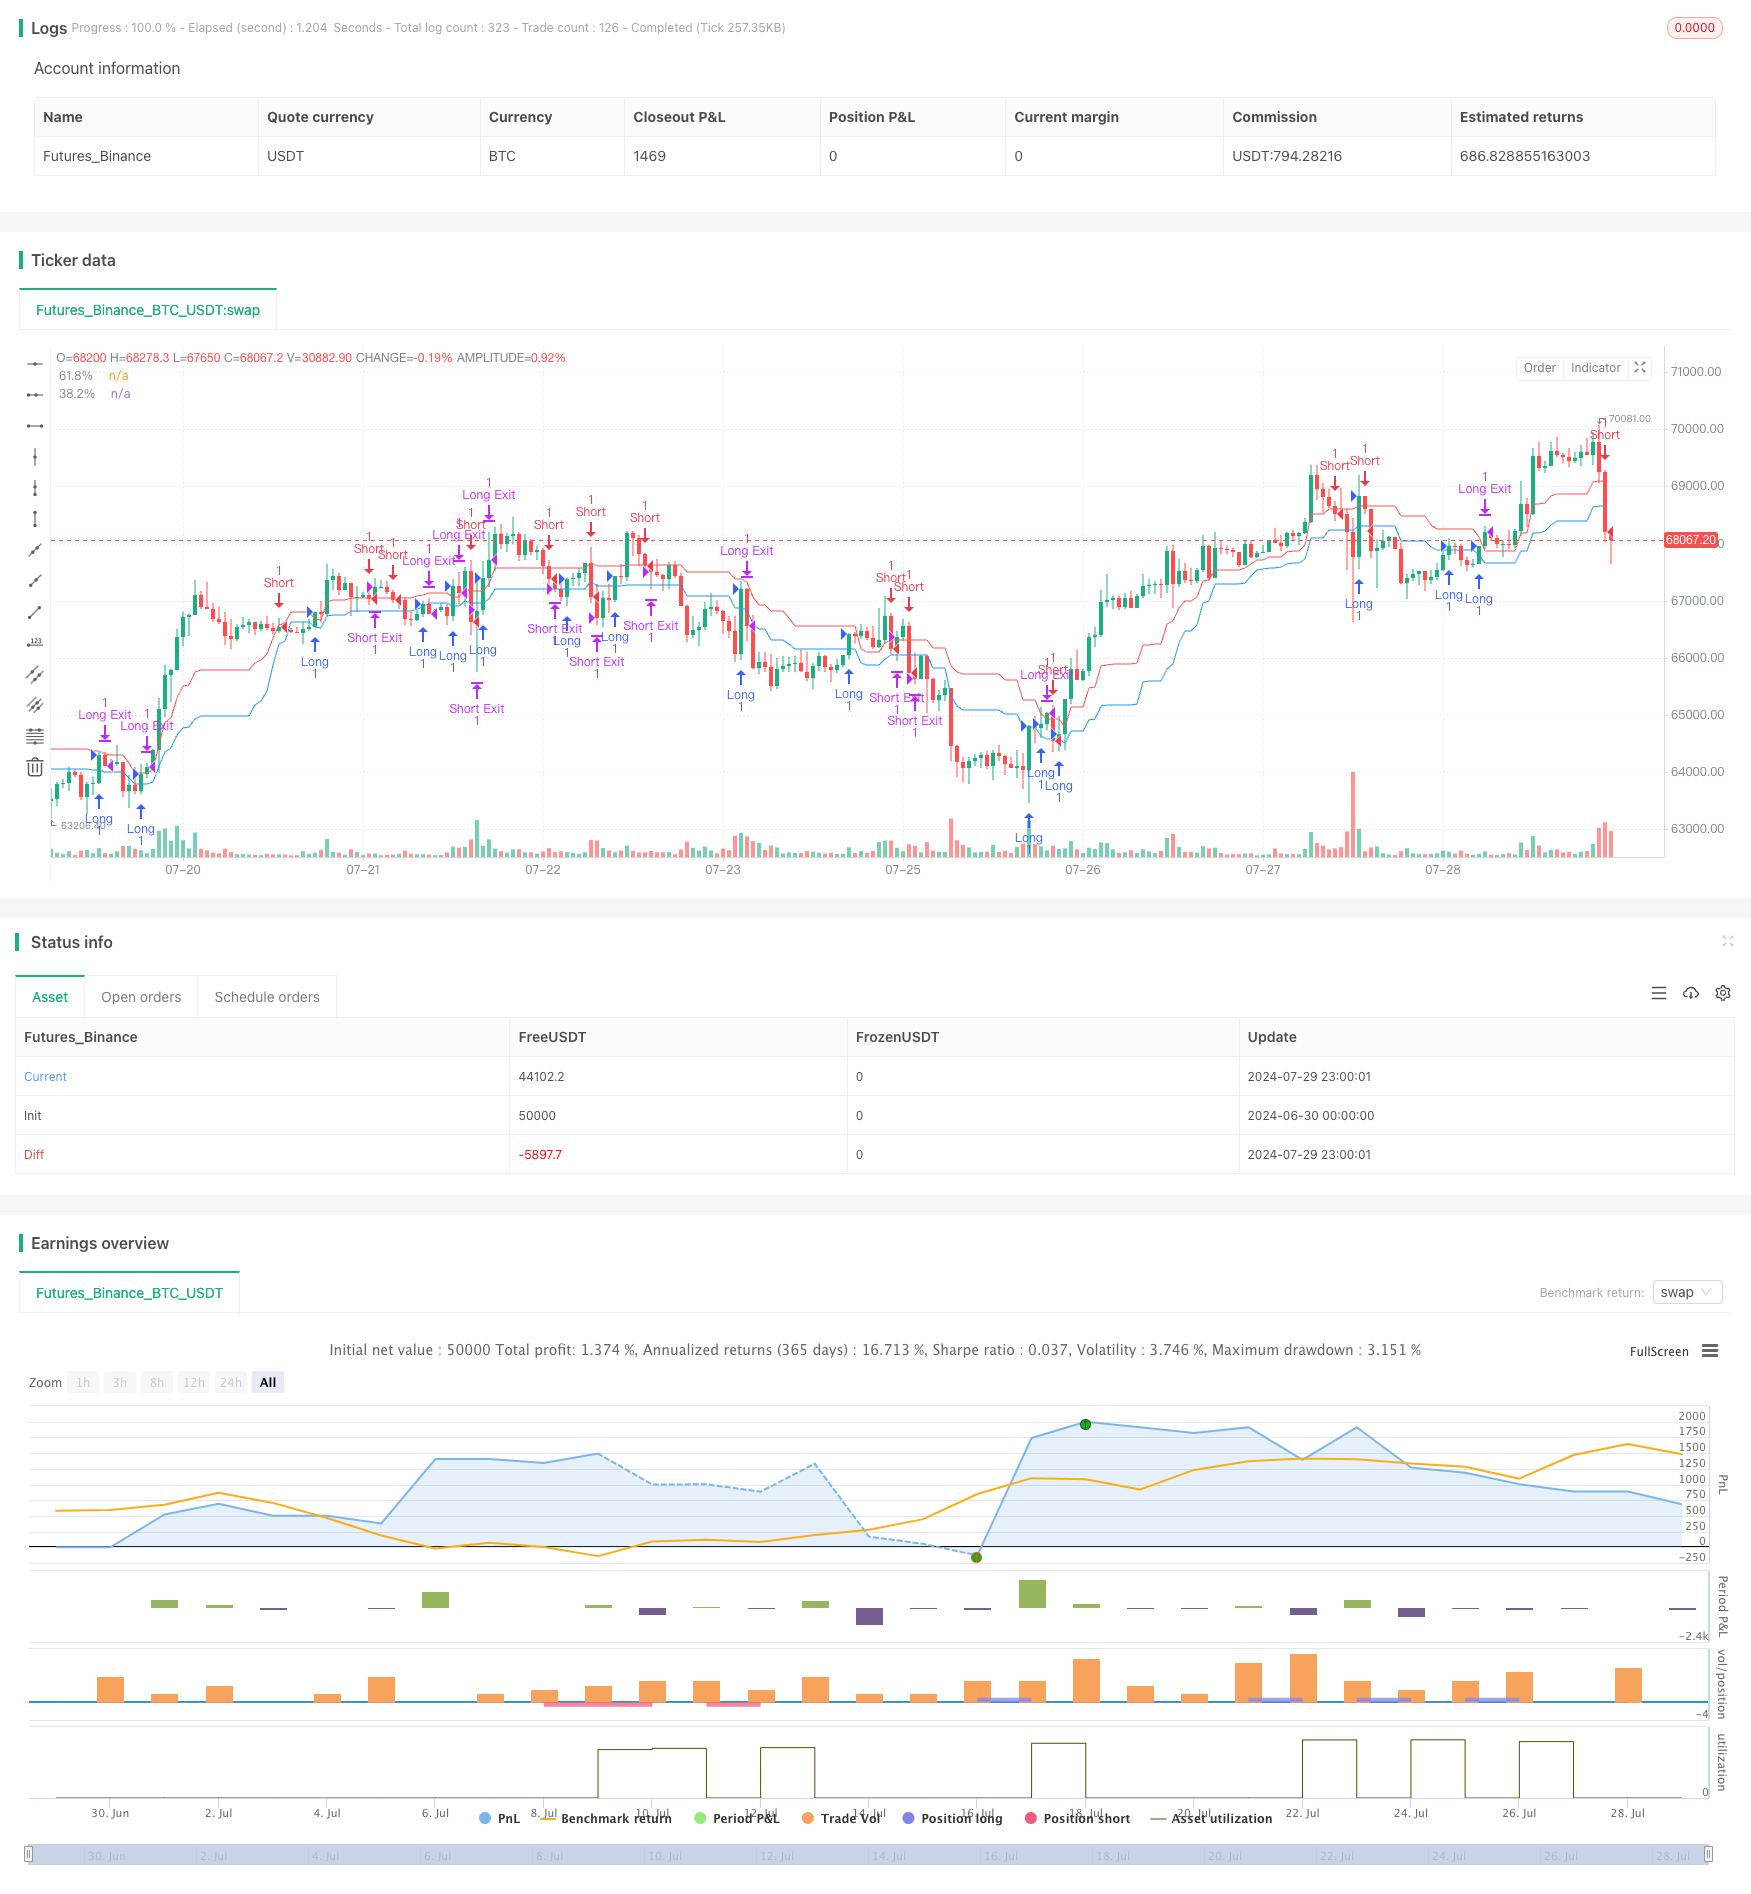
斐波那季水平计算: 策略首先基于过去20个蜡烛图的最高价和最低价计算斐波那契回撤水平。重点关注61.8%和38.2%这两个关键水平。
交易信号生成:
- 当价格向上穿过61.8%水平时,触发做多信号。
- 当价格向下穿过38.2%水平时,触发做空信号。
仓位管理: 策略在信号出现时直接进行相应的多头或空头入场。
止盈止损设置:
- 多头交易: 止盈 = 入场价格 + target_points 止损 = 入场价格 - stop_loss_points
- 空头交易: 止盈 = 入场价格 - target_points 止损 = 入场价格 + stop_loss_points
可视化: 策略在图表上绘制了61.8%和38.2%的斐波那契水平,便于交易者直观观察。
策略优势
自适应性强: 通过动态计算斐波那契水平,策略能够适应不同市场环境和波动性。
趋势跟踪与反转结合: 策略既捕捉趋势延续(突破61.8%水平),又关注潜在反转(跌破38.2%水平),提高了交易的全面性。
风险管理完善: 内置的动态止盈止损机制,有效控制每笔交易的风险暴露。
参数灵活可调: 允许用户自定义历史蜡烛数量、目标点数和止损点数,以适应不同的交易风格和市场特征。
可视化支持: 斐波那契水平的图形化展示,有助于交易者直观理解市场结构和潜在支撑阻力位。
策略风险
假突破风险: 在横盘市场中,价格可能频繁穿越斐波那契水平,导致多次错误信号。
滑点影响: 在波动剧烈的市场中,实际成交价可能与信号价格存在较大偏差。
固定止盈止损的局限性: 采用固定点数的止盈止损可能不适合所有市场环境,尤其是在波动性发生显著变化时。
过度交易风险: 在某些市场条件下,策略可能产生过多的交易信号,增加交易成本。
单一时间框架的局限: 仅依赖单一时间框架的信号可能忽视更大周期的市场趋势。
策略优化方向
引入趋势过滤器: 结合更长周期的移动平均线或ADX指标,以确保在主趋势方向上交易。
动态止盈止损: 根据ATR(平均真实波幅)动态调整止盈止损水平,以适应不同的市场波动性。
多时间框架分析: 整合更高时间框架的斐波那契水平,提高交易决策的可靠性。
加入成交量确认: 在信号生成时考虑成交量因素,以过滤低质量的突破。
优化参数选择: 利用回测数据和机器学习算法,为不同市场环境寻找最优参数组合。
引入其他技术指标: 结合RSI或MACD等指标,增加交易信号的确认机制。
改进入场时机: 考虑在斐波那契水平附近设置限价单,而不是简单的市价单,以获得更好的成交价格。
总结
基于斐波那契回撤的自适应趋势跟踪策略是一个结合了经典技术分析原理和现代量化交易技术的交易系统。它通过动态识别关键价格水平,在趋势延续和潜在反转之间寻找平衡,为交易者提供了一个灵活且系统化的交易方法。
策略的核心优势在于其自适应性和风险管理能力,使其能够在不同市场环境中保持相对稳定的表现。然而,交易者在使用此策略时需要注意假突破、过度交易等潜在风险,并考虑通过引入额外的过滤机制和多维度分析来进一步增强策略的稳健性。
通过持续优化和改进,如引入动态止盈止损、多时间框架分析等方法,该策略有潜力成为一个更加全面和高效的交易系统。最终,交易者需要根据自身的风险偏好和市场洞察,对策略进行个性化调整,以实现最佳的交易效果。
/*backtest
start: 2024-06-30 00:00:00
end: 2024-07-30 00:00:00
period: 1h
basePeriod: 15m
exchanges: [{"eid":"Futures_Binance","currency":"BTC_USDT"}]
*/

//@version=5
strategy("Fibonacci Retracement Strategy", overlay=true)

// Input parameters
fib_levels = input.bool(true, title="Show Fibonacci Levels")
n = input.int(20, title="Number of Historical Candles")

target_points = input.int(100, title="Target Points")
stop_loss_points = input.int(50, title="Stop Loss Points")

// Calculate Fibonacci levels
high_price = ta.highest(close, 20)
low_price = ta.lowest(close, 20)
range_ = high_price - low_price
fib618 = high_price - range_ * 0.618
fib382 = high_price - range_ * 0.382

// Strategy logic
long_condition = ta.crossover(close, fib618)
short_condition = ta.crossunder(close, fib382)

// Plot Fibonacci levels
plot(fib_levels ? fib618 : na , "61.8%", color=color.blue, trackprice=true)
plot(fib_levels ? fib382 : na , "38.2%", color=color.red, trackprice=true)

// Strategy entry and exit
if long_condition
    strategy.entry("Long", strategy.long)
if short_condition
    strategy.entry("Short", strategy.short)

// Calculate target and stop loss levels
long_target = strategy.position_avg_price + target_points
long_stop_loss = strategy.position_avg_price - stop_loss_points
short_target = strategy.position_avg_price - target_points
short_stop_loss = strategy.position_avg_price + stop_loss_points

// Strategy exit
strategy.exit("Long Exit", "Long", limit=long_target, stop=long_stop_loss)
strategy.exit("Short Exit", "Short", limit=short_target, stop=short_stop_loss)