Multi-Indicator Crossover Momentum Trading Strategy with Optimized Take Profit and Stop Loss System
Author: ChaoZhang, Date: 2024-10-14 11:45:11Tags: RSIEMAMACDTPSLRR
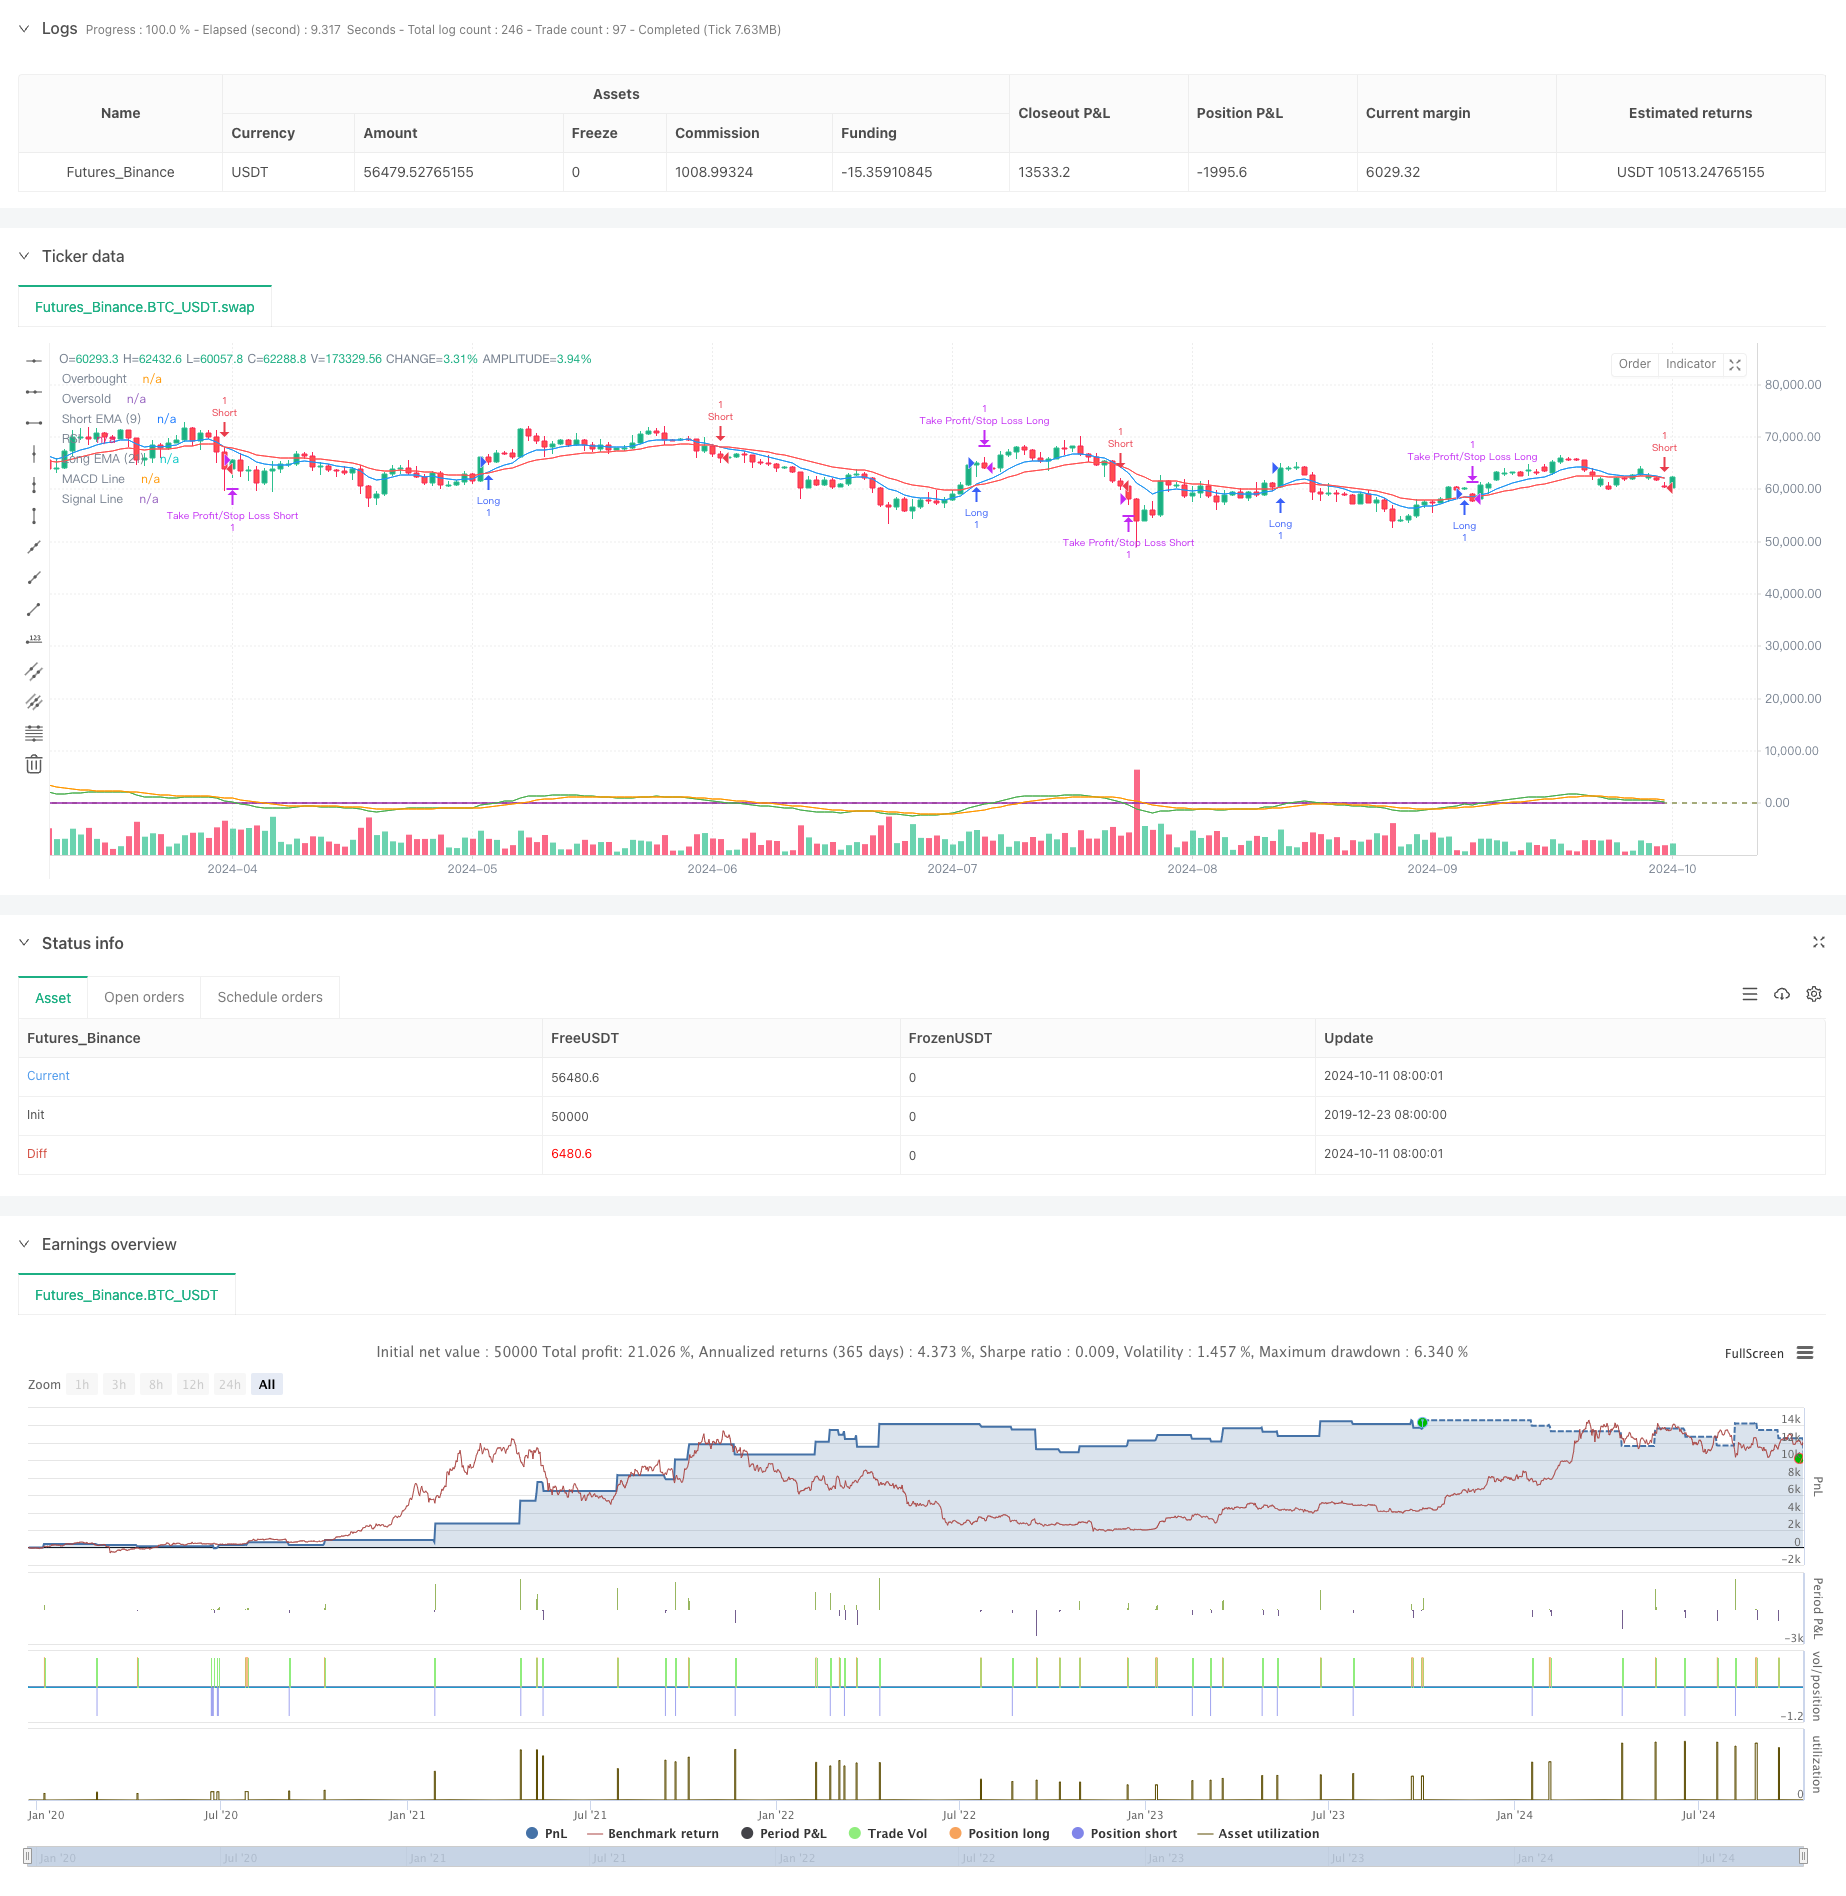
Overview
This strategy is a momentum trading system that combines multiple technical indicators while integrating a flexible take profit and stop loss mechanism. The strategy primarily uses crossover signals from three popular technical indicators - RSI, EMA, and MACD - to assess market trends and momentum for making trading decisions. It also incorporates percentage-based take profit and stop loss levels, as well as a risk-reward ratio concept to optimize money management and risk control.
Strategy Principles
The core principle of this strategy is to identify potential trading opportunities through the synergistic effect of multiple indicators. Specifically:
- It uses the RSI (Relative Strength Index) to determine if the market is in overbought or oversold conditions.
- It utilizes the crossover of short-term and long-term EMAs (Exponential Moving Averages) to confirm trend changes.
- It further verifies momentum through the relationship between the MACD (Moving Average Convergence Divergence) histogram and signal line.
The strategy triggers trading signals when these indicators simultaneously meet specific conditions. For example, a long signal is generated when the short-term EMA crosses above the long-term EMA, the RSI is below the overbought level, and the MACD histogram is above the signal line. Opposite conditions trigger short signals.
Additionally, the strategy incorporates a percentage-based take profit and stop loss mechanism, allowing traders to set appropriate profit targets and stop loss levels based on their risk preferences. The introduction of a risk-reward ratio further optimizes the money management strategy.
Strategy Advantages
- Multi-indicator synergy: By combining RSI, EMA, and MACD, the strategy can analyze the market from multiple perspectives, increasing the reliability of signals.
- Flexible money management: The percentage-based take profit and stop loss settings, along with the risk-reward ratio, allow the strategy to be adjusted according to different market environments and individual risk preferences.
- Trend following and momentum combination: EMA crossovers provide trend signals, while RSI and MACD supplement momentum factors, helping to capture strong market movements.
- Visual support: The strategy plots key indicators on the chart, facilitating intuitive understanding of market conditions and strategy logic.
- Adjustable parameters: The periods and thresholds of major indicators can be adjusted through input parameters, increasing the strategy’s adaptability.
Strategy Risks
- Overtrading: In choppy markets, multiple indicators may frequently generate conflicting signals, leading to excessive trading.
- Lagging nature: All indicators used are essentially lagging indicators, which may not react timely in rapidly changing markets.
- False breakout risk: EMA crossover strategies are susceptible to market noise and may produce false breakout signals.
- Parameter sensitivity: The strategy’s performance highly depends on the chosen parameters, which may require different settings for various market environments.
- Lack of market sentiment consideration: The strategy is primarily based on technical indicators and does not account for fundamental factors or market sentiment, potentially underperforming during significant news events.
Strategy Optimization Directions
- Introduce volatility filtering: Consider adding the ATR (Average True Range) indicator to reduce trading frequency in low volatility environments and improve signal quality.
- Add trend strength filtering: For example, use the ADX (Average Directional Index) to ensure trading only in strong trends, avoiding frequent trades in ranging markets.
- Dynamic take profit and stop loss: Adjust take profit and stop loss levels dynamically based on market volatility, such as using multiples of ATR.
- Time filtering: Add trading time window restrictions to avoid highly volatile opening and closing sessions.
- Incorporate volume analysis: Combine volume indicators like OBV (On-Balance Volume) or CMF (Chaikin Money Flow) to validate price movements.
- Machine learning optimization: Use machine learning algorithms to dynamically adjust and optimize strategy parameters to adapt to changing market environments.
Conclusion
This multi-indicator crossover momentum trading strategy provides traders with a comprehensive trading system by integrating RSI, EMA, and MACD technical indicators with a flexible take profit and stop loss mechanism. The strategy’s strengths lie in its ability to analyze the market from multiple angles and its flexible risk management methods. However, like all trading strategies, it faces risks such as overtrading and parameter sensitivity. By introducing optimization directions such as volatility filtering, dynamic stop loss, and machine learning, the strategy has the potential to further improve its performance in various market environments. When using this strategy, traders need to carefully adjust parameters and combine market analysis with risk management principles to achieve optimal trading results.
/*backtest
start: 2019-12-23 08:00:00
end: 2024-10-12 08:00:00
period: 1d
basePeriod: 1d
exchanges: [{"eid":"Futures_Binance","currency":"BTC_USDT"}]
*/

//@version=5
strategy("Crypto Futures Day Trading with Profit/Limit/Loss", overlay=true, margin_long=100, margin_short=100)

// Parameters for the strategy
rsiPeriod = input.int(14, title="RSI Period")
rsiOverbought = input.int(70, title="RSI Overbought Level")
rsiOversold = input.int(30, title="RSI Oversold Level")
emaShortPeriod = input.int(9, title="Short EMA Period")
emaLongPeriod = input.int(21, title="Long EMA Period")
macdFastLength = input.int(12, title="MACD Fast Length")
macdSlowLength = input.int(26, title="MACD Slow Length")
macdSignalSmoothing = input.int(9, title="MACD Signal Smoothing")

// Parameters for Take Profit, Stop Loss, and Limit
takeProfitPercent = input.float(3, title="Take Profit %", step=0.1) // 3% by default
stopLossPercent = input.float(1, title="Stop Loss %", step=0.1) // 1% by default
limitRiskRewardRatio = input.float(2, title="Risk/Reward Ratio", step=0.1) // Example: 2:1 ratio

// Calculate RSI
rsi = ta.rsi(close, rsiPeriod)

// Calculate EMA (Exponential Moving Average)
emaShort = ta.ema(close, emaShortPeriod)
emaLong = ta.ema(close, emaLongPeriod)

// Calculate MACD
[macdLine, signalLine, _] = ta.macd(close, macdFastLength, macdSlowLength, macdSignalSmoothing)

// Calculate take profit and stop loss levels
takeProfitLong = strategy.position_avg_price * (1 + takeProfitPercent / 100)
stopLossLong = strategy.position_avg_price * (1 - stopLossPercent / 100)

takeProfitShort = strategy.position_avg_price * (1 - takeProfitPercent / 100)
stopLossShort = strategy.position_avg_price * (1 + stopLossPercent / 100)

// Entry conditions for long position
longCondition = ta.crossover(emaShort, emaLong) and rsi < rsiOverbought and macdLine > signalLine
if (longCondition)
    strategy.entry("Long", strategy.long)

// Exit conditions for long position based on stop loss and take profit
strategy.exit("Take Profit/Stop Loss Long", from_entry="Long", limit=takeProfitLong, stop=stopLossLong)

// Entry conditions for short position
shortCondition = ta.crossunder(emaShort, emaLong) and rsi > rsiOversold and macdLine < signalLine
if (shortCondition)
    strategy.entry("Short", strategy.short)

// Exit conditions for short position based on stop loss and take profit
strategy.exit("Take Profit/Stop Loss Short", from_entry="Short", limit=takeProfitShort, stop=stopLossShort)

// Plot EMA lines on the chart
plot(emaShort, color=color.blue, title="Short EMA (9)")
plot(emaLong, color=color.red, title="Long EMA (21)")

// Plot MACD and signal lines in a separate window
plot(macdLine, color=color.green, title="MACD Line")
plot(signalLine, color=color.orange, title="Signal Line")

// Plot RSI
hline(rsiOverbought, "Overbought", color=color.red)
hline(rsiOversold, "Oversold", color=color.green)
plot(rsi, color=color.purple, title="RSI")
- Volume-based Dynamic DCA Strategy
- Multi-Timeframe RSI Oversold Reversal Strategy
- Multi-Indicator Dynamic Trading Strategy
- Multi-EMA Crossover Trend Following Strategy with Dynamic Stop-Loss and Take-Profit Optimization
- MACD Crossover Momentum Strategy with Dynamic Take Profit and Stop Loss Optimization
- KRK ADA 1H Stochastic Slow Strategy with More Entries and AI
- High Win Rate Trend Mean Reversion Trading Strategy
- RSI-based Trading Strategy with Percentage-based Take Profit and Stop Loss
- EMA Crossover with Dual Take Profit and Stop Loss Strategy
- EMA Crossover Trading Strategy with Dynamic Take Profit and Stop Loss
- Triple-Validated RSI Mean Reversion with Moving Average Filter Strategy
- Adaptive Oscillation Trend Trading Strategy with Bollinger Bands and RSI Integration
- ADX (Average Directional Index) and Volume Dynamic Trend Tracking Strategy
- Multi-Volume Momentum Combined Trading Strategy
- Fibonacci Retracement and Extension Multi-Indicator Quantitative Trading Strategy
- Cross-Market Overnight Position Strategy with EMA Filter
- Multi-Technical Indicator Based Mean Reversion and Trend Following Strategy
- WebSocket Acceleration Driver
- multiple thread get fundings symbols
- EMA/MACD/RSI Crossover Strategy
- Volatility Stop Cloud Strategy with Moving Average Crossover System
- Bollinger Bands Precise Crossover Quantitative Strategy
- Dynamic Risk-Managed EMA Crossover with Bollinger Bands Strategy
- Multi-Level Balanced Quantitative Trading Strategy
- Multi-Dimensional Mathematical Model Trading Strategy
- EMA Crossover Fibonacci Reversal Strategy
- Adaptive Multi-Level Trading Strategy Based on Fibonacci Retracement
- Bollinger Band Overbought/Oversold Strategy
- Multi-Period EMA Crossover with VWAP High Win-Rate Intraday Trading Strategy
- Enhanced Breakout Strategy with Targets and Stop Loss Optimization