Multi-EMA Trend Following Strategy with SMMA Confirmation
Author: ChaoZhang, Date: 2024-12-12 15:55:44Tags: EMASMMAMA

Overview
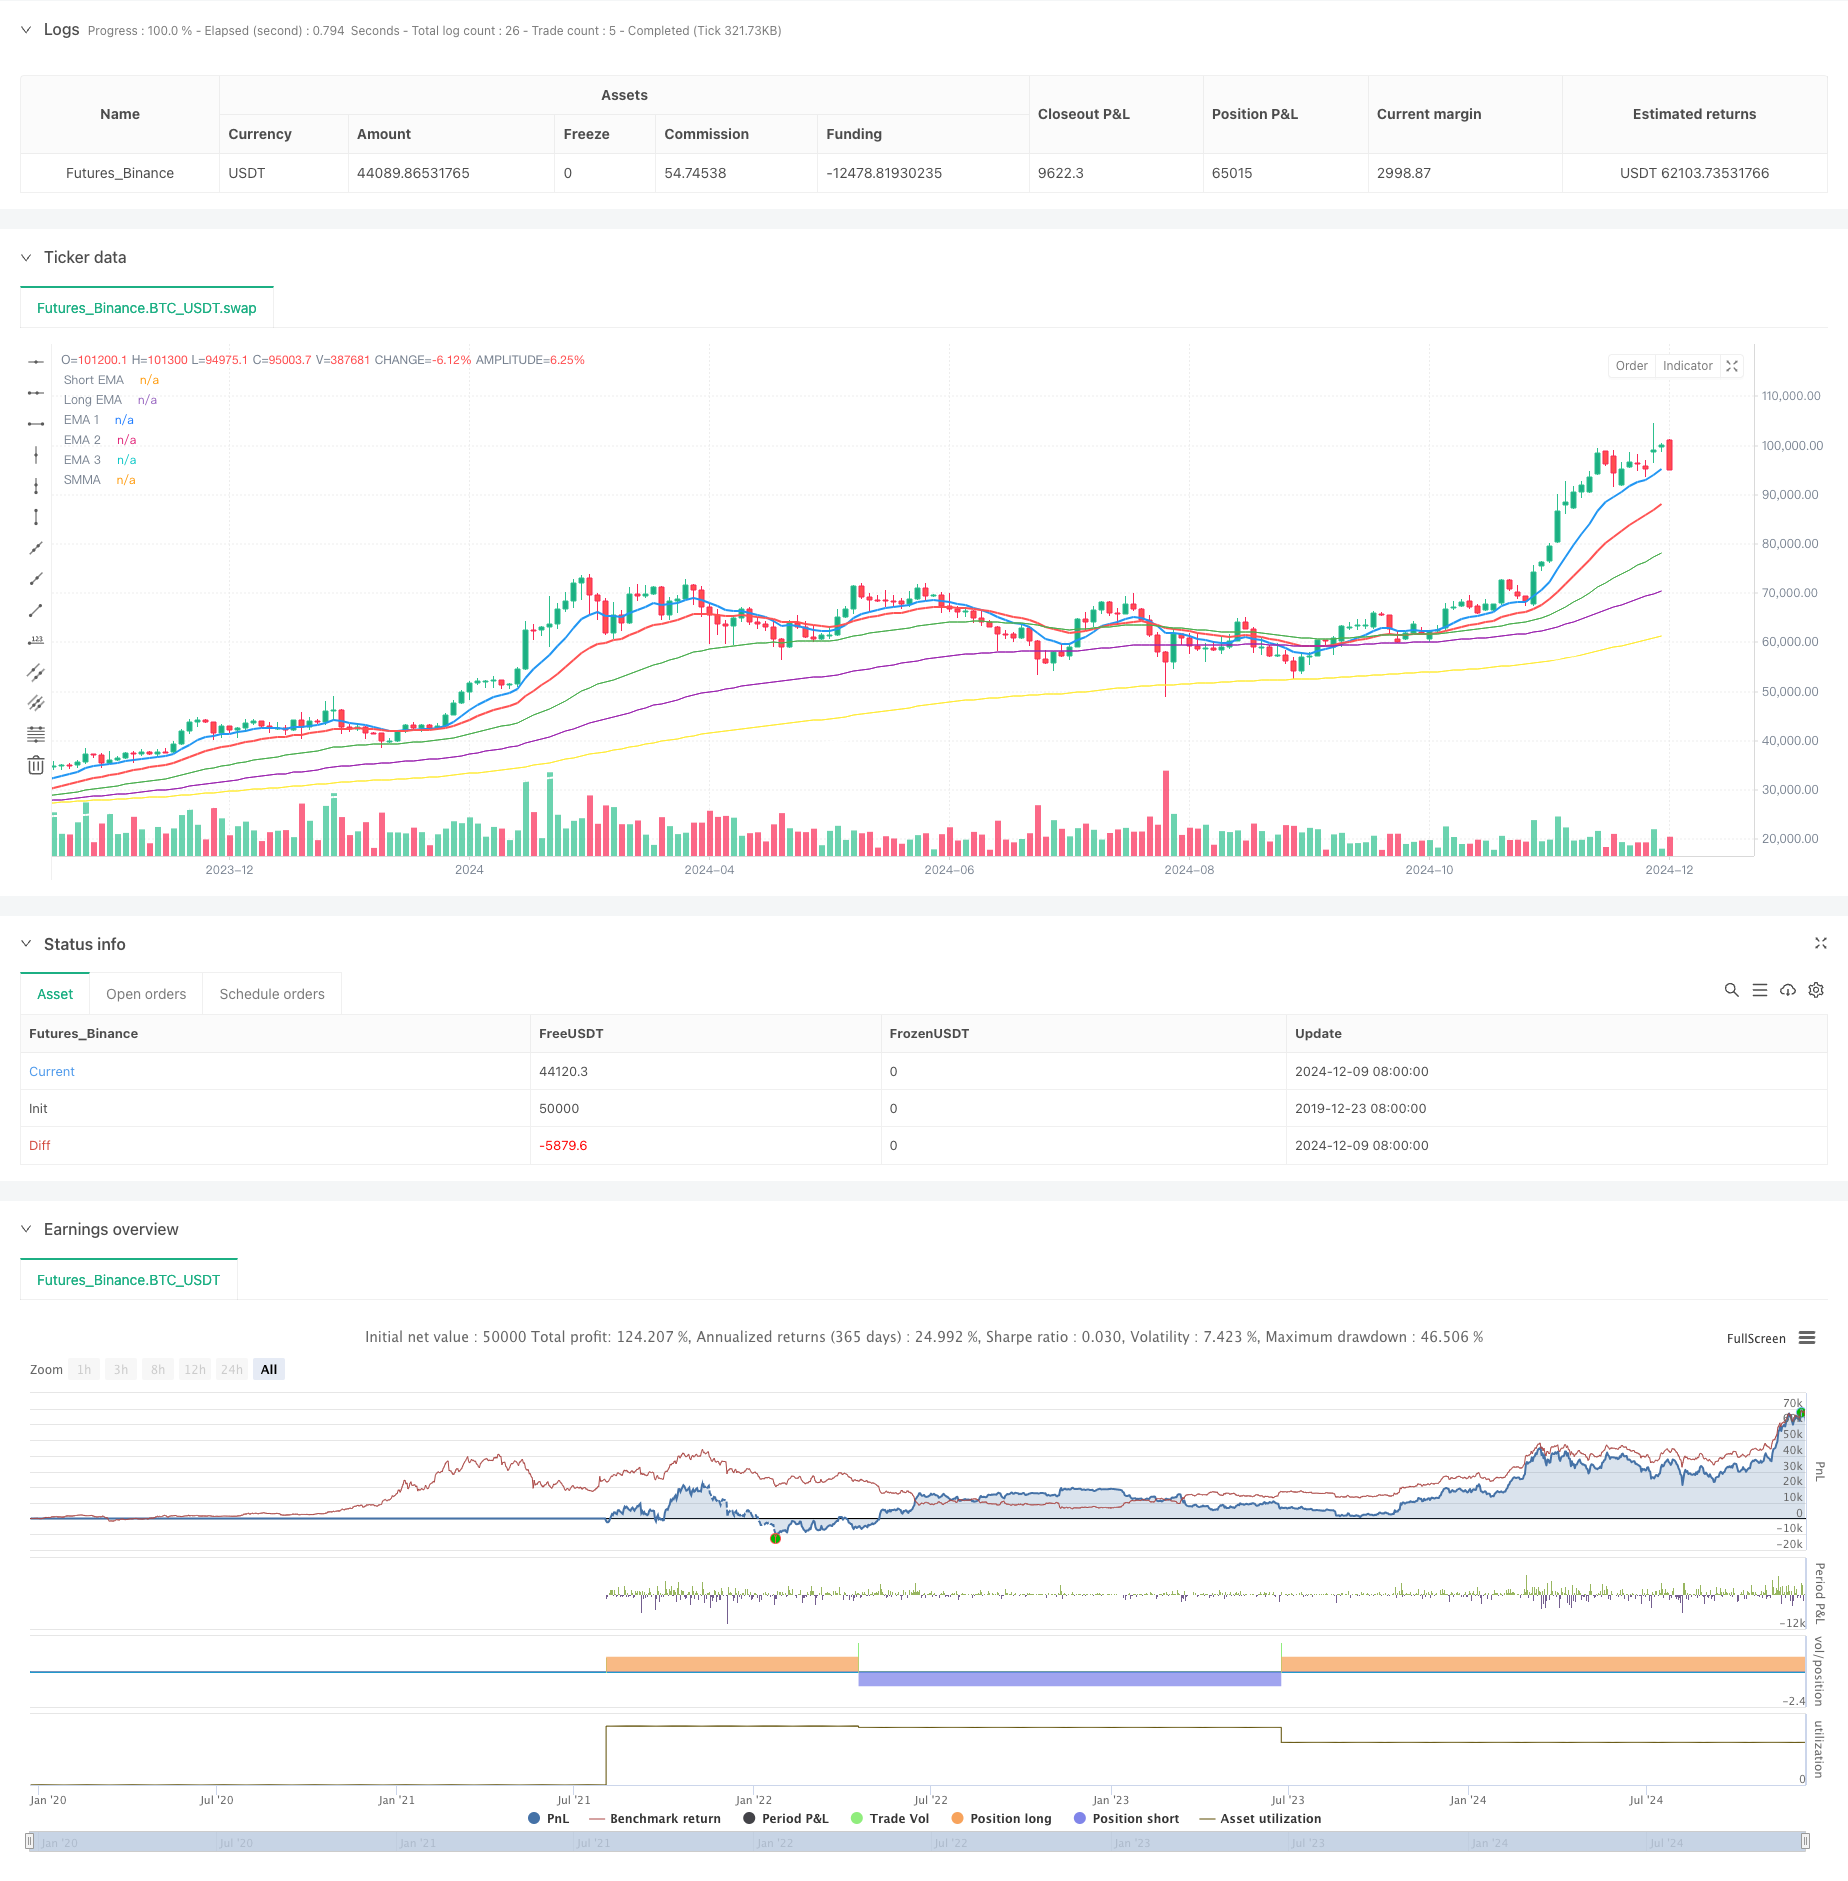
This strategy is a trend-following trading system based on multiple Exponential Moving Averages (EMAs) and Smoothed Moving Average (SMMA). It generates trading signals through the crossover of short-term and long-term EMAs, uses SMMA as a trend confirmation indicator, and incorporates additional EMA lines as support and resistance references. This approach enables both trend capture and effective control of false breakout risks.
Strategy Principle
The strategy employs 10-day and 22-day EMAs as primary signal lines, 200-day SMMA as a trend filter, along with 50-day, 100-day, and 200-day EMAs as auxiliary indicators. A buy signal is generated when the short-term EMA crosses above the long-term EMA and price is above the SMMA; a sell signal is generated when the short-term EMA crosses below the long-term EMA and price is below the SMMA. The additional three EMA lines provide further technical support and resistance reference points.
Strategy Advantages
- Multiple timeframe confirmation improves trading reliability
- SMMA integration effectively filters false breakout signals
- Additional EMA lines provide clear support and resistance reference points
- Simple and clear strategy logic, easy to understand and execute
- Complete trend-following mechanism ensures capture of major trend movements
Strategy Risks
- May generate frequent false signals in ranging markets
- Moving average crossover signals have inherent lag
- Multiple moving averages might create confusion in certain situations
- Potential for significant drawdowns in highly volatile markets
- Slow response to rapid market reversals
Strategy Optimization Directions
- Incorporate volatility indicators for position sizing
- Add volume confirmation mechanism
- Implement stop-loss and take-profit conditions for risk control
- Optimize moving average parameters for specific markets
- Consider adding trend strength filters
Summary
This is a trend-following strategy that integrates multiple moving average systems, capturing trends while controlling risks through the coordinated use of different period moving averages. The strategy’s core strength lies in its multiple confirmation mechanism, though attention must be paid to its performance in ranging markets. Through appropriate parameter optimization and risk management, this strategy can achieve good results in trending markets.
/*backtest
start: 2019-12-23 08:00:00
end: 2024-12-10 08:00:00
period: 2d
basePeriod: 2d
exchanges: [{"eid":"Futures_Binance","currency":"BTC_USDT"}]
*/

//@version=5
strategy("EMA Crossover with SMMA and Additional EMAs", overlay=true)

// Input parameters for EMAs and SMMA
emaShortLength = input.int(10, title="Short EMA Length")
emaLongLength = input.int(22, title="Long EMA Length")
smmaLength = input.int(200, title="SMMA Length")

// Additional EMA lengths
ema1Length = input.int(50, title="EMA 1 Length")
ema2Length = input.int(100, title="EMA 2 Length")
ema3Length = input.int(200, title="EMA 3 Length")

// Calculate EMAs and SMMA
emaShort = ta.ema(close, emaShortLength)
emaLong = ta.ema(close, emaLongLength)
smma = ta.sma(ta.sma(close, smmaLength), 2) // SMMA approximation
ema1 = ta.ema(close, ema1Length)
ema2 = ta.ema(close, ema2Length)
ema3 = ta.ema(close, ema3Length)

// Plot EMAs and SMMA on the chart
plot(emaShort, color=color.blue, linewidth=2, title="Short EMA")
plot(emaLong, color=color.red, linewidth=2, title="Long EMA")
plot(smma, color=color.white, linewidth=2, title="SMMA")
plot(ema1, color=color.green, linewidth=1, title="EMA 1")
plot(ema2, color=color.purple, linewidth=1, title="EMA 2")
plot(ema3, color=color.yellow, linewidth=1, title="EMA 3")

// Buy condition: Short EMA crosses above Long EMA and price is above SMMA
buyCondition = ta.crossover(emaShort, emaLong) and close > smma

// Sell condition: Short EMA crosses below Long EMA and price is below SMMA
sellCondition = ta.crossunder(emaShort, emaLong) and close < smma

// Execute Buy order
if (buyCondition)
    strategy.entry("Buy", strategy.long)
    alert("Buy Signal: Short EMA crossed above Long EMA and price is above SMMA.", alert.freq_once_per_bar_close)

// Execute Sell order
if (sellCondition)
    strategy.entry("Sell", strategy.short)
    alert("Sell Signal: Short EMA crossed below Long EMA and price is below SMMA.", alert.freq_once_per_bar_close)
- William Alligator Moving Average Trend Catcher Strategy
- Adaptive Multi-MA Momentum Breakthrough Trading Strategy
- Advanced Flexible Multi-Period Moving Average Crossover Strategy
- Bollinger Bands Breakout Momentum Trading Strategy
- Multi-timeframe Trend Tracking Strategy Based on Impulse MACD and Dual Moving Average Crossover
- Adaptive Moving Average Crossover Strategy
- Multi-Period Moving Average Crossover Trend Following Strategy
- Multi-Moving Average Crossover Trend Following Strategy with Volatility Filter
- Dual Moving Average Momentum Tracking Quantitative Strategy
- Advanced Quantitative Trading Strategy Combining RSI Divergence and Moving Averages
- Mean Reversion Bollinger Band Dollar-Cost Averaging Investment Strategy
- Multi-dimensional Gold Friday Anomaly Strategy Analysis System
- Multi-Timeframe Trend Dynamic ATR Tracking Strategy
- Moving Average Crossover with RSI Trend Momentum Tracking Strategy
- Dynamic ATR-based Trailing Stop Trading Strategy
- Momentum Trend Following MACD-RSI Dual Confirmation Trading Strategy
- Dynamic Pivot Points with Golden Cross Optimization System
- Multi-Indicator Trend Following Strategy with Bollinger Bands and ATR Dynamic Stop Loss
- Dynamic Trend Following ATR Multi-Period Trading Strategy
- Multi-Indicator Trend Following Strategy with Dynamic Channel and Moving Average Trading System
- Multi-Indicator Trend Trading System with Momentum Analysis Strategy
- Trend-Following Cloud Momentum Divergence Strategy
- Multi-Indicator Trend Following and Volatility Breakout Strategy
- Multi-Market Adaptive Multi-Indicator Trend Following Strategy
- Dynamic Timing and Position Management Strategy Based on Volatility
- EMA-MACD Composite Strategy for Trend Scalping
- Multi-Technical Indicator Based Trend Following and Momentum Strategy
- High-Frequency Quantitative Session Trading Strategy: Adaptive Dynamic Position Management System Based on Breakout Signals
- Enhanced Bollinger Breakout Quantitative Strategy with Momentum Filter Integration System
- Multi-EMA Crossover Momentum Trend Following Strategy