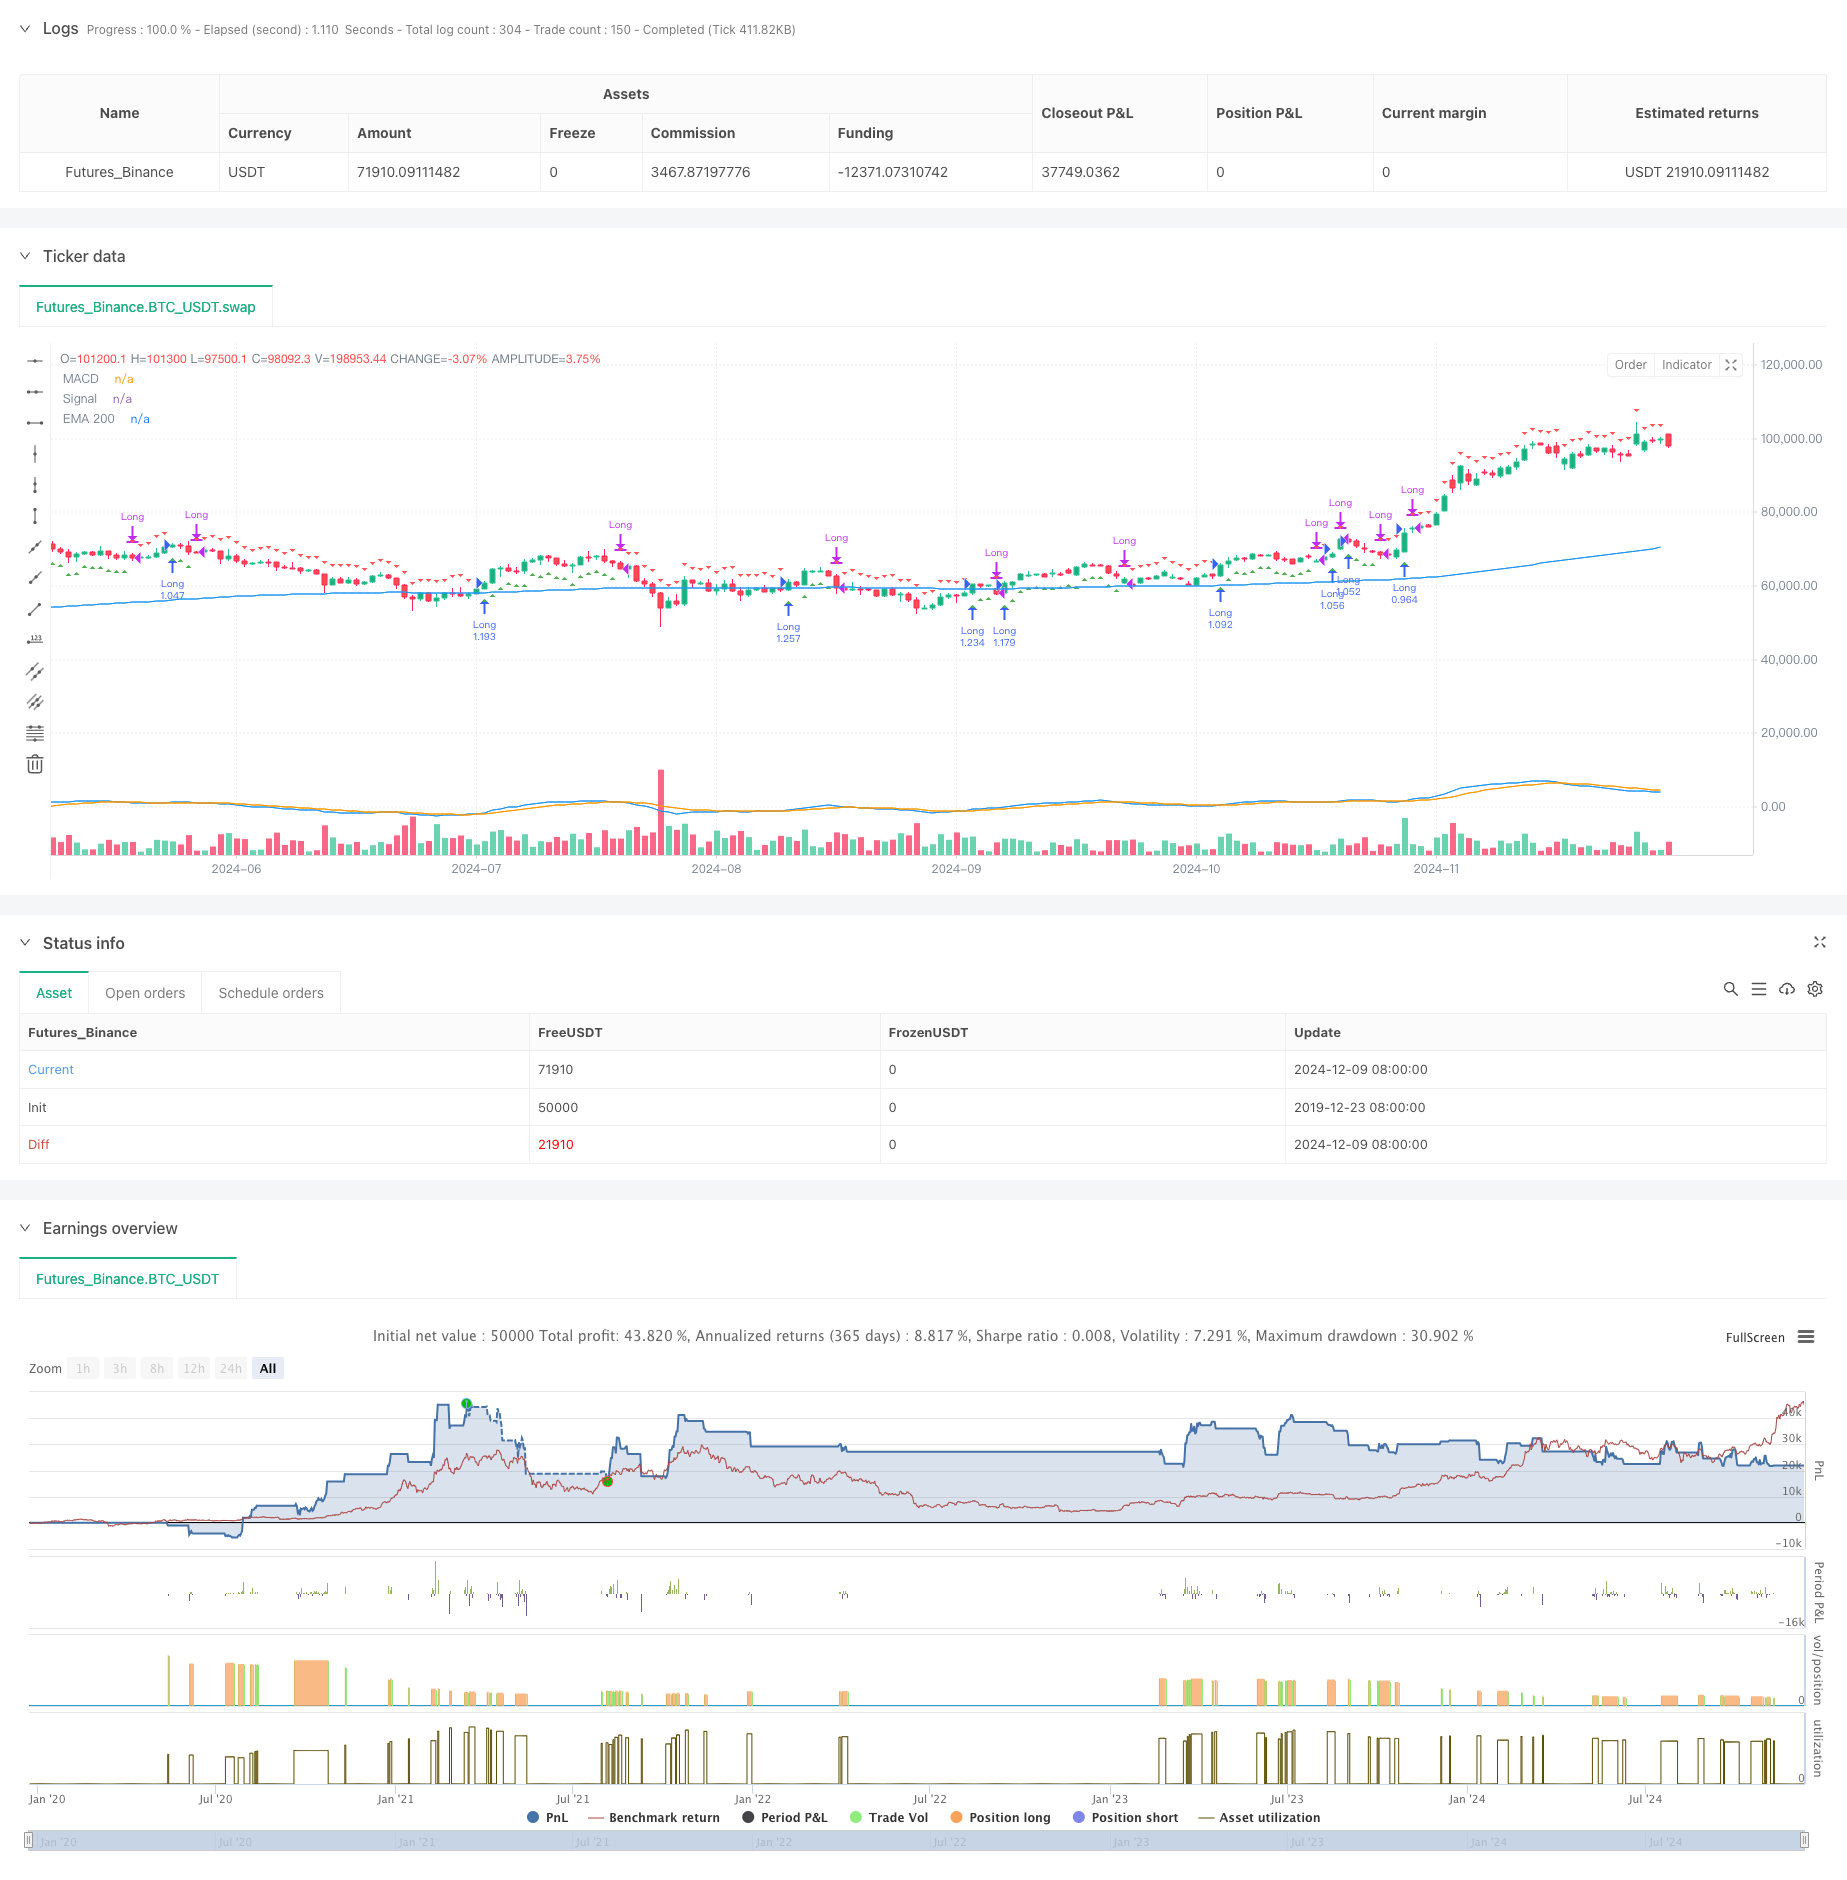
Multi-Technical Indicator Based Trend Following and Momentum Strategy
Author: ChaoZhang, Date: 2024-12-12 15:01:09Tags: MACDEMARSI

Overview
This strategy is a comprehensive trading system that combines moving averages, momentum, and oscillator indicators. The strategy utilizes the Moving Average Convergence Divergence (MACD), Exponential Moving Average (EMA), and Relative Strength Index (RSI) to execute trades when market trends are clear and momentum is sufficient. The strategy primarily focuses on upward trends, using multiple technical indicators for cross-validation to ensure signal reliability.
Strategy Principles
The strategy employs a triple-filtering mechanism to determine trading opportunities: 1. Trend Confirmation: Uses the 200-day Exponential Moving Average (EMA200) as a trend filter, considering long positions only when price is above EMA200. 2. Momentum Confirmation: Uses MACD indicator (parameters: fast 12, slow 26, signal 9) to assess market momentum, requiring MACD line above signal line. 3. Oscillation Confirmation: Employs RSI indicator (parameter 14) for overbought/oversold conditions, requiring RSI between 50-70.
Position closing conditions are flexible, triggered by any of the following: - MACD line crosses below signal line - Price falls below EMA200 - RSI exceeds 70 entering overbought territory
Strategy Advantages
- Multiple confirmation mechanisms significantly reduce the impact of false signals, improving trading reliability.
- Combination of trend and momentum indicators captures both major trends and short-term opportunities.
- RSI filtering effectively prevents chasing high prices.
- Clear strategy logic with adjustable parameters, suitable for different market conditions.
- Percentage-based position management promotes long-term capital growth.
Strategy Risks
- Multiple filtering conditions may result in missing profitable opportunities.
- Frequent false breakouts in ranging markets may lead to consecutive stops.
- EMA200 as a trend indicator may react slowly, leading to larger losses during sharp market reversals.
- Absence of stop-loss conditions may result in significant drawdowns in extreme market conditions.
Strategy Optimization Directions
- Introduce Adaptive Parameters:
- Dynamically adjust MACD parameters based on market volatility
- Optimize stop-loss settings using ATR indicator
- Improve Risk Control:
- Add trailing stop functionality
- Set maximum drawdown limits
- Optimize Entry Timing:
- Add volume confirmation mechanism
- Consider incorporating price pattern analysis
- Enhance Position Management:
- Dynamically adjust position size based on volatility
- Implement scaled entry and exit mechanisms
Summary
The strategy constructs a relatively robust trading system through the comprehensive use of multiple technical indicators. Its core advantage lies in the multiple confirmation mechanisms, effectively reducing the impact of false signals. Through reasonable optimization and improved risk control, the strategy has the potential to maintain stable performance across different market conditions. While there are risks of lagging and missed opportunities, it is overall a practical trading strategy with real-world value.
/*backtest
start: 2019-12-23 08:00:00
end: 2024-12-10 08:00:00
period: 1d
basePeriod: 1d
exchanges: [{"eid":"Futures_Binance","currency":"BTC_USDT"}]
*/

//@version=5
strategy("Simplified SOL/USDT Strategy", overlay=true, initial_capital=10000, default_qty_type=strategy.percent_of_equity, default_qty_value=100)

// Input parameters
fast_length = input(12, "MACD Fast Length")
slow_length = input(26, "MACD Slow Length")
signal_length = input(9, "MACD Signal Length")
ema_length = input(200, "EMA Length")
rsi_length = input(14, "RSI Length")

// Calculate indicators
[macd, signal, hist] = ta.macd(close, fast_length, slow_length, signal_length)
ema200 = ta.ema(close, ema_length)
rsi = ta.rsi(close, rsi_length)

// Entry conditions
long_entry = close > ema200 and
             macd > signal and
             rsi > 50 and rsi < 70

// Exit conditions
long_exit = macd < signal or close < ema200 or rsi > 70

// Strategy execution
if (long_entry)
    strategy.entry("Long", strategy.long)

if (long_exit)
    strategy.close("Long")

// Plot indicators
plot(ema200, color=color.blue, title="EMA 200")
plot(macd, color=color.blue, title="MACD")
plot(signal, color=color.orange, title="Signal")

// Plot entry and exit points
plotshape(long_entry, title="Long Entry", location=location.belowbar, color=color.green, style=shape.triangleup, size=size.small)
plotshape(long_exit, title="Long Exit", location=location.abovebar, color=color.red, style=shape.triangledown, size=size.small)
- Multi-Level Balanced Quantitative Trading Strategy
- EMA Dynamic Stop-Loss Trading Strategy
- EMA RSI MACD Dynamic Take Profit and Stop Loss Trading Strategy
- Multi-Indicator High-Frequency Trading Strategy: Short-Term Trading System Combining Exponential Moving Averages and Momentum Indicators
- MACD-RSI Trend Momentum Cross Strategy with Risk Management Model
- EMA, MACD, and RSI Triple Indicator Momentum Strategy
- Dual EMA Crossover Momentum Trend Following Strategy
- Dual Trend Strategy with EMA Crossover and RSI Filter
- Multi-Dimensional Technical Indicator Trend Following Quantitative Strategy
- EMA-MACD Composite Strategy for Trend Scalping
- Multi-Indicator Trend Following Strategy with Bollinger Bands and ATR Dynamic Stop Loss
- Dynamic Trend Following ATR Multi-Period Trading Strategy
- Multi-Indicator Trend Following Strategy with Dynamic Channel and Moving Average Trading System
- Multi-EMA Trend Following Strategy with SMMA Confirmation
- Multi-Indicator Trend Trading System with Momentum Analysis Strategy
- Trend-Following Cloud Momentum Divergence Strategy
- Multi-Indicator Trend Following and Volatility Breakout Strategy
- Multi-Market Adaptive Multi-Indicator Trend Following Strategy
- Dynamic Timing and Position Management Strategy Based on Volatility
- EMA-MACD Composite Strategy for Trend Scalping
- High-Frequency Quantitative Session Trading Strategy: Adaptive Dynamic Position Management System Based on Breakout Signals
- Enhanced Bollinger Breakout Quantitative Strategy with Momentum Filter Integration System
- Multi-EMA Crossover Momentum Trend Following Strategy
- Multi-Target Intelligent Volume Momentum Trading Strategy
- Multi-Period Bollinger Bands Touch Trend Reversal Quantitative Trading Strategy
- High-Frequency Breakout Trading Strategy Based on Candlestick Close Direction
- Advanced Dynamic Fibonacci Retracement Trend Quantitative Trading Strategy
- Variable Index Dynamic Average Multi-Tier Profit Trend Following Strategy
- Multi Moving Average Trading System with Momentum and Volume Confirmation Quantitative Trend Strategy
- Adaptive Trailing Drawdown Balanced Trading Strategy with Take-Profit and Stop-Loss