Dual Momentum Breakthrough Confirmation Quantitative Trading Strategy
Author: ChaoZhang, Date: 2024-12-13 10:37:00Tags: WPRRSI

Overview
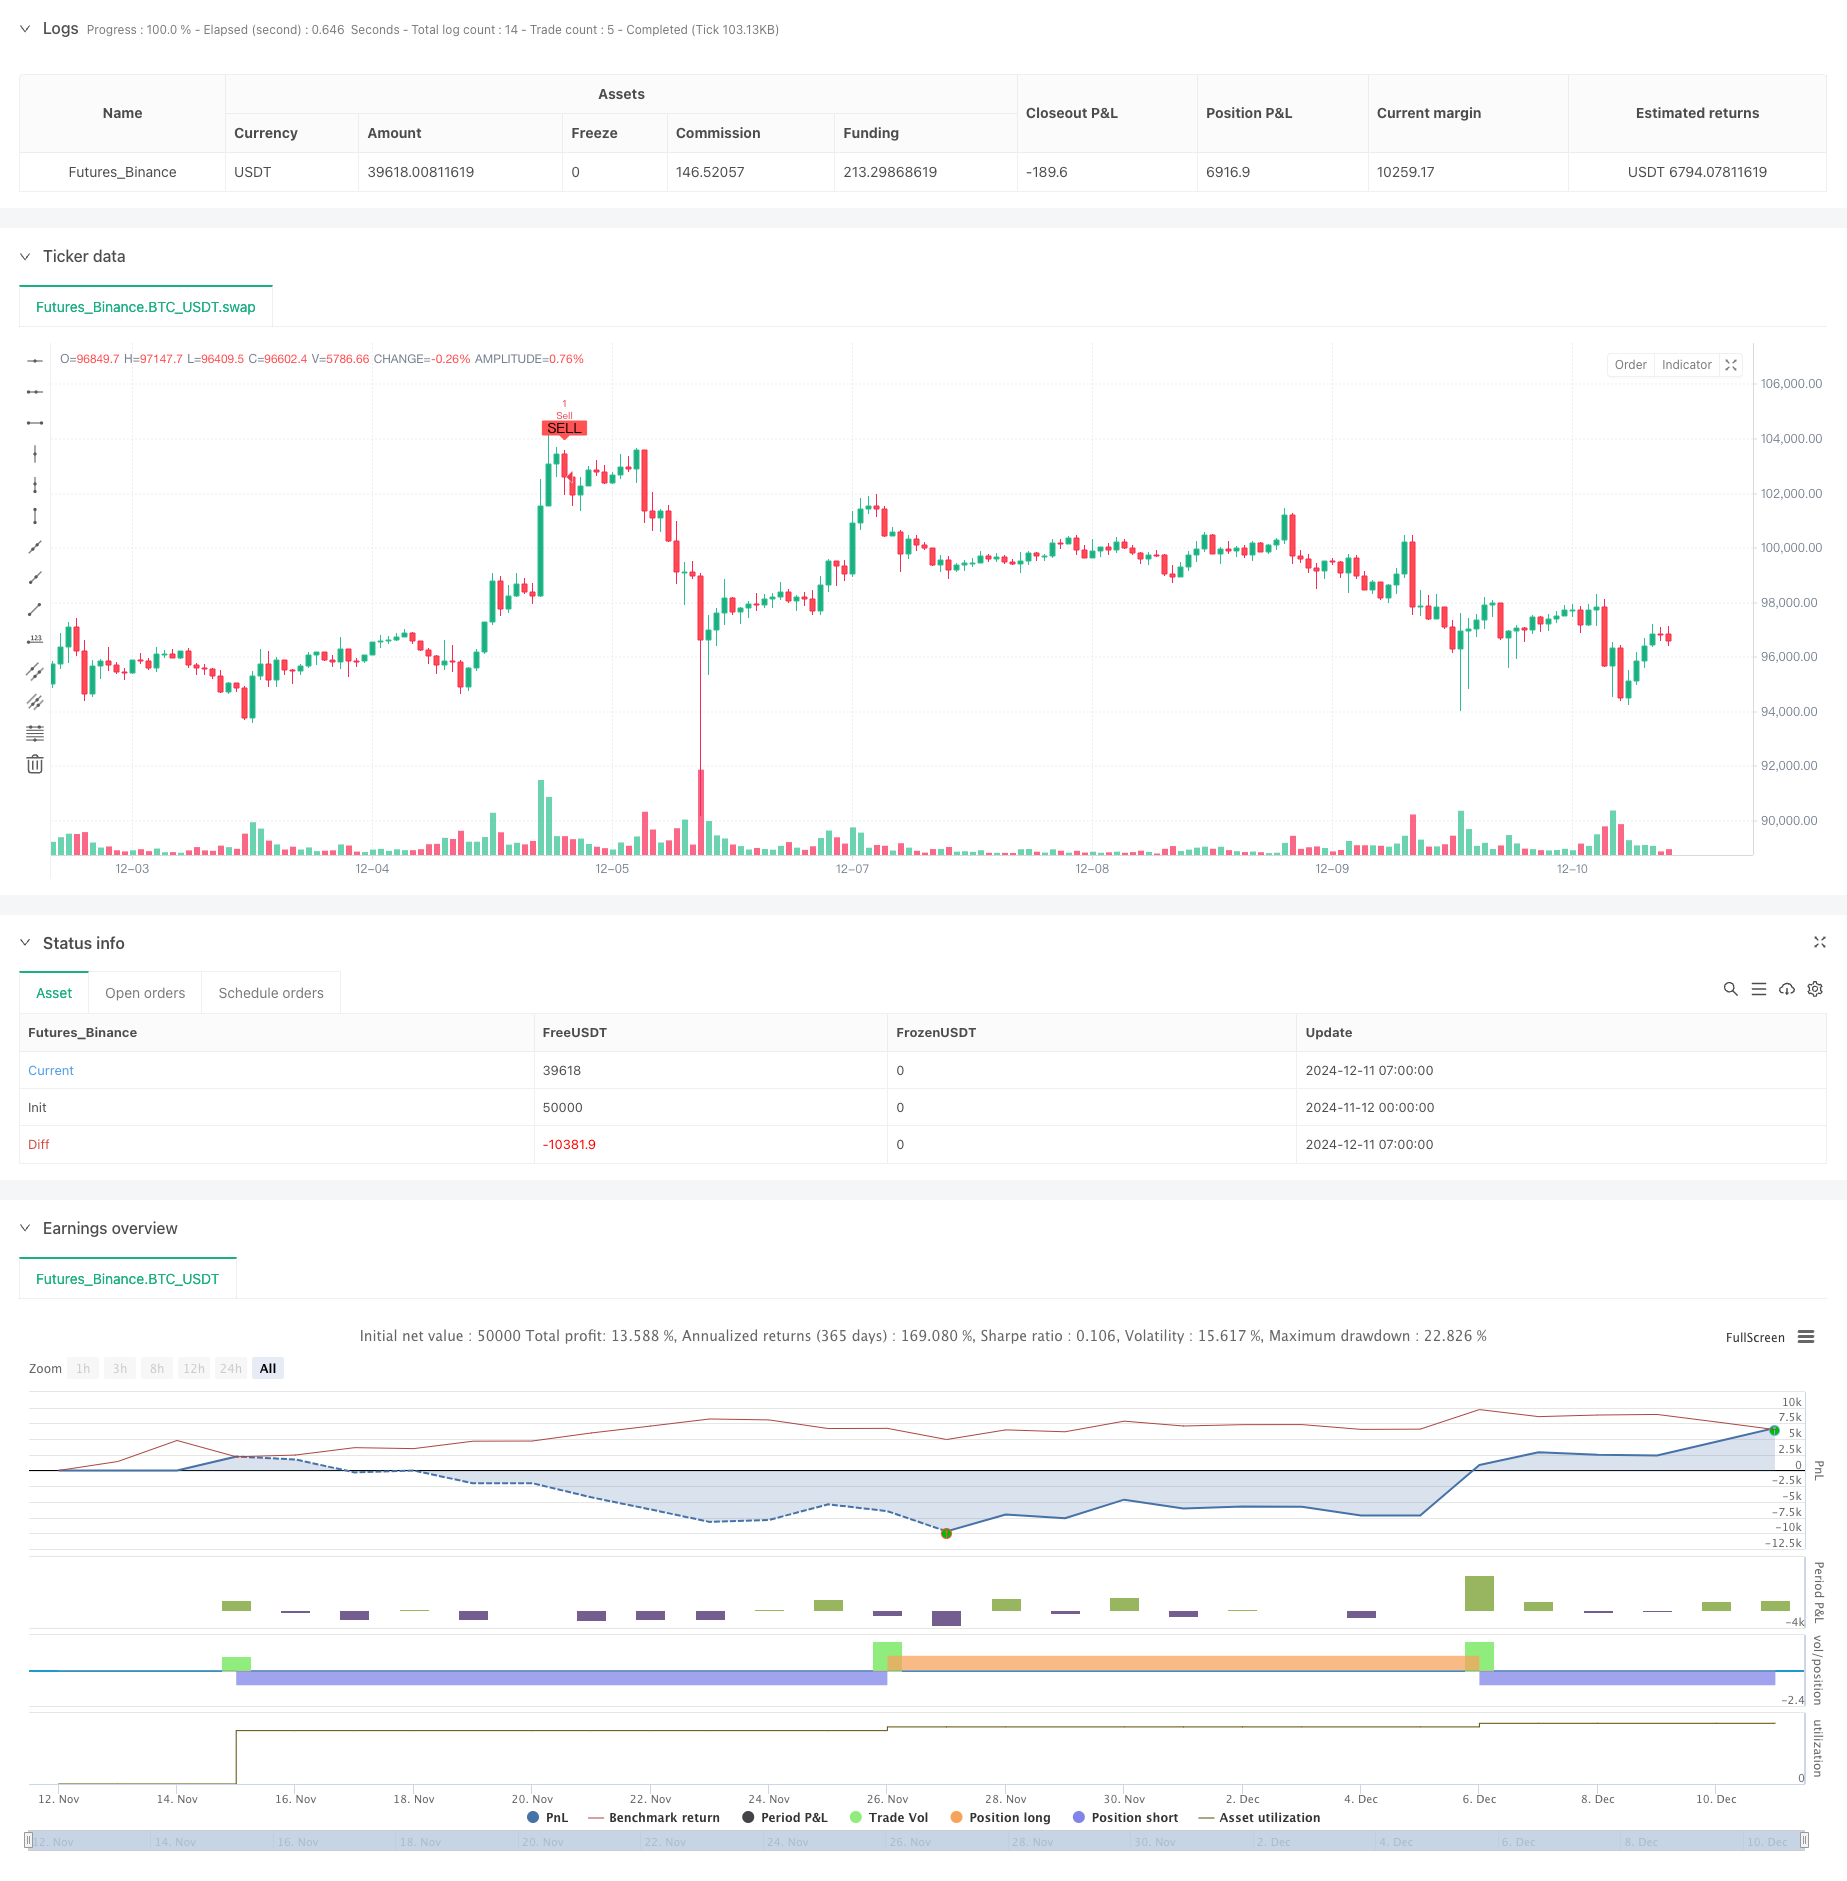
This is a quantitative trading strategy based on dual momentum breakthrough confirmation using Williams %R and Relative Strength Index (RSI). The strategy identifies trading signals through the cross-breakthrough of two momentum indicators, effectively reducing the risk of false breakouts. It seeks trading opportunities in overbought and oversold areas, improving trading accuracy through mutual confirmation of both indicators.
Strategy Principle
The strategy employs a 30-period Williams %R and 7-period RSI as primary indicators. A buy signal is triggered when Williams %R crosses above -80 and RSI simultaneously crosses above 20; a sell signal is generated when Williams %R crosses below -20 and RSI simultaneously crosses below 80. This dual confirmation mechanism effectively filters out potential false signals from single indicators. The strategy implements manual calculation of Williams %R by computing the highest and lowest prices within the period for more precise indicator values.
Strategy Advantages
- Dual confirmation mechanism significantly improves trading signal reliability
- Trading in overbought and oversold zones offers higher win rates and profit potential
- Indicator parameters can be flexibly adjusted for different market conditions
- Strategy logic is simple and clear, easy to understand and maintain
- Manual calculation of indicator values provides greater optimization potential
Strategy Risks
- May generate excessive trading signals in ranging markets
- Dual confirmation mechanism might lead to slightly delayed entry points
- Fixed overbought and oversold thresholds may need adjustment in different market environments
- Short-period RSI might be sensitive to price fluctuations
- Trading costs need to be considered for strategy profitability
Strategy Optimization Directions
- Introduce trend filters to avoid counter-trend trading in strong trend markets
- Add trailing stop-loss mechanisms to protect existing profits
- Develop adaptive overbought and oversold threshold calculation methods
- Optimize period parameter combinations for Williams %R and RSI
- Consider adding volume indicators as auxiliary confirmation signals
Summary
The strategy constructs a robust trading system through the synergy of Williams %R and RSI. The dual momentum confirmation mechanism effectively reduces false signal risks, while trading in overbought and oversold zones offers good profit potential. Through proper risk control and continuous optimization, the strategy can maintain stable performance across different market environments.
/*backtest
start: 2024-11-12 00:00:00
end: 2024-12-11 08:00:00
period: 1h
basePeriod: 1h
exchanges: [{"eid":"Futures_Binance","currency":"BTC_USDT"}]
*/

//@version=5
strategy("Williams %R + RSI Strategy", overlay=true)

// Inputs for Williams %R
wpr_length = input.int(30, title="Williams %R Length", minval=1)
wpr_upper = input.int(-20, title="Williams %R Upper Band", minval=-100, maxval=0)
wpr_lower = input.int(-80, title="Williams %R Lower Band", minval=-100, maxval=0)

// Inputs for RSI
rsi_length = input.int(7, title="RSI Length", minval=1)
rsi_upper = input.int(80, title="RSI Upper Band", minval=0, maxval=100)
rsi_lower = input.int(20, title="RSI Lower Band", minval=0, maxval=100)

// Calculate Williams %R Manually
highest_high = ta.highest(high, wpr_length)
lowest_low = ta.lowest(low, wpr_length)
wpr = ((highest_high - close) / (highest_high - lowest_low)) * -100

// Calculate RSI
rsi = ta.rsi(close, rsi_length)

// Entry and Exit Conditions
longCondition = ta.crossover(wpr, wpr_lower) and ta.crossover(rsi, rsi_lower)
shortCondition = ta.crossunder(wpr, wpr_upper) and ta.crossunder(rsi, rsi_upper)

// Plot Buy/Sell Signals
plotshape(series=longCondition, title="Buy Signal", location=location.belowbar, color=color.green, style=shape.labelup, text="BUY")
plotshape(series=shortCondition, title="Sell Signal", location=location.abovebar, color=color.red, style=shape.labeldown, text="SELL")

// Strategy Entry and Exit
if (longCondition)
    strategy.entry("Buy", strategy.long)

if (shortCondition)
    strategy.entry("Sell", strategy.short)
- Multi-Indicator Intelligent Pyramiding Strategy
- Adaptive Range Volatility Trend Following Trading Strategy
- RSI Direction Change Strategy
- Relative Strength Index - Divergences - Libertus
- High-Frequency Reversal Trading Strategy Based on Momentum RSI Indicator
- RSI Momentum Divergence Breakout Strategy
- RSI Relative Strength Index Strategy
- RSI Dynamic Range Reversal Quantitative Strategy with Volatility Optimization Model
- RSI+Supertrend Trend-Following Trading Strategy
- RSI statistical strategies for leverage
- Multi-Indicator Synergistic Trend Following Strategy with Dynamic Stop-Loss System
- Bollinger Bands Momentum Breakout Adaptive Trend Following Strategy
- Enhanced Mean Reversion Strategy with MACD-ATR Implementation
- Quantitative Trading Signal Tracking and Multi-Exit Strategy Optimization System
- Dual Moving Average and MACD Combined Trend Following Dynamic Take Profit Smart Trading System
- Triple Standard Deviation Bollinger Bands Breakout Strategy with 100-Day Moving Average Optimization
- Dynamic EMA Trend Crossover Entry Quantitative Strategy
- Multi-Wave Trend Crossing Risk Management Quantitative Strategy
- Dual EMA Stochastic Trend Following Trading Strategy
- Dynamic Trend Following Multi-Period Moving Average Crossover Strategy
- MACD-RSI Trend Momentum Cross Strategy with Risk Management Model
- Multi-Period EMA Crossover with RSI Momentum and ATR Volatility Based Trend Following Strategy
- Dual EMA Crossover Strategy with Smart Risk-Reward Control
- Multi-Moving Average Trend Following Strategy - Long-term Investment Signal System Based on EMA and SMA Indicators
- Historical High Breakthrough with Monthly Moving Average Filter Trend Following Strategy
- Multi-Equilibrium Price Trend Following and Reversal Trading Strategy
- Dynamic Volatility Index (VIDYA) with ATR Trend-Following Reversal Strategy
- Multi-Indicator Adaptive Trading Strategy Based on RSI, MACD and Volume
- Price Pattern Based Double Bottom and Top Automated Trading Strategy
- Dynamic ATR Trend Following Strategy Based on Support Breakout