概述
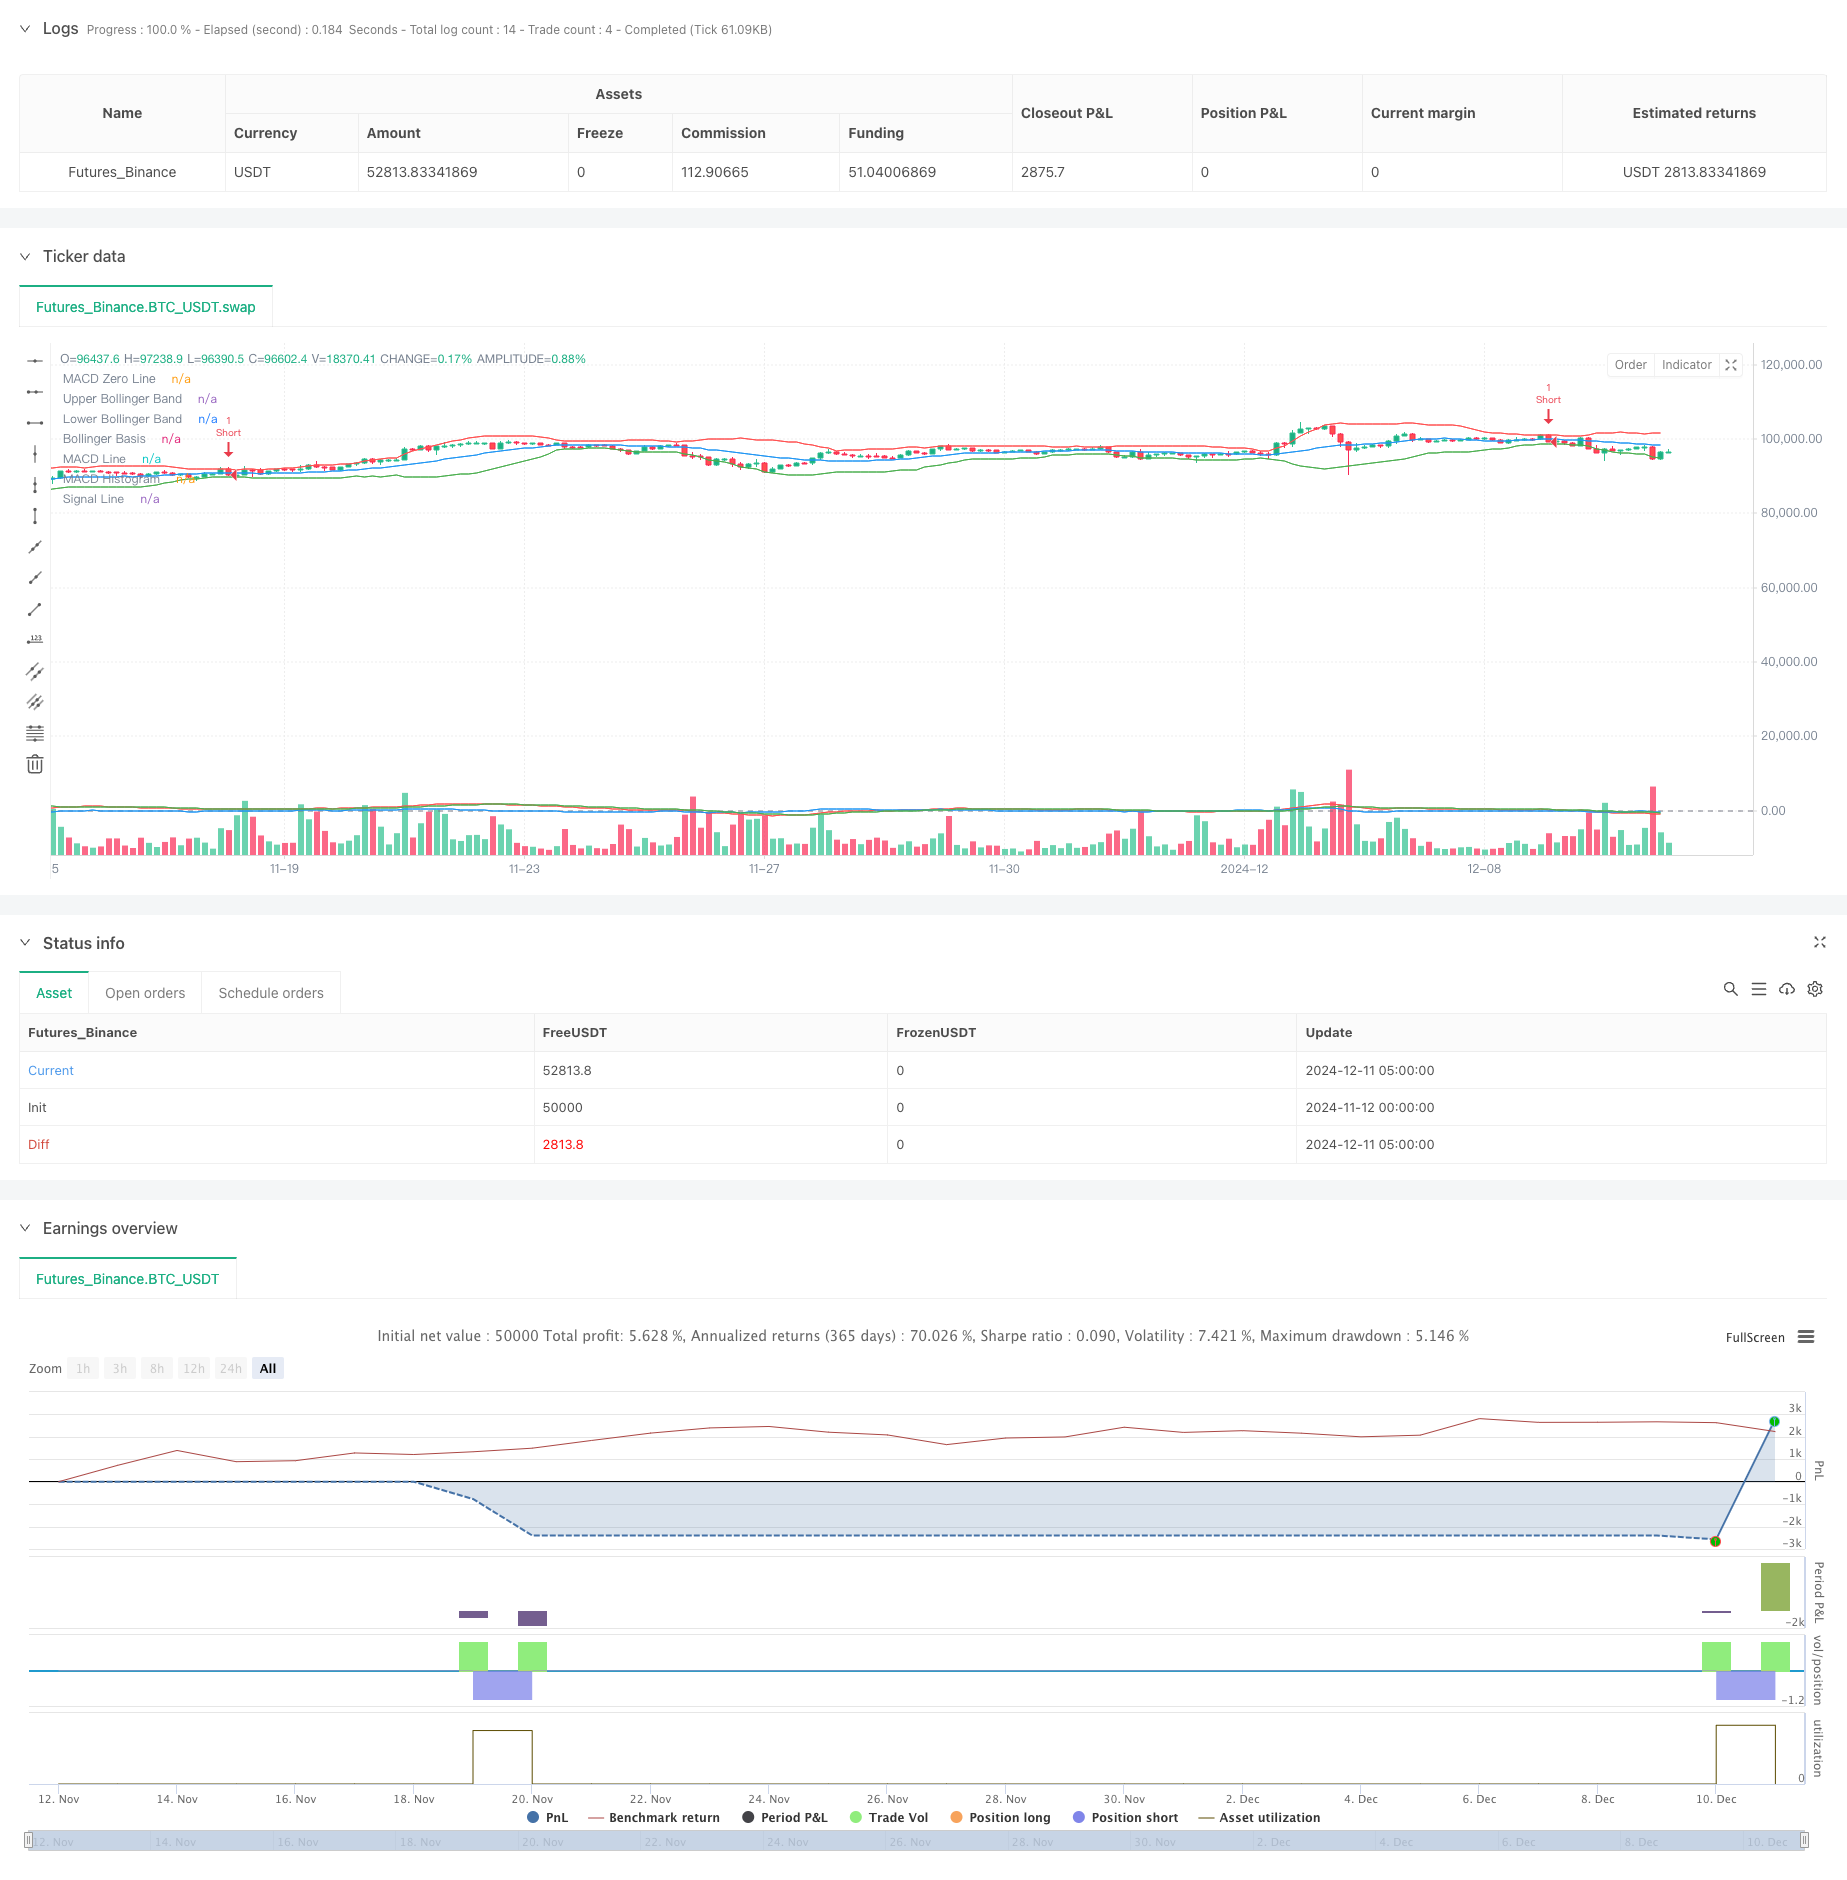
本策略是一个结合均值回归原理与技术指标MACD和ATR的量化交易系统。该策略通过布林带(Bollinger Bands)识别价格偏离,利用MACD确认动量,并结合ATR进行动态风险管理。策略的核心思想是在价格出现显著偏离时,通过多重技术指标的验证来捕捉价格回归的机会。
策略原理
策略采用三重技术指标协同工作的方式:首先,通过布林带上下轨判断价格是否出现显著偏离;其次,使用MACD指标验证价格动量,确保交易方向与市场趋势一致;最后,引入ATR指标来设置动态的止损和获利位置。具体而言,当价格突破布林带下轨且MACD线在信号线上方时,系统产生做多信号;当价格突破布林带上轨且MACD线在信号线下方时,系统产生做空信号。ATR则用于根据市场波动性动态调整止损和获利水平。
策略优势
- 多维度信号确认机制大大降低了假突破带来的风险
- 动态的止损和获利设置使策略能更好地适应市场波动
- 结合均值回归和趋势跟踪的特点,既能捕捉短期机会又不会错过大趋势
- 策略参数可根据不同市场环境灵活调整,适应性强
- 具备完整的风险管理机制,能有效控制回撤
策略风险
- 在剧烈震荡市场中可能频繁触发止损
- 参数优化过度可能导致过拟合风险
- 多重指标使用可能造成信号滞后
- 在趋势市场中,均值回归假设可能失效
- 止损位设置不当可能影响整体收益率
策略优化方向
- 引入自适应的布林带参数,使其能根据市场波动状态自动调整
- 增加市场环境识别模块,在不同市场条件下使用不同的参数组合
- 优化MACD参数设置,提高信号的及时性和准确性
- 完善止损策略,考虑加入追踪止损机制
- 考虑结合时间周期分析,在不同时间框架下验证信号有效性
总结
这是一个将经典技术分析与现代量化交易方法相结合的策略。通过多重指标的配合使用,既保留了均值回归策略的核心优势,又克服了单一指标的局限性。策略的可扩展性强,通过参数优化和功能模块的添加,能够不断提升其在不同市场环境下的表现。同时,完善的风险控制机制确保了策略的稳定性。
策略源码
/*backtest
start: 2024-11-12 00:00:00
end: 2024-12-11 08:00:00
period: 3h
basePeriod: 3h
exchanges: [{"eid":"Futures_Binance","currency":"BTC_USDT"}]
*/

//@version=5
strategy("Enhanced Mean Reversion with MACD and ATR", overlay=true)

// Nastavenia Bollinger Bands
bbLength = input(20, title="Bollinger Bands Length")
bbMult = input(2, title="Bollinger Bands Multiplier")
basis = ta.sma(close, bbLength)
dev = ta.stdev(close, bbLength)
upperBand = basis + bbMult * dev
lowerBand = basis - bbMult * dev

// MACD indikátor
macdShort = input(12, title="MACD Short Length")
macdLong = input(26, title="MACD Long Length")
macdSignal = input(9, title="MACD Signal Length")
[macdLine, signalLine, _] = ta.macd(close, macdShort, macdLong, macdSignal)

// ATR pre dynamický Stop Loss a Take Profit
atrLength = input(14, title="ATR Length")
atrMultiplier = input(1.5, title="ATR Multiplier")
atrValue = ta.atr(atrLength)

// Vstupné podmienky pre long pozície
longCondition = ta.crossover(close, lowerBand) and macdLine > signalLine
if (longCondition)
    strategy.entry("Long", strategy.long)

// Vstupné podmienky pre short pozície
shortCondition = ta.crossunder(close, upperBand) and macdLine < signalLine
if (shortCondition)
    strategy.entry("Short", strategy.short)

// Dynamický Stop Loss a Take Profit na základe ATR
longSL = strategy.position_avg_price - atrValue * atrMultiplier
longTP = strategy.position_avg_price + atrValue * atrMultiplier * 2
shortSL = strategy.position_avg_price + atrValue * atrMultiplier
shortTP = strategy.position_avg_price - atrValue * atrMultiplier * 2

// Pridanie stop loss a take profit
if (strategy.position_size > 0)
    strategy.exit("Take Profit/Stop Loss", "Long", stop=longSL, limit=longTP)

if (strategy.position_size < 0)
    strategy.exit("Take Profit/Stop Loss", "Short", stop=shortSL, limit=shortTP)

// Vizualizácia Bollinger Bands a MACD
plot(upperBand, color=color.red, title="Upper Bollinger Band")
plot(lowerBand, color=color.green, title="Lower Bollinger Band")
plot(basis, color=color.blue, title="Bollinger Basis")

hline(0, "MACD Zero Line", color=color.gray)
plot(macdLine - signalLine, color=color.blue, title="MACD Histogram")
plot(macdLine, color=color.red, title="MACD Line")
plot(signalLine, color=color.green, title="Signal Line")

// Generovanie alertov
alertcondition(longCondition, title="Long Alert", message="Long Entry Signal")
alertcondition(shortCondition, title="Short Alert", message="Short Entry Signal")
相关推荐