Multi-Teknis Indikator Crossover Momentum Trend Mengikuti Strategi
Penulis:ChaoZhang, Tanggal: 2025-01-17 16:26:13Tag:RSIWMAEMA

Gambaran umum
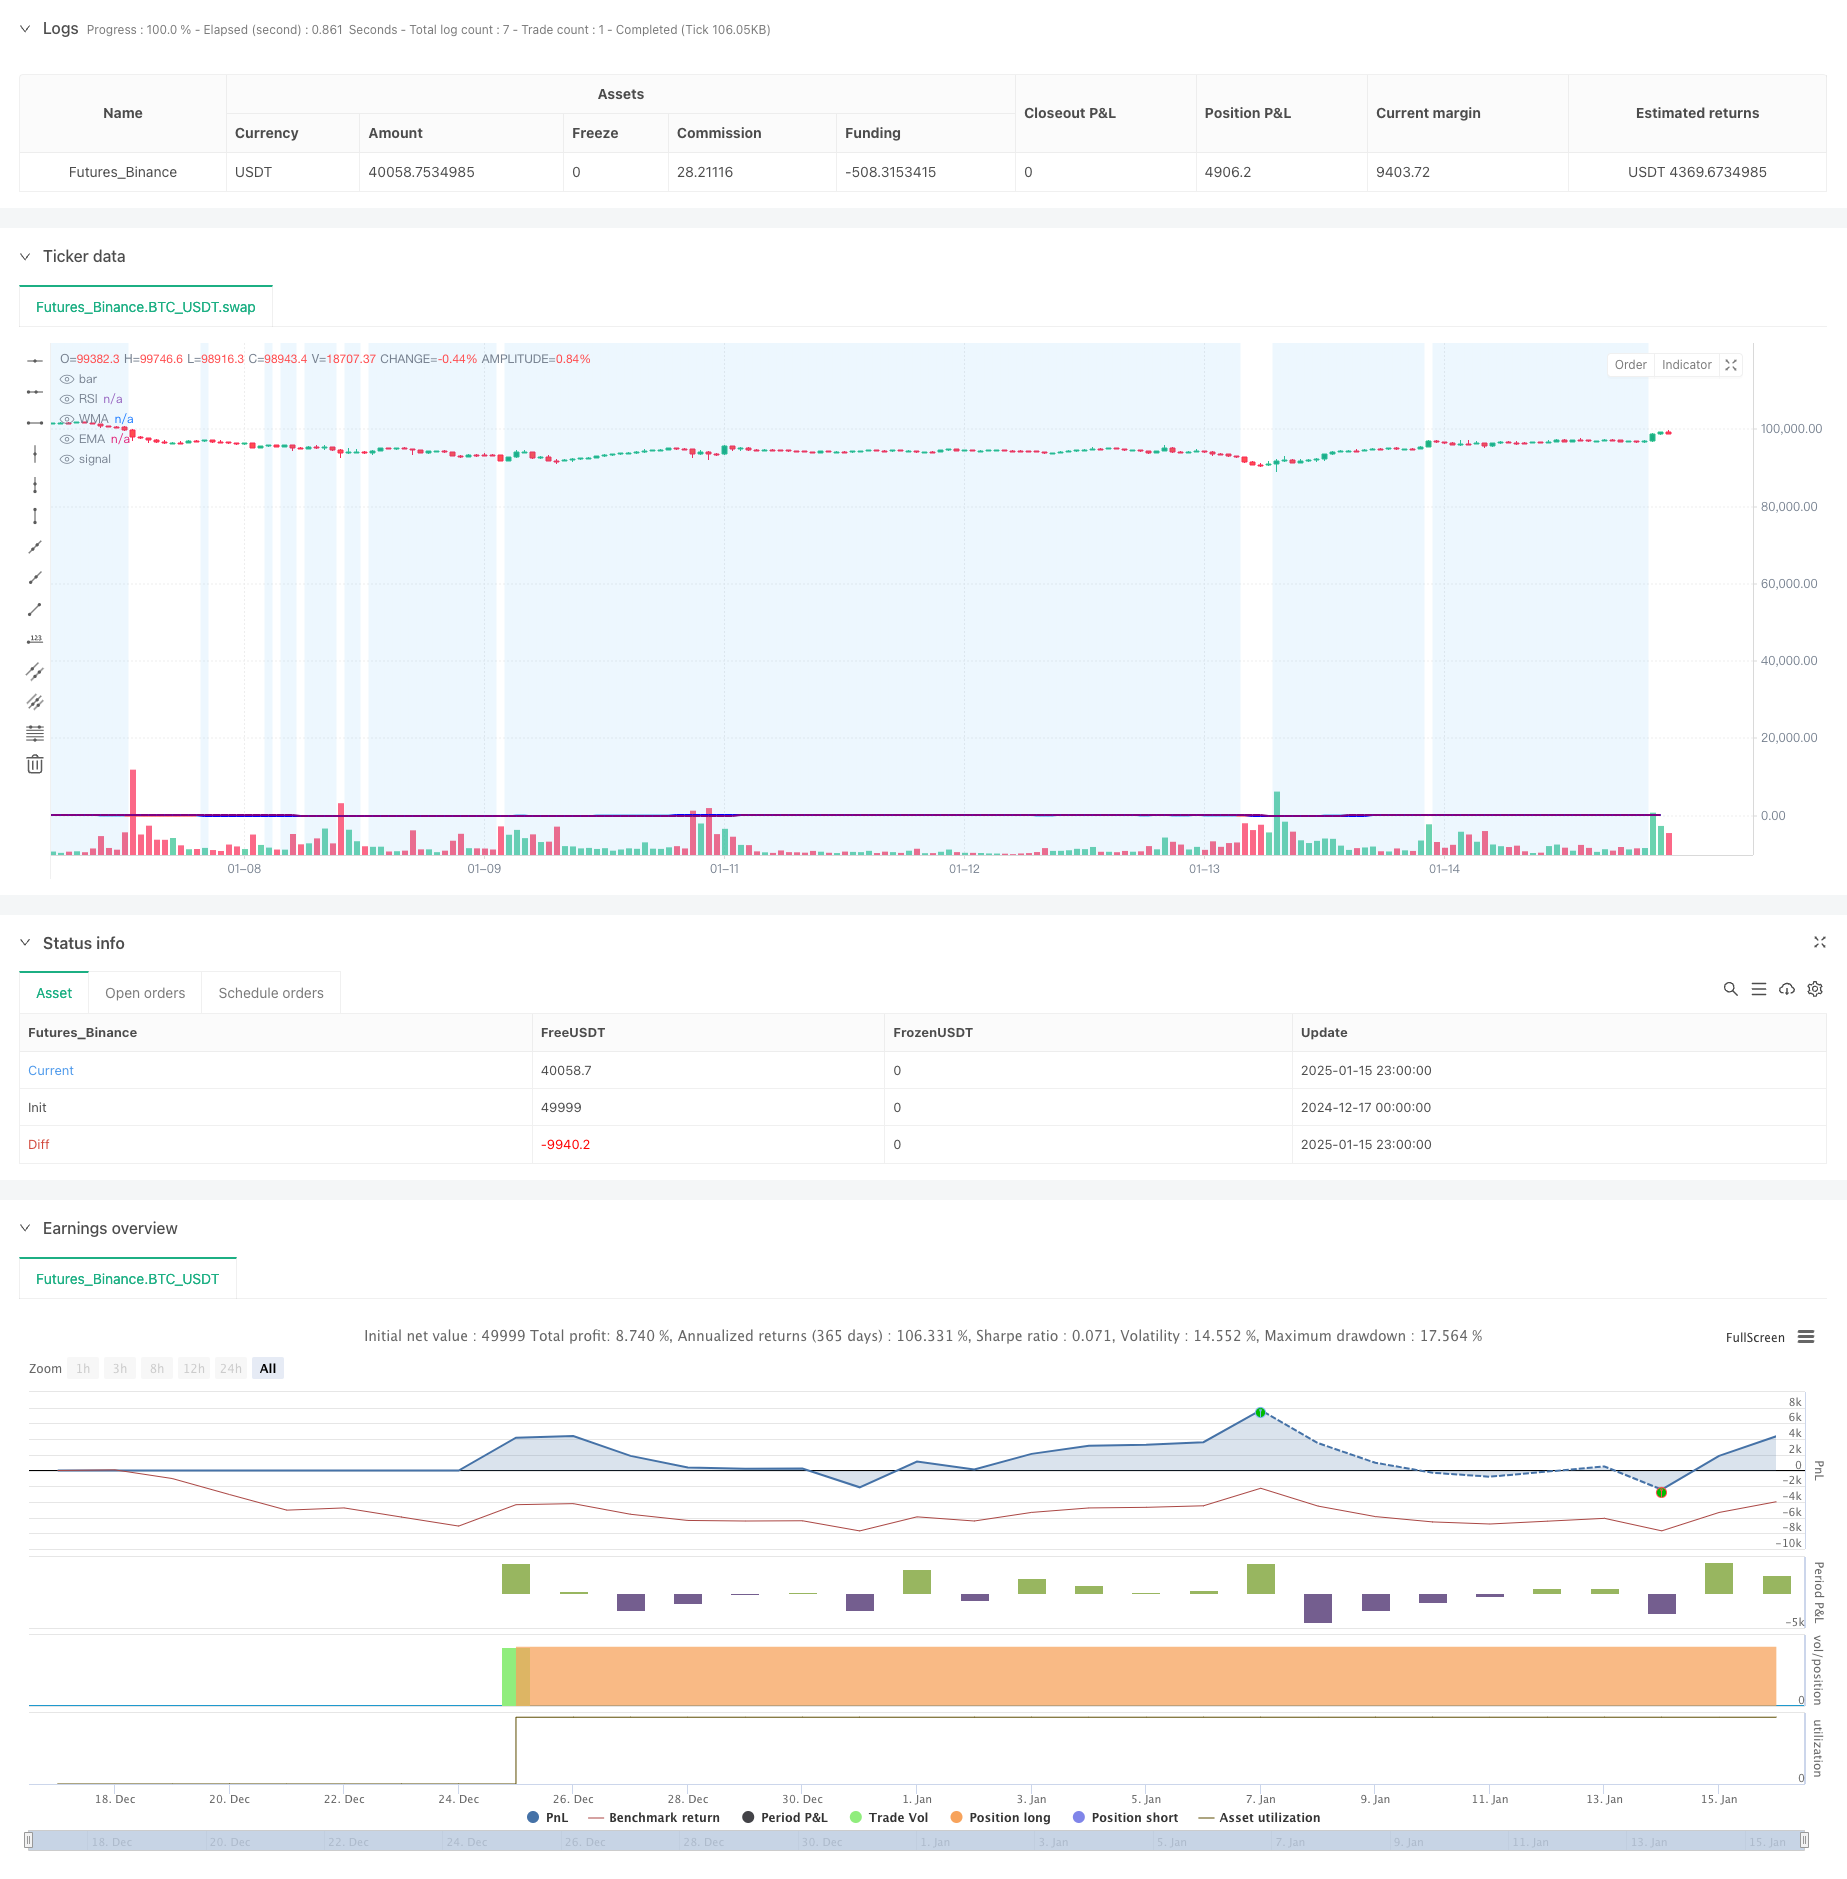
Strategi ini adalah sistem perdagangan yang menggabungkan Indeks Kekuatan Relatif (RSI), Rata-rata Gerak Berimbang (WMA), dan Rata-rata Gerak Eksponensial (EMA). Dengan memanfaatkan beberapa indikator teknis, strategi ini menangkap perubahan momentum pasar pada titik pembalikan tren untuk menghasilkan sinyal perdagangan. Sistem ini menggunakan WMA dan EMA crossover untuk mengkonfirmasi arah tren sambil menggabungkan RSI untuk menyaring kondisi pasar untuk peningkatan akurasi perdagangan.
Prinsip Strategi
Logika inti dari strategi ini didasarkan pada elemen kunci berikut: 1. Perhitungan RSI menggunakan pengaturan 14 periode untuk mengukur kondisi pasar overbought/oversold 2. WMA 45 periode dan EMA 89 periode crossover mengkonfirmasi transisi tren Ketentuan masuk: - Sinyal panjang: WMA melintasi di atas EMA dan RSI<50 - Sinyal pendek: WMA melintasi di bawah EMA dan RSI>50 Sistem memvisualisasikan kondisi pasar melalui perubahan warna RSI, menunjukkan hijau ketika RSI> 70 dan merah ketika RSI < 30 5. Latar belakang biru diatur dalam kisaran RSI 30-70 untuk membantu mengidentifikasi zona netral
Keuntungan Strategi
- Kombinasi dari beberapa indikator teknis meningkatkan keandalan sinyal perdagangan
- WMA lebih sensitif terhadap perubahan harga terbaru sementara EMA mempertahankan pelacakan tren jangka panjang
- RSI sebagai filter secara efektif mencegah sinyal palsu di pasar yang terlalu volatile
- Desain antarmuka visual membantu pedagang secara intuitif menilai kondisi pasar
- Termasuk sistem peringatan lengkap untuk memberi tahu pedagang tentang peluang perdagangan potensial
Risiko Strategi
- Dapat menghasilkan sinyal pecah palsu yang sering di pasar sampingan
- Rata-rata bergerak
sifat lag mungkin menyebabkan keterlambatan sedikit entri - Batas RSI tetap mungkin tidak cocok untuk semua lingkungan pasar
- Kurangnya pertimbangan volatilitas dapat meningkatkan risiko selama periode volatilitas tinggi
- Kurangnya mekanisme stop loss dan take profit dapat mempengaruhi efektivitas pengelolaan uang
Arah Optimasi Strategi
- Memperkenalkan ambang batas RSI adaptif yang menyesuaikan secara dinamis berdasarkan volatilitas pasar
- Tambahkan indikator ATR untuk ukuran posisi dan pengaturan stop-loss dinamis
- Mengoptimalkan periode WMA dan EMA, mempertimbangkan penyesuaian untuk kerangka waktu yang berbeda
- Tambahkan indikator volume sebagai sinyal konfirmasi
- Mengimplementasikan sistem manajemen posisi yang lebih canggih, seperti skala gaya piramida
Ringkasan
Ini adalah strategi mengikuti tren berdasarkan beberapa indikator teknis, menggabungkan RSI, WMA, dan EMA untuk menangkap titik pembalikan tren pasar sambil menjaga stabilitas perdagangan.
/*backtest
start: 2024-12-17 00:00:00
end: 2025-01-16 00:00:00
period: 1h
basePeriod: 1h
exchanges: [{"eid":"Futures_Binance","currency":"BTC_USDT","balance":49999}]
*/

//@version=5
strategy(title="RSI + WMA + EMA Strategy", shorttitle="RSI Strategy", overlay=true)

// RSI Settings
rsiLengthInput = input.int(14, minval=1, title="RSI Length", group="RSI Settings")
rsiSourceInput = input.source(close, "Source", group="RSI Settings")

// WMA and EMA Settings
wmaLengthInput = input.int(45, minval=1, title="WMA Length", group="WMA Settings")
wmaColorInput = input.color(color.blue, title="WMA Color", group="WMA Settings")
emaLengthInput = input.int(89, minval=1, title="EMA Length", group="EMA Settings")
emaColorInput = input.color(color.purple, title="EMA Color", group="EMA Settings")

// RSI Calculation
change = ta.change(rsiSourceInput)
up = ta.rma(math.max(change, 0), rsiLengthInput)
down = ta.rma(-math.min(change, 0), rsiLengthInput)
rsi = down == 0 ? 100 : up == 0 ? 0 : 100 - (100 / (1 + up / down))

// WMA and EMA Calculation
wma = ta.wma(rsi, wmaLengthInput)
ema = ta.ema(rsi, emaLengthInput)

// RSI Color Logic
rsiColor = rsi > 70 ? color.new(color.green, 100 - math.round(rsi)) : rsi < 30 ? color.new(color.red, math.round(rsi)) : color.new(color.blue, 50)

// Plot RSI, WMA, and EMA
plot(rsi, "RSI", color=rsiColor)
plot(wma, title="WMA", color=wmaColorInput, linewidth=2)
plot(ema, title="EMA", color=emaColorInput, linewidth=2)

// Highlight RSI Area between 30 and 70
bgcolor(rsi >= 30 and rsi <= 70 ? color.new(color.blue, 90) : na)

// Entry and Exit Conditions
longCondition = ta.crossover(wma, ema) and rsi < 50
shortCondition = ta.crossunder(wma, ema) and rsi > 50

if (longCondition)
    strategy.entry("Long", strategy.long)
    alert("Buy Signal: WMA crossed above EMA, RSI < 50", alert.freq_once_per_bar)

if (shortCondition)
    strategy.entry("Short", strategy.short)
    alert("Sell Signal: WMA crossed below EMA, RSI > 50", alert.freq_once_per_bar)

// Optional: Plot Buy/Sell Signals on Chart
plotshape(series=longCondition, style=shape.labelup, location=location.belowbar, color=color.green, size=size.small, title="Buy Signal")
plotshape(series=shortCondition, style=shape.labeldown, location=location.abovebar, color=color.red, size=size.small, title="Sell Signal")
- Strategi penyeberangan Indikator RSI Tren Dinamis
- Strategi Swing Hull/rsi/EMA
- Scalping EMA ADX RSI dengan Buy/Sell
- Super Scalper - 5 menit 15 menit
- Strategi perdagangan kuantitatif RSI dinamis dengan crossover rata-rata bergerak ganda
- RSI dan strategi silang Fusion Stochastic
- Strategi Kombinasi RSI dan MA
- Strategi Perdagangan Kuantitatif Lanjutan Menggabungkan Divergensi RSI dan Rata-rata Bergerak
- RSI Dinamis Smart Timing Swing Trading Strategi
- Strategi perdagangan alami gabungan MACD dan RSI
- Sistem Strategi Kuantitatif Tren Momentum Dual-Indicator Dinamis
- Analisis Tren Multidimensional dengan Strategi Manajemen Hentian Dinamis Berbasis ATR
- Adaptive Bollinger Bands Mean-Reversion Trading Strategy
- Strategi perdagangan konfirmasi tren multi-indikator lanjutan
- Strategi Trading Trend Multi-Signal dengan Rata-rata Bergerak Ganda-RSI
- Adaptive Trend Following dan Multi-Confirmation Trading Strategy
- Sistem EMA Dinamis Dikombinasikan dengan Indikator Momentum RSI untuk Strategi Perdagangan Intraday yang Dioptimalkan
- Pengaturan Stop-Loss Dinamis Trend Elephant Bar Mengikuti Strategi
- Strategi Momentum Tren RSI Dua Periode dengan Sistem Manajemen Posisi Piramida
- Strategi Trading Multi-Timeframe Menggabungkan Pola Harmonik dan Williams %R
- Tren EMA dengan Strategi Perdagangan Breakout Angka Bulat
- Strategi perdagangan kuantitatif RSI dinamis dengan crossover rata-rata bergerak ganda
- Strategi penyeberangan Indikator RSI Tren Dinamis
- Algoritma KNN Multidimensional dengan Strategi Perdagangan Pola Lilin Volume-Harga
- Tren Crossover Dual Mengikuti Strategi: EMA dan Sistem Perdagangan Sinergis MACD
- Strategi Smart Trailing Stop berbasis SMA dengan Pengakuan Pola Intraday
- Adaptive Multi-Strategy Dynamic Switching System: Strategi Trading Kuantitatif Menggabungkan Trend Following dan Range Oscillation