概要
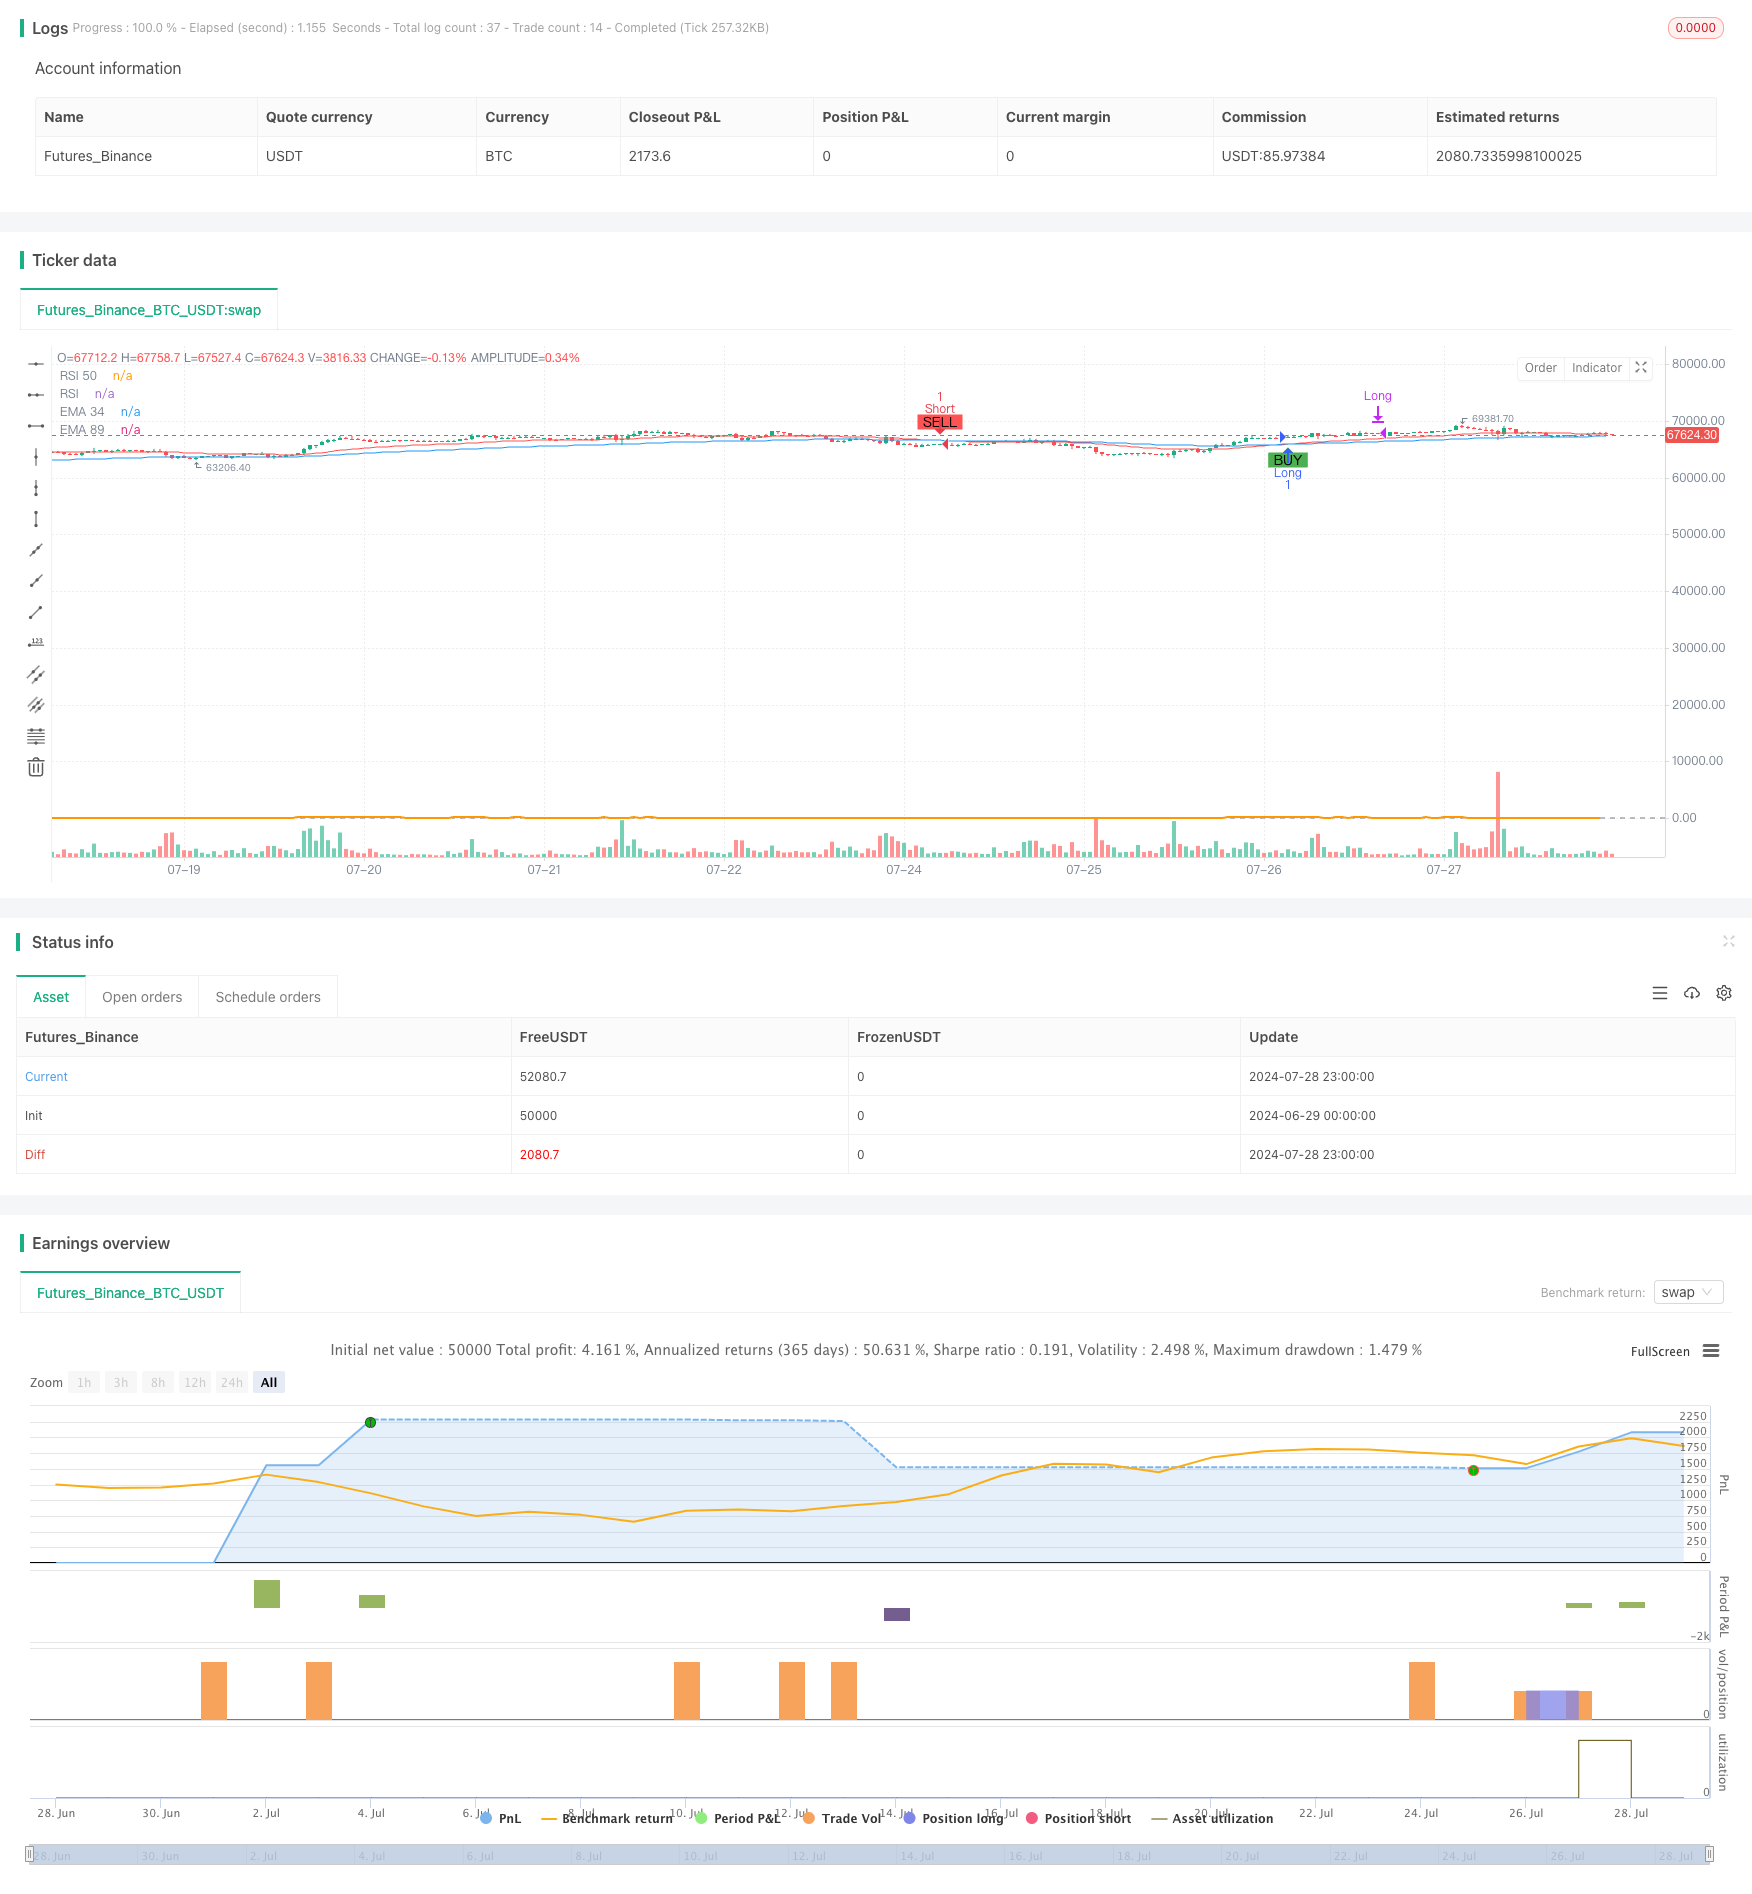
この戦略は,複数の技術指標に基づく総合的な取引システムであり,主に指数移動平均 ((EMA),相対的に強い指数 ((RSI) と取引量を用いて取引信号を生成し,ポジションを管理する.この戦略は,EMAを交差して市場のトレンドを決定し,同時にはRSIを用いて超買超売を判断し,取引量と組み合わせて信号の強さを確認する.さらに,戦略には,ダイナミックなストップ・ロスの仕組みと,リスクを制御し,取引パフォーマンスを最適化するために固定したポジション保持時間制限が含まれている.
戦略原則
トランジションシグナル生成:
- 多頭入場:EMA34でEMA89を着用し,RSIが30以上である
- 空頭入場:EMA34以下でEMA89を着用し,RSIは70未満
ダイナミック・ストップ・ストロー:
- 20K線平均取引量の3倍以上の取引量がある場合,ストップ・ストップ・ストップ価格を更新します.
- ストップ・ストップ・ロスの価格は,高取引量が発生した際の終了価格に設定されます.
固定ポジションの時間:
- ポジション開設後15K線を強制平仓にする
EMAのストップは
- EMA34を動的ストップラインとして使用
取引量確認:
- 高取引量条件を使用して信号の強さを確認し,ストップ・ストップ・価格を更新する
戦略的優位性
マルチ指標の協調性:EMA,RSI,取引量と組み合わせて,市場状況を全面的に分析し,信号の信頼性を向上させる.
ダイナミックなリスク管理:市場の波動に応じてリアルタイムでストップ・ストロスを調整し,異なる市場環境に適応する.
固定ポジション保持時間:長期にわたるポジションのリスクを回避し,各取引の暴露時間を制御する.
EMAダイナミックストップ:均線をダイナミックサポートレジスタンスとして利用し,より柔軟なストップ保護を提供します.
取引量確認:取引量突破を利用して信号の強さを確認し,取引の正確性を向上させる.
グラフに,買入シグナルと重要な価格レベルを表示し,分析と意思決定を容易にします.
戦略リスク
振動市場のリスク:横盤振動市場の場合,EMA交差は頻繁に偽信号を生成する可能性があります.
RSIの値が固定される: 固定されたRSIの値は,すべての市場環境には適用されない場合があります.
取引量値感度:平均取引量の3倍の値が過高または過低である可能性があり,特定の市場に応じて調整する必要がある.
固定ポジション保持時間制限:15根K線の固定平仓時間は,利益取引を早めに終了させる可能性があります.
ストップ・ストップ・損失価格設定:高取引量が発生した際に閉店価格がストップ・損失価格として最適化されていない可能性があります.
戦略最適化の方向性
ダイナミックなRSIの値: RSIの超買い超売り値が,市場の変動に応じて自動的に調整される.
取引量の減值を最適化:自己適応メカニズムを導入し,取引量の突破倍数を歴史的なデータに基づいて動的に調整する.
ポジション保持時間管理の改善:トレンドの強さと収益性の状況に合わせて,最大ポジション保持時間を動的に調整する.
ストップ・ストップ・ロスの設定を最適化:ATR指標の導入を検討し,市場の変動動向に応じてストップ・ストップ・価格を設定する.
トレンドフィルターを追加:長周期EMAまたはトレンド指標を導入し,主要トレンドの反対方向での取引を避ける.
価格行動分析の導入:K線形状とサポートレジスタンスレベルを組み合わせて,入場と出場の精度を向上させる.
撤回コントロールの追加を検討:最大撤回制限を設定し,特定の撤回レベルに達したときに強制的に平仓する.
要約する
この多指標の総合的なダイナミックな取引戦略は,EMA,RSI,取引量と組み合わせて,包括的な取引システムを作成します. それは,市場トレンドを捉えるだけでなく,ダイナミックなストップ・ロスと固定したポジション時間を介してリスクを管理することができます. この戦略の優点は,多次元的な分析と柔軟なリスク管理にあります. しかし,同時に,市場環境の変化による挑戦に直面しています.
/*backtest
start: 2024-06-29 00:00:00
end: 2024-07-29 00:00:00
period: 1h
basePeriod: 15m
exchanges: [{"eid":"Futures_Binance","currency":"BTC_USDT"}]
*/

//@version=5
strategy("EMA & RSI Strategy", overlay=true)

// Install indicators
ema34 = ta.ema(close, 34)
ema89 = ta.ema(close, 89)
ema54 = ta.ema(close, 54)
ema150 = ta.ema(close, 150)
rsi = ta.rsi(close, 14)

// Draw indicator
plot(ema34, color=color.red, title="EMA 34")
plot(ema89, color=color.blue, title="EMA 89")
//plot(ema54, color=color.green, title="EMA 54")
//plot(ema150, color=color.yellow, title="EMA 150")
hline(50, "RSI 50", color=color.gray)
plot(rsi, title="RSI", color=color.orange, linewidth=2, offset=-1)

// condition long or short
longCondition = ta.crossover(ema34, ema89) and rsi > 30
shortCondition = ta.crossunder(ema34, ema89) and rsi < 70

// Add strategy long
if (longCondition)
    strategy.entry("Long", strategy.long)

// Add strategy short
if (shortCondition)
    strategy.entry("Short", strategy.short)

// Calculate the average volume of previous candles
length = 20 // Number of candles to calculate average volume
avgVolume = ta.sma(volume, length)
highVolumeCondition = volume > 3 * avgVolume

// Determine take profit and stop loss prices when there is high volume
var float takeProfitPriceLong = na
var float stopLossPriceLong = na
var float takeProfitPriceShort = na
var float stopLossPriceShort = na

if (longCondition)
    takeProfitPriceLong := na
    stopLossPriceLong := na

if (shortCondition)
    takeProfitPriceShort := na
    stopLossPriceShort := na

// Update take profit and stop loss prices when volume is high
if (strategy.opentrades.entry_id(0) == "Long" and highVolumeCondition)
    takeProfitPriceLong := close
    stopLossPriceLong := close

if (strategy.opentrades.entry_id(0) == "Short" and highVolumeCondition)
    takeProfitPriceShort := close
    stopLossPriceShort := close

// Execute exit orders for buy and sell orders when there is high volume
if (not na(takeProfitPriceLong))
    strategy.exit("Take Profit Long", from_entry="Long", limit=takeProfitPriceLong, stop=stopLossPriceLong)

if (not na(takeProfitPriceShort))
    strategy.exit("Take Profit Short", from_entry="Short", limit=takeProfitPriceShort, stop=stopLossPriceShort)

// Track the number of candles since the order was opened
var int barsSinceEntryLong = na
var int barsSinceEntryShort = na
var bool longPositionClosed = false
var bool shortPositionClosed = false

if (longCondition)
    barsSinceEntryLong := 0
    longPositionClosed := false
if (shortCondition)
    barsSinceEntryShort := 0
    shortPositionClosed := false

if (strategy.opentrades.entry_id(0) == "Long")
    barsSinceEntryLong := barsSinceEntryLong + 1

if (strategy.opentrades.entry_id(0) == "Short")
    barsSinceEntryShort := barsSinceEntryShort + 1

// Check the conditions to close the order at the 15th candle
if (strategy.opentrades.entry_id(0) == "Long" and barsSinceEntryLong >= 15 and not longPositionClosed)
    strategy.close("Long")
    longPositionClosed := true

if (strategy.opentrades.entry_id(0) == "Short" and barsSinceEntryShort >= 15 and not shortPositionClosed)
    strategy.close("Short")
    shortPositionClosed := true

// Thêm stop loss theo EMA34
if (strategy.opentrades.entry_id(0) == "Long")
    strategy.exit("Stop Loss Long", from_entry="Long", stop=ema34)
if (strategy.opentrades.entry_id(0) == "Short")
    strategy.exit("Stop Loss Short", from_entry="Short", stop=ema34)

// Displays buy/sell signals and price levels on the chart
plotshape(series=longCondition, location=location.belowbar, color=color.green, style=shape.labelup, text="BUY")
plotshape(series=shortCondition, location=location.abovebar, color=color.red, style=shape.labeldown, text="SELL")

// Displays take profit and stop loss prices on the chart
// var line takeProfitLineLong = na
// var line stopLossLineLong = na
// var line takeProfitLineShort = na
// var line stopLossLineShort = na

// if (not na(takeProfitPriceLong))
//     if na(takeProfitLineLong)
//         takeProfitLineLong := line.new(x1=bar_index, y1=takeProfitPriceLong, x2=bar_index + 1, y2=takeProfitPriceLong, color=color.blue, width=1, style=line.style_dashed)
//     else
//         line.set_xy1(takeProfitLineLong, x=bar_index, y=takeProfitPriceLong)
//         line.set_xy2(takeProfitLineLong, x=bar_index + 1, y=takeProfitPriceLong)

// if (not na(stopLossPriceLong))
//     if na(stopLossLineLong)
//         stopLossLineLong := line.new(x1=bar_index, y1=stopLossPriceLong, x2=bar_index + 1, y2=stopLossPriceLong, color=color.red, width=1, style=line.style_dashed)
//     else
//         line.set_xy1(stopLossLineLong, x=bar_index, y=stopLossPriceLong)
//         line.set_xy2(stopLossLineLong, x=bar_index + 1, y=stopLossPriceLong)

// if (not na(takeProfitPriceShort))
//     if na(takeProfitLineShort)
//         takeProfitLineShort := line.new(x1=bar_index, y1=takeProfitPriceShort, x2=bar_index + 1, y2=takeProfitPriceShort, color=color.blue, width=1, style=line.style_dashed)
//     else
//         line.set_xy1(takeProfitLineShort, x=bar_index, y=takeProfitPriceShort)
//         line.set_xy2(takeProfitLineShort, x=bar_index + 1, y=takeProfitPriceShort)

// if (not na(stopLossPriceShort))
//     if na(stopLossLineShort)
//         stopLossLineShort := line.new(x1=bar_index, y1=stopLossPriceShort, x2=bar_index + 1, y2=stopLossPriceShort, color=color.red, width=1, style=line.style_dashed)
//     else
//         line.set_xy1(stopLossLineShort, x=bar_index, y=stopLossPriceShort)
//         line.set_xy2(stopLossLineShort, x=bar_index + 1, y=stopLossPriceShort)

// // Shows annotations for take profit and stop loss prices
// if (not na(takeProfitPriceLong))
//     label.new(x=bar_index, y=takeProfitPriceLong, text="TP Long", style=label.style_label_down, color=color.blue, textcolor=color.white)
// if (not na(stopLossPriceLong))
//     label.new(x=bar_index, y=stopLossPriceLong, text="SL Long", style=label.style_label_up, color=color.red, textcolor=color.white)
// if (not na(takeProfitPriceShort))
//     label.new(x=bar_index, y=takeProfitPriceShort, text="TP Short", style=label.style_label_up, color=color.blue, textcolor=color.white)
// if (not na(stopLossPriceShort))
//     label.new(x=bar_index, y=stopLossPriceShort, text="SL Short", style=label.style_label_down, color=color.red, textcolor=color.white)