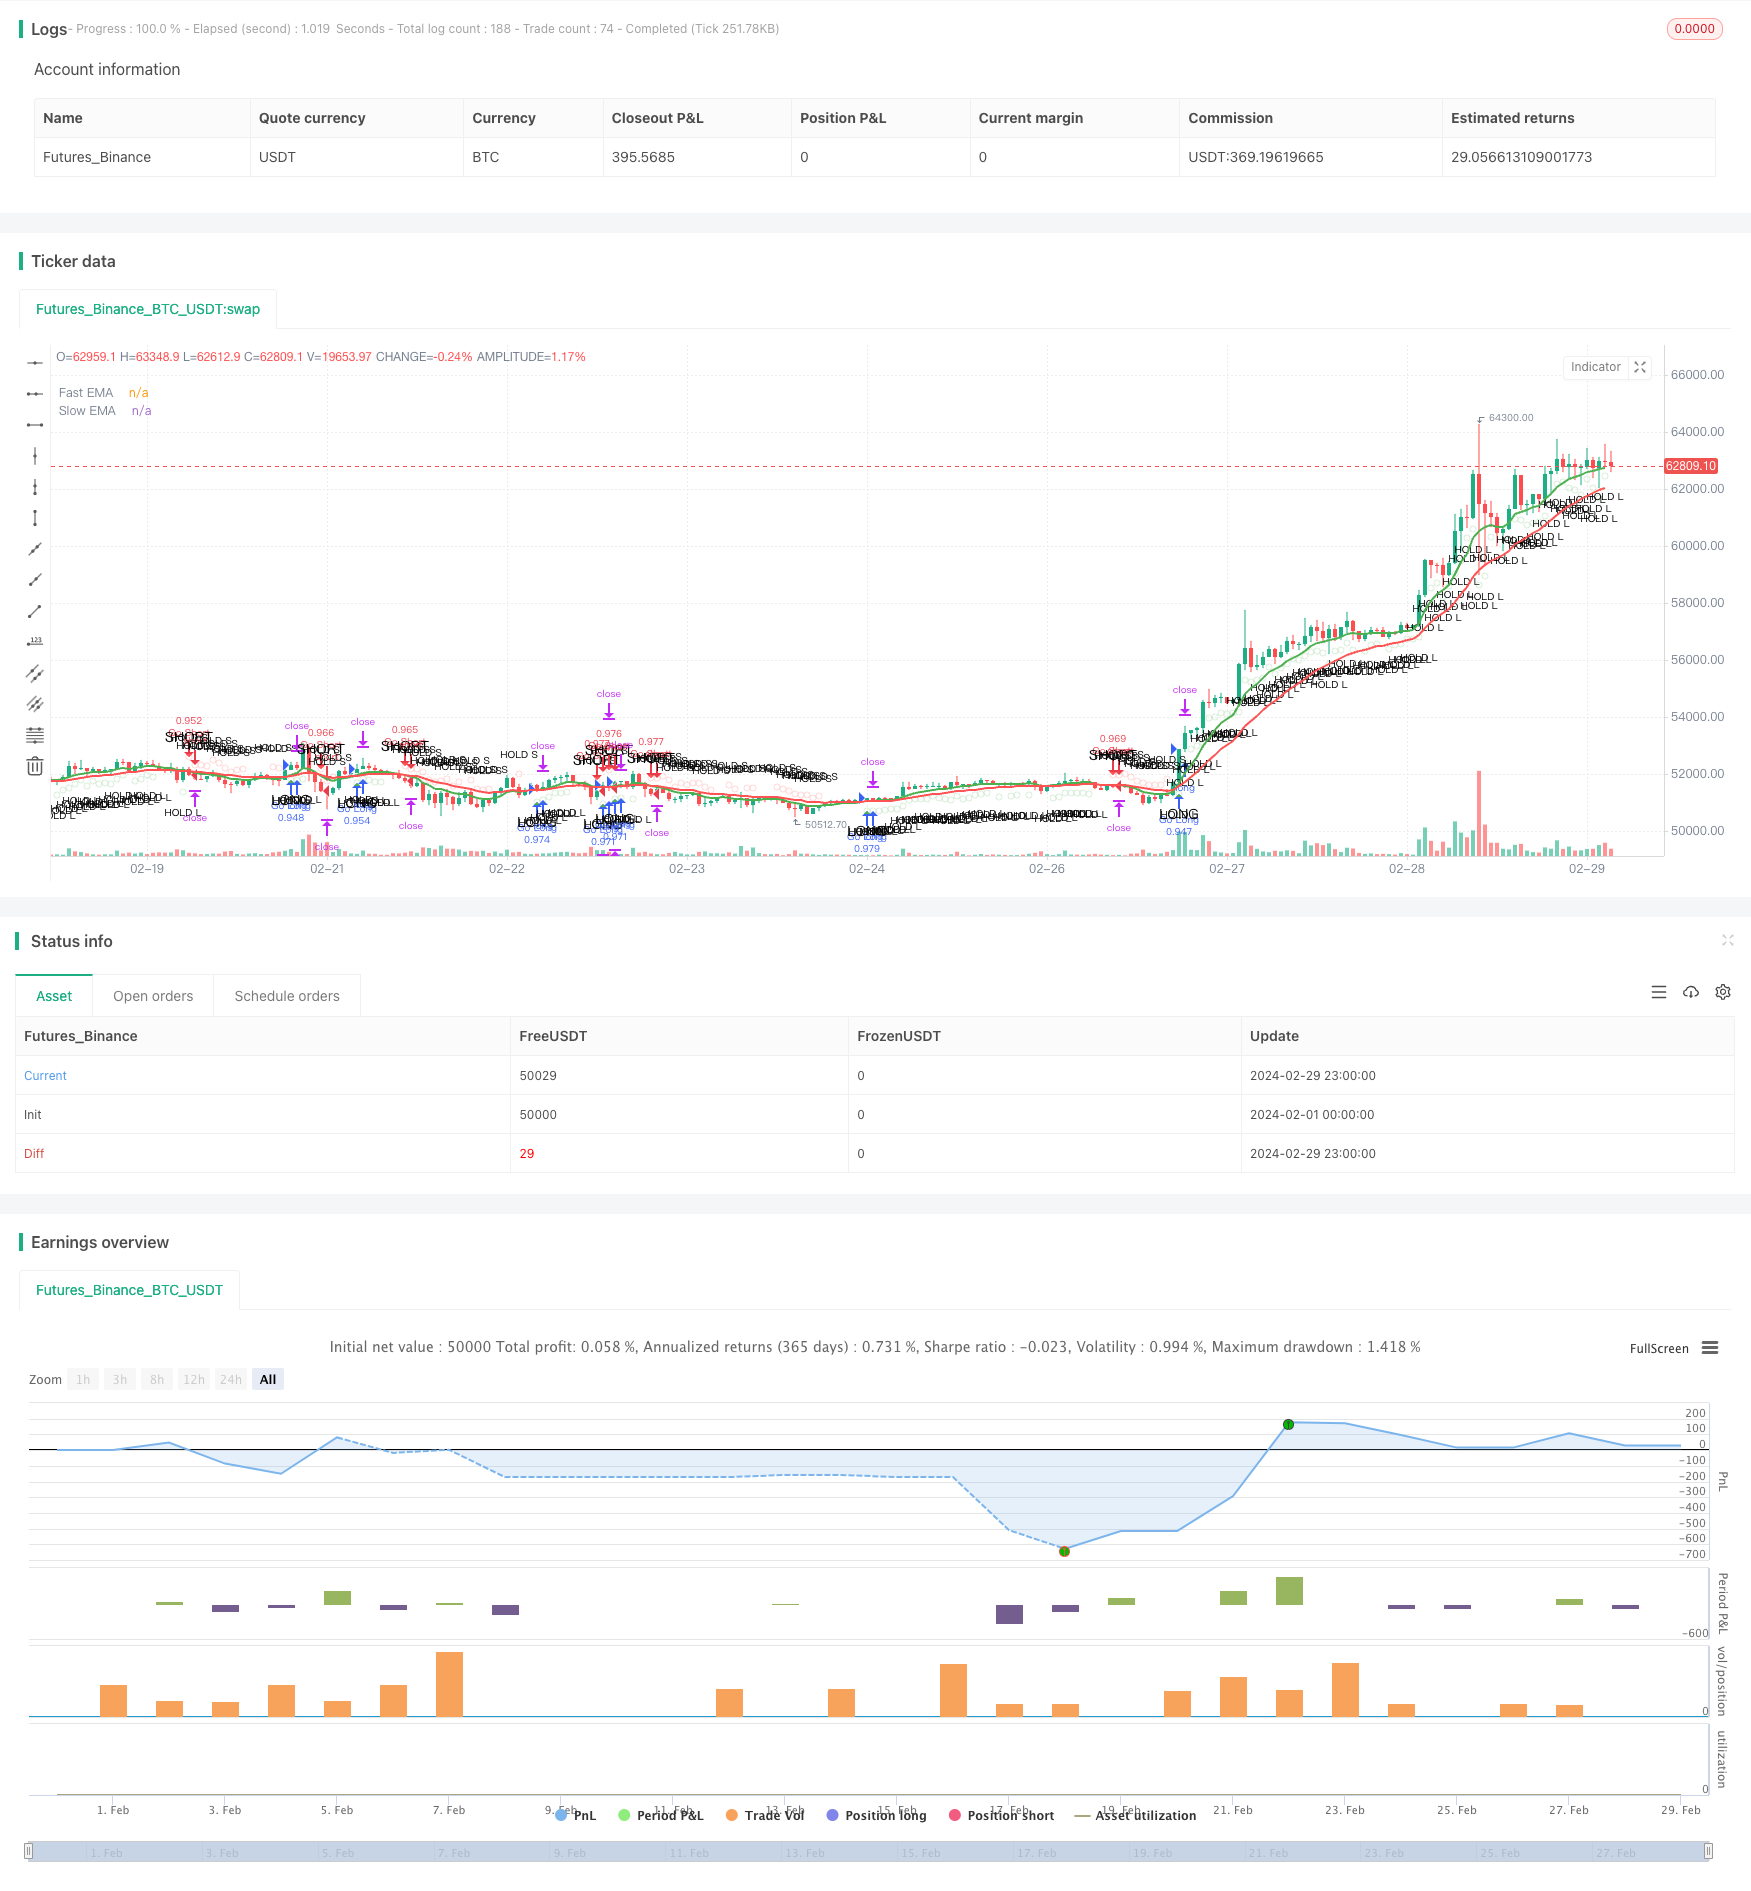
개요
동량평균선 교차 전략은 두 개의 이동 평균의 교차를 기반으로 한 거래 전략이다. 이 전략은 빠른 이동 평균 ((빠른 선) 과 느린 이동 평균 ((오빠진 선) 을 사용하여 시장의 운동 변화를 포착한다. 빠른 선이 아래쪽에서 느린 선을 통과하면 다중 신호가 발생하며, 빠른 선이 위쪽에서 느린 선을 통과하면 공백 신호가 발생한다. 이 전략은 트렌드 지속 조건, 스톱 및 스을 고려하면서 위험을 제어하고 수익을 최적화한다.
전략 원칙
이 전략의 핵심 원칙은 두 개의 다른 기간의 지수 이동 평균 (EMA) 을 사용하여 시장의 추세와 동력을 판단하는 것입니다. 구체적인 단계는 다음과 같습니다:
- 계산 빠른 EMA ((이 예에서는 9일) 과 느린 EMA ((이 예에서는 21일)
- 빠른 EMA가 아래쪽에서 느린 EMA를 통과할 때, 다중 신호가 발생한다; 반대로, 빠른 EMA가 위쪽에서 아래쪽에서 느린 EMA를 통과할 때, 공백 신호가 발생한다.
- 트렌드가 지속되는 것을 확인하기 위해, 전략은 포지션 조건을 설정합니다: 다중 포지션을 할 때, 빠른 EMA를 느린 EMA 위에 요구하고, 빠른 EMA 위에 상쇄 가격을 요구합니다. 포지션을 할 때, 빠른 EMA를 느린 EMA 아래에 요구하고, 빠른 EMA 아래에 상쇄 가격을 요구합니다.
- 위험을 제어하기 위해, 전략은 평균 실제 변동 범위 ((ATR) 를 사용하여 시장의 변동성을 판단합니다. 빠른 EMA와 느린 EMA 사이의 차이는 ATR보다 작을 때, 전략은 새로운 입장을 열지 않습니다.
- 전략은 동시에 스톱로스 ((1%) 와 스톱 ((2%) 를 설정하고, 고정된 퍼센트 방식으로 위험을 제어한다.
위와 같은 원칙을 통해, 이 전략은 시장 추세와 동력의 변화에 따라 거래 결정을 내릴 수 있으며, 트렌드 지속성, 시장 변동성 및 위험 제어 등의 요소를 고려합니다.
우위 분석
동량평평선 교차 전략은 다음과 같은 장점이 있다:
- 트렌드 추적: 급속한 평행선 교차로, 전략은 시장 추세의 변화를 적시에 포착하고, 다른 시장 환경에 적응할 수 있다.
- 간단하고 사용하기 쉬운: 전략 논리는 명확하고, 가격과 평균 지표에만 의존하며, 이해하기 쉽고 구현하기 쉽다.
- 리스크 제어: 전략은 단편 거래의 리스크 을 고정된 비율로 제어하기 위해 스톱로스와 스톱스을 설정한다.
- 트렌드 확인: 전략은 평행선 교차를 고려할 뿐만 아니라, 포지션을 개시할 때 트렌드의 지속성을 보장하기 위해 트렌드 지속 조건을 도입한다.
- 변동성 필터: 평균선 차등과 ATR을 비교함으로써, 전략은 시장의 변동성이 적을 때 포지션을 열지 않도록 하고, 거래 빈도와 위험을 줄일 수 있다.
위험 분석
동력평균선교차 전략은 장점이 있지만 몇 가지 위험도 있습니다.
- 지연 위험: 평균선은 지연된 지표이며, 트렌드 반전 후에 신호를 생성할 수 있으며, 이로 인해 최적의 진입 시기를 놓치거나 더 큰 회수를 겪을 수 있습니다.
- 진동시장 위험: 진동시장에서, 급속한 평균선은 자주 교차할 수 있으며, 여러 번의 가짜 신호를 생성하여 자주 거래와 손실을 초래한다.
- 변수 위험: 전략의 성과는 평균선 주기 및 스톱 스톱의 설정에 의존하며, 다른 변수는 다른 결과를 초래할 수 있다.
- 검은 천둥 위험: 전략은 역사적 데이터에 기반하여 극단적인 시장 사건이나 비정상적인 변동에 대처할 수 없으며, 이로 인해 큰 손실이 발생할 수 있습니다.
이러한 위험들을 해결하기 위해 다음과 같은 방법을 고려할 수 있습니다.
- 가격 행동, 거래량 등과 같은 다른 지표 또는 신호와 결합하여 신호의 신뢰성을 높인다.
- 진동시장에서 ATR 또는 ADX와 같은 필터링 메커니즘을 도입하여 자주 거래되는 것을 방지한다.
- 매개 변수를 최적화하고 테스트하고, 역사적으로 안정적인 매개 변수 조합을 선택한다.
- 시장의 극단적인 상황에 대응하기 위해 포지션 관리, 총손실 등과 같은 합리적인 위험 통제 조치를 취하십시오.
최적화 방향
동량평평선적 교차전략의 성능을 더욱 향상시키기 위해, 다음과 같은 최적화 방향을 고려할 수 있다.
- 동적 변수 최적화: 시장 상황에 따라 동적으로 평균주기 및 스톱 스톱 변수를 조정하여 다른 시장의 리듬과 변동률에 적응합니다. 이것은 전략의 적응성과 안정성을 향상시킬 수 있습니다.
- 다중 시간 프레임 분석: 다른 시간 프레임의 일선 및 시간선과 같은 평행선 신호를 결합하여 더 포괄적인 추세를 판단하고 다른 시간 프레임의 신호 강도에 따라 포지션을 배분합니다.
- 다른 기술 지표의 조합: MACD, RSI 등과 같은 다른 기술 지표를 도입하여 더 많은 거래 신호 검증을 제공하여 신호의 신뢰성을 향상시킵니다.
- 리스크 관리 최적화: 캐일리 공식이나 다이내믹 포지션 관리와 같은 더 고급 리스크 관리 방법을 사용하여 재원 배치를 최적화하고 철회 위험을 제어하십시오.
- 기계 학습 최적화: 유전 알고리즘이나 신경 네트워크와 같은 기계 학습 알고리즘을 사용하여 전략 파라미터와 논리를 최적화하여 최적의 파라미터 조합과 거래 규칙을 찾습니다.
위와 같은 최적화 방향을 통해 동력 평평선 교차 전략은 기존의 우위를 유지하면서 적응력, 안정성 및 수익 잠재력을 향상시키고, 다양한 시장 환경의 도전에 더 잘 대처할 수 있습니다.
요약하다
동적 평평선 교차 전략은 시장의 추세와 동적 변화를 빠르게 느리게 평평선 교차로 포착하는 간단하고 효과적인 거래 전략이다. 이 전략은 추세 추적, 간편한 사용, 위험 제어 등의 장점을 가지고 있으며, 또한 추세 지속성과 시장의 변동성을 고려한다. 그러나 이 전략은 지연 위험, 변동 시장 위험, 변수 위험 및 검은 천둥 위험 등의 도전에 직면하고 있다. 이러한 위험에 대응하고 전략의 성능을 더욱 향상시키기 위해, 동적 변수 최적화, 다중 시간 프레임 분석, 다른 기술 지표의 조합, 위험 관리 최적화 기계 및 학습 최적화 방향을 고려할 수 있다.
/*backtest
start: 2024-02-01 00:00:00
end: 2024-02-29 23:59:59
period: 1h
basePeriod: 15m
exchanges: [{"eid":"Futures_Binance","currency":"BTC_USDT"}]
*/

//@version=4
strategy("Enhanced Momentum Bot", shorttitle="EMB", overlay=true, default_qty_type=strategy.percent_of_equity, default_qty_value=100)

// Define the Exponential Moving Averages (EMA)
fastEMA = ema(close, 9)
slowEMA = ema(close, 21)

// Plot EMAs for trend visualization
plot(fastEMA, color=color.green, title="Fast EMA", linewidth=2)
plot(slowEMA, color=color.red, title="Slow EMA", linewidth=2)

// Entry Conditions
longCondition = crossover(fastEMA, slowEMA)
shortCondition = crossunder(fastEMA, slowEMA)

// Define conditions for holding or not entering
// Pseudo-conditions to illustrate logic - Adjust according to strategy specifics
holdLongCondition = fastEMA > slowEMA and close > fastEMA
holdShortCondition = fastEMA < slowEMA and close < fastEMA
dontEnterCondition = abs(fastEMA - slowEMA) < atr(14) // Using ATR as a measure of volatility

// Signal plotting for clarity
plotshape(series=longCondition, title="Long Entry", location=location.belowbar, color=color.green, style=shape.triangleup, text="LONG")
plotshape(series=shortCondition, title="Short Entry", location=location.abovebar, color=color.red, style=shape.triangledown, text="SHORT")

// Hold signals - less emphasized
plotshape(series=holdLongCondition, title="Hold Long", location=location.belowbar, color=color.new(color.green, 80), style=shape.circle, text="HOLD L", size=size.tiny)
plotshape(series=holdShortCondition, title="Hold Short", location=location.abovebar, color=color.new(color.red, 80), style=shape.circle, text="HOLD S", size=size.tiny)

// Don't Enter - caution signal
plotshape(series=dontEnterCondition, title="Don't Enter", location=location.absolute, color=color.blue, style=shape.xcross, text="WAIT")

// Define Stop Loss and Take Profit as a percentage of the entry price
stopLossPercent = 0.01 // 1%
takeProfitPercent = 0.02 // 2%

// Execute Trade on Conditions
if (longCondition)
    strategy.entry("Go Long", strategy.long)
    strategy.exit("Close Long", "Go Long", loss=stopLossPercent * close, profit=takeProfitPercent * close)

if (shortCondition)
    strategy.entry("Go Short", strategy.short)
    strategy.exit("Close Short", "Go Short", loss=stopLossPercent * close, profit=takeProfitPercent * close)