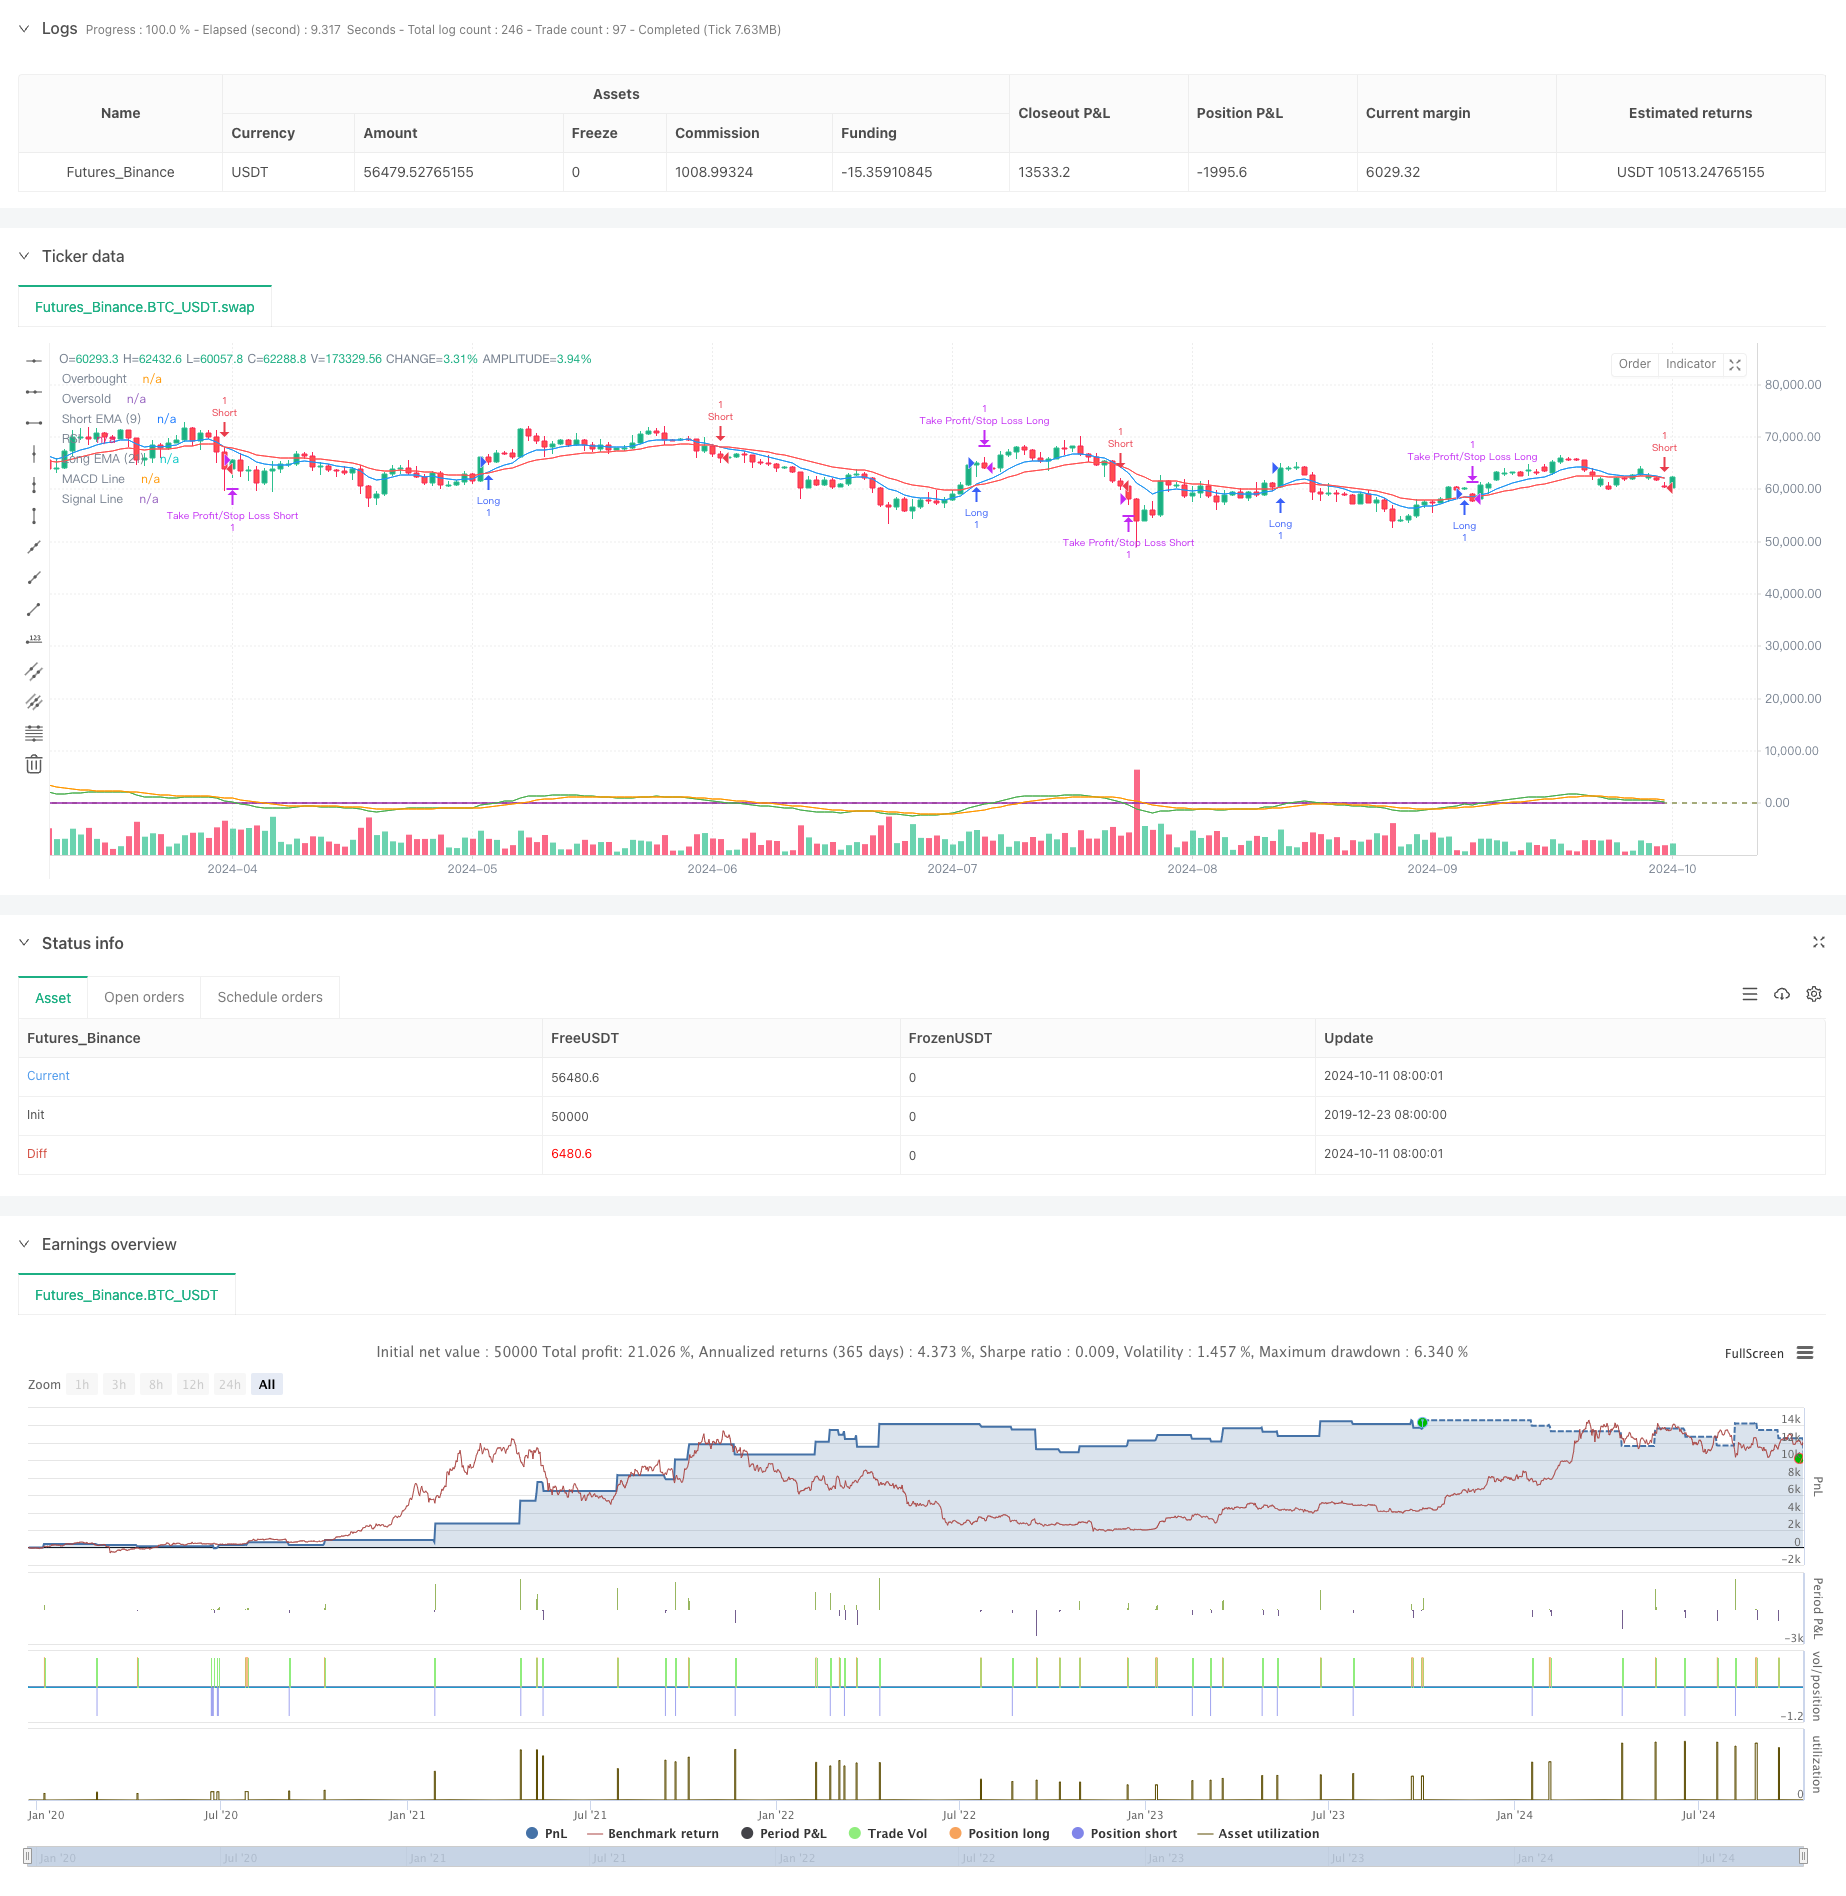
개요
이 전략은 여러 기술 지표와 결합한 동적 거래 시스템이며, 유연한 중지 및 손실 메커니즘을 통합합니다. 이 전략은 주로 RSI, EMA 및 MACD의 세 가지 일반적인 기술 지표의 교차 신호를 사용하여 시장의 추세와 동력을 판단하고, 이를 기반으로 거래 결정을 내립니다. 이 전략은 또한 자본 관리 및 위험 통제를 최적화하기 위해 백분율 중지 손실 및 위험 수익률의 개념을 도입합니다.
전략 원칙
이 전략의 핵심 원칙은 여러 지표의 협동 작용을 통해 잠재적인 거래 기회를 식별하는 것입니다. 구체적으로:
- RSI를 사용하여 시장이 과매매되거나 과매매되는지 판단합니다.
- 동향의 변화를 확인하기 위해 단기 및 장기 EMA (지수 이동 평균) 의 교차를 사용한다.
- MACD (Moving Average Convergence Divergence) 의 기둥 모양 도표와 신호 선의 관계를 통해 운동량을 더욱 검증한다.
이러한 지표가 특정 조건을 동시에 충족시키면, 전략은 거래 신호를 유발한다. 예를 들어, 단기 EMA에 장기 EMA, RSI가 초고가치 수준보다 낮고 MACD 기둥이 신호선보다 높을 때 다중 신호가 발생한다. 반대 조건은 공백 신호를 유발한다.
또한, 전략은 백분율의 스톱스톱스 메커니즘을 통합하여 거래자가 자신의 위험 선호에 따라 적절한 스톱스톱 및 스톱스톱 수준을 설정할 수 있도록합니다. 위험 수익 비율의 도입은 자금 관리 전략을 더욱 최적화합니다.
전략적 이점
- 다중 지표 연동: RSI, EMA, MACD를 결합하여 전략은 여러 관점에서 시장을 분석하여 신호의 신뢰성을 향상시킬 수 있습니다.
- 유연한 자금 관리: 백분율의 스톱로즈 및 리스크 수익률의 설정은 전략이 다른 시장 환경과 개인의 위험 선호도에 따라 조정될 수 있도록 합니다.
- 트렌드 추적과 동력 결합: EMA 교차는 트렌드 신호를 제공하며, RSI와 MACD는 동력 요소를 보완하여 강력한 시장 움직임을 포착하는 데 도움이됩니다.
- 시각화 지원: 전략은 시장 상태와 전략 논리를 직관적으로 이해할 수 있도록 중요한 지표를 차트에 그려줍니다.
- 매개 변수 조정 가능: 주요 지표의 주기 및 값은 입력 매개 변수를 통해 조정할 수 있으며, 전략의 적응성을 증가시킨다.
전략적 위험
- 과도한 거래: 불안한 시장에서 여러 지표가 종종 서로 상반된 신호를 내보이며 과도한 거래로 이어질 수 있습니다.
- 뒤처진성: 사용된 모든 지표는 본질적으로 뒤처진 지표이며, 빠르게 변화하는 시장에서 반응하지 않을 수 있다.
- 가짜 브레이크 위험: EMA 교차 전략은 시장 소음에 영향을 받기 쉽고, 가짜 브레이크 신호를 일으킬 수 있다.
- 매개 변수 민감성: 전략의 성과는 선택된 매개 변수에 크게 의존하며, 다른 시장 환경에는 다른 매개 변수 설정이 필요할 수 있다.
- 시장의 감정에 대한 고려의 부족: 이 전략은 주로 기술적 인 지표에 기반하고 기본 요소와 시장의 감정을 고려하지 않고 주요 뉴스 사건이 발생했을 때 좋지 않을 수 있습니다.
전략 최적화 방향
- 변동율 필터를 도입: ATR (진실 진폭) 지표를 추가하여 낮은 변동율 환경에서 거래 빈도를 줄이고 신호 품질을 향상시킬 수 있습니다.
- 트렌드 강도 필터를 추가합니다. 예를 들어, ADX를 사용하여 강한 트렌드에서만 거래하고 흔들리는 시장에서 자주 거래하는 것을 피합니다.
- 동적 스톱 로즈: 시장의 변동성에 따라 동적으로 스톱 로즈 수준을 조정할 수 있습니다. 예를 들어 ATR의 배수를 사용하여 설정할 수 있습니다.
- 시간 필터: 거래 시간 창의 제한을 증가시키고, 변동성이 높은 개시 및 종료 시기를 피한다.
- 거래량 분석에 추가: OBV ((에너지 흐름) 또는 CMF ((자금 흐름 지표) 와 같은 거래량 지표를 결합하여 가격 움직임의 유효성을 검증한다.
- 기계 학습 최적화: 기계 학습 알고리즘을 사용하여 변화하는 시장 환경에 적응하기 위해 전략 매개 변수를 동적으로 조정하고 최적화합니다.
요약하다
이 다중 지표 크로스 동적 거래 전략은 RSI, EMA 및 MACD와 같은 기술 지표를 종합적으로 활용하여 유연한 중지 및 손실 메커니즘과 결합하여 거래자에게 포괄적인 거래 시스템을 제공합니다. 전략의 장점은 시장을 다각적으로 분석하는 능력과 유연한 위험 관리 방법입니다. 그러나 모든 거래 전략과 마찬가지로 과다 거래 및 파라미터 민감성 등의 위험에 직면합니다.
전략 소스 코드
/*backtest
start: 2019-12-23 08:00:00
end: 2024-10-12 08:00:00
period: 1d
basePeriod: 1d
exchanges: [{"eid":"Futures_Binance","currency":"BTC_USDT"}]
*/

//@version=5
strategy("Crypto Futures Day Trading with Profit/Limit/Loss", overlay=true, margin_long=100, margin_short=100)

// Parameters for the strategy
rsiPeriod = input.int(14, title="RSI Period")
rsiOverbought = input.int(70, title="RSI Overbought Level")
rsiOversold = input.int(30, title="RSI Oversold Level")
emaShortPeriod = input.int(9, title="Short EMA Period")
emaLongPeriod = input.int(21, title="Long EMA Period")
macdFastLength = input.int(12, title="MACD Fast Length")
macdSlowLength = input.int(26, title="MACD Slow Length")
macdSignalSmoothing = input.int(9, title="MACD Signal Smoothing")

// Parameters for Take Profit, Stop Loss, and Limit
takeProfitPercent = input.float(3, title="Take Profit %", step=0.1) // 3% by default
stopLossPercent = input.float(1, title="Stop Loss %", step=0.1) // 1% by default
limitRiskRewardRatio = input.float(2, title="Risk/Reward Ratio", step=0.1) // Example: 2:1 ratio

// Calculate RSI
rsi = ta.rsi(close, rsiPeriod)

// Calculate EMA (Exponential Moving Average)
emaShort = ta.ema(close, emaShortPeriod)
emaLong = ta.ema(close, emaLongPeriod)

// Calculate MACD
[macdLine, signalLine, _] = ta.macd(close, macdFastLength, macdSlowLength, macdSignalSmoothing)

// Calculate take profit and stop loss levels
takeProfitLong = strategy.position_avg_price * (1 + takeProfitPercent / 100)
stopLossLong = strategy.position_avg_price * (1 - stopLossPercent / 100)

takeProfitShort = strategy.position_avg_price * (1 - takeProfitPercent / 100)
stopLossShort = strategy.position_avg_price * (1 + stopLossPercent / 100)

// Entry conditions for long position
longCondition = ta.crossover(emaShort, emaLong) and rsi < rsiOverbought and macdLine > signalLine
if (longCondition)
    strategy.entry("Long", strategy.long)

// Exit conditions for long position based on stop loss and take profit
strategy.exit("Take Profit/Stop Loss Long", from_entry="Long", limit=takeProfitLong, stop=stopLossLong)

// Entry conditions for short position
shortCondition = ta.crossunder(emaShort, emaLong) and rsi > rsiOversold and macdLine < signalLine
if (shortCondition)
    strategy.entry("Short", strategy.short)

// Exit conditions for short position based on stop loss and take profit
strategy.exit("Take Profit/Stop Loss Short", from_entry="Short", limit=takeProfitShort, stop=stopLossShort)

// Plot EMA lines on the chart
plot(emaShort, color=color.blue, title="Short EMA (9)")
plot(emaLong, color=color.red, title="Long EMA (21)")

// Plot MACD and signal lines in a separate window
plot(macdLine, color=color.green, title="MACD Line")
plot(signalLine, color=color.orange, title="Signal Line")

// Plot RSI
hline(rsiOverbought, "Overbought", color=color.red)
hline(rsiOversold, "Oversold", color=color.green)
plot(rsi, color=color.purple, title="RSI")