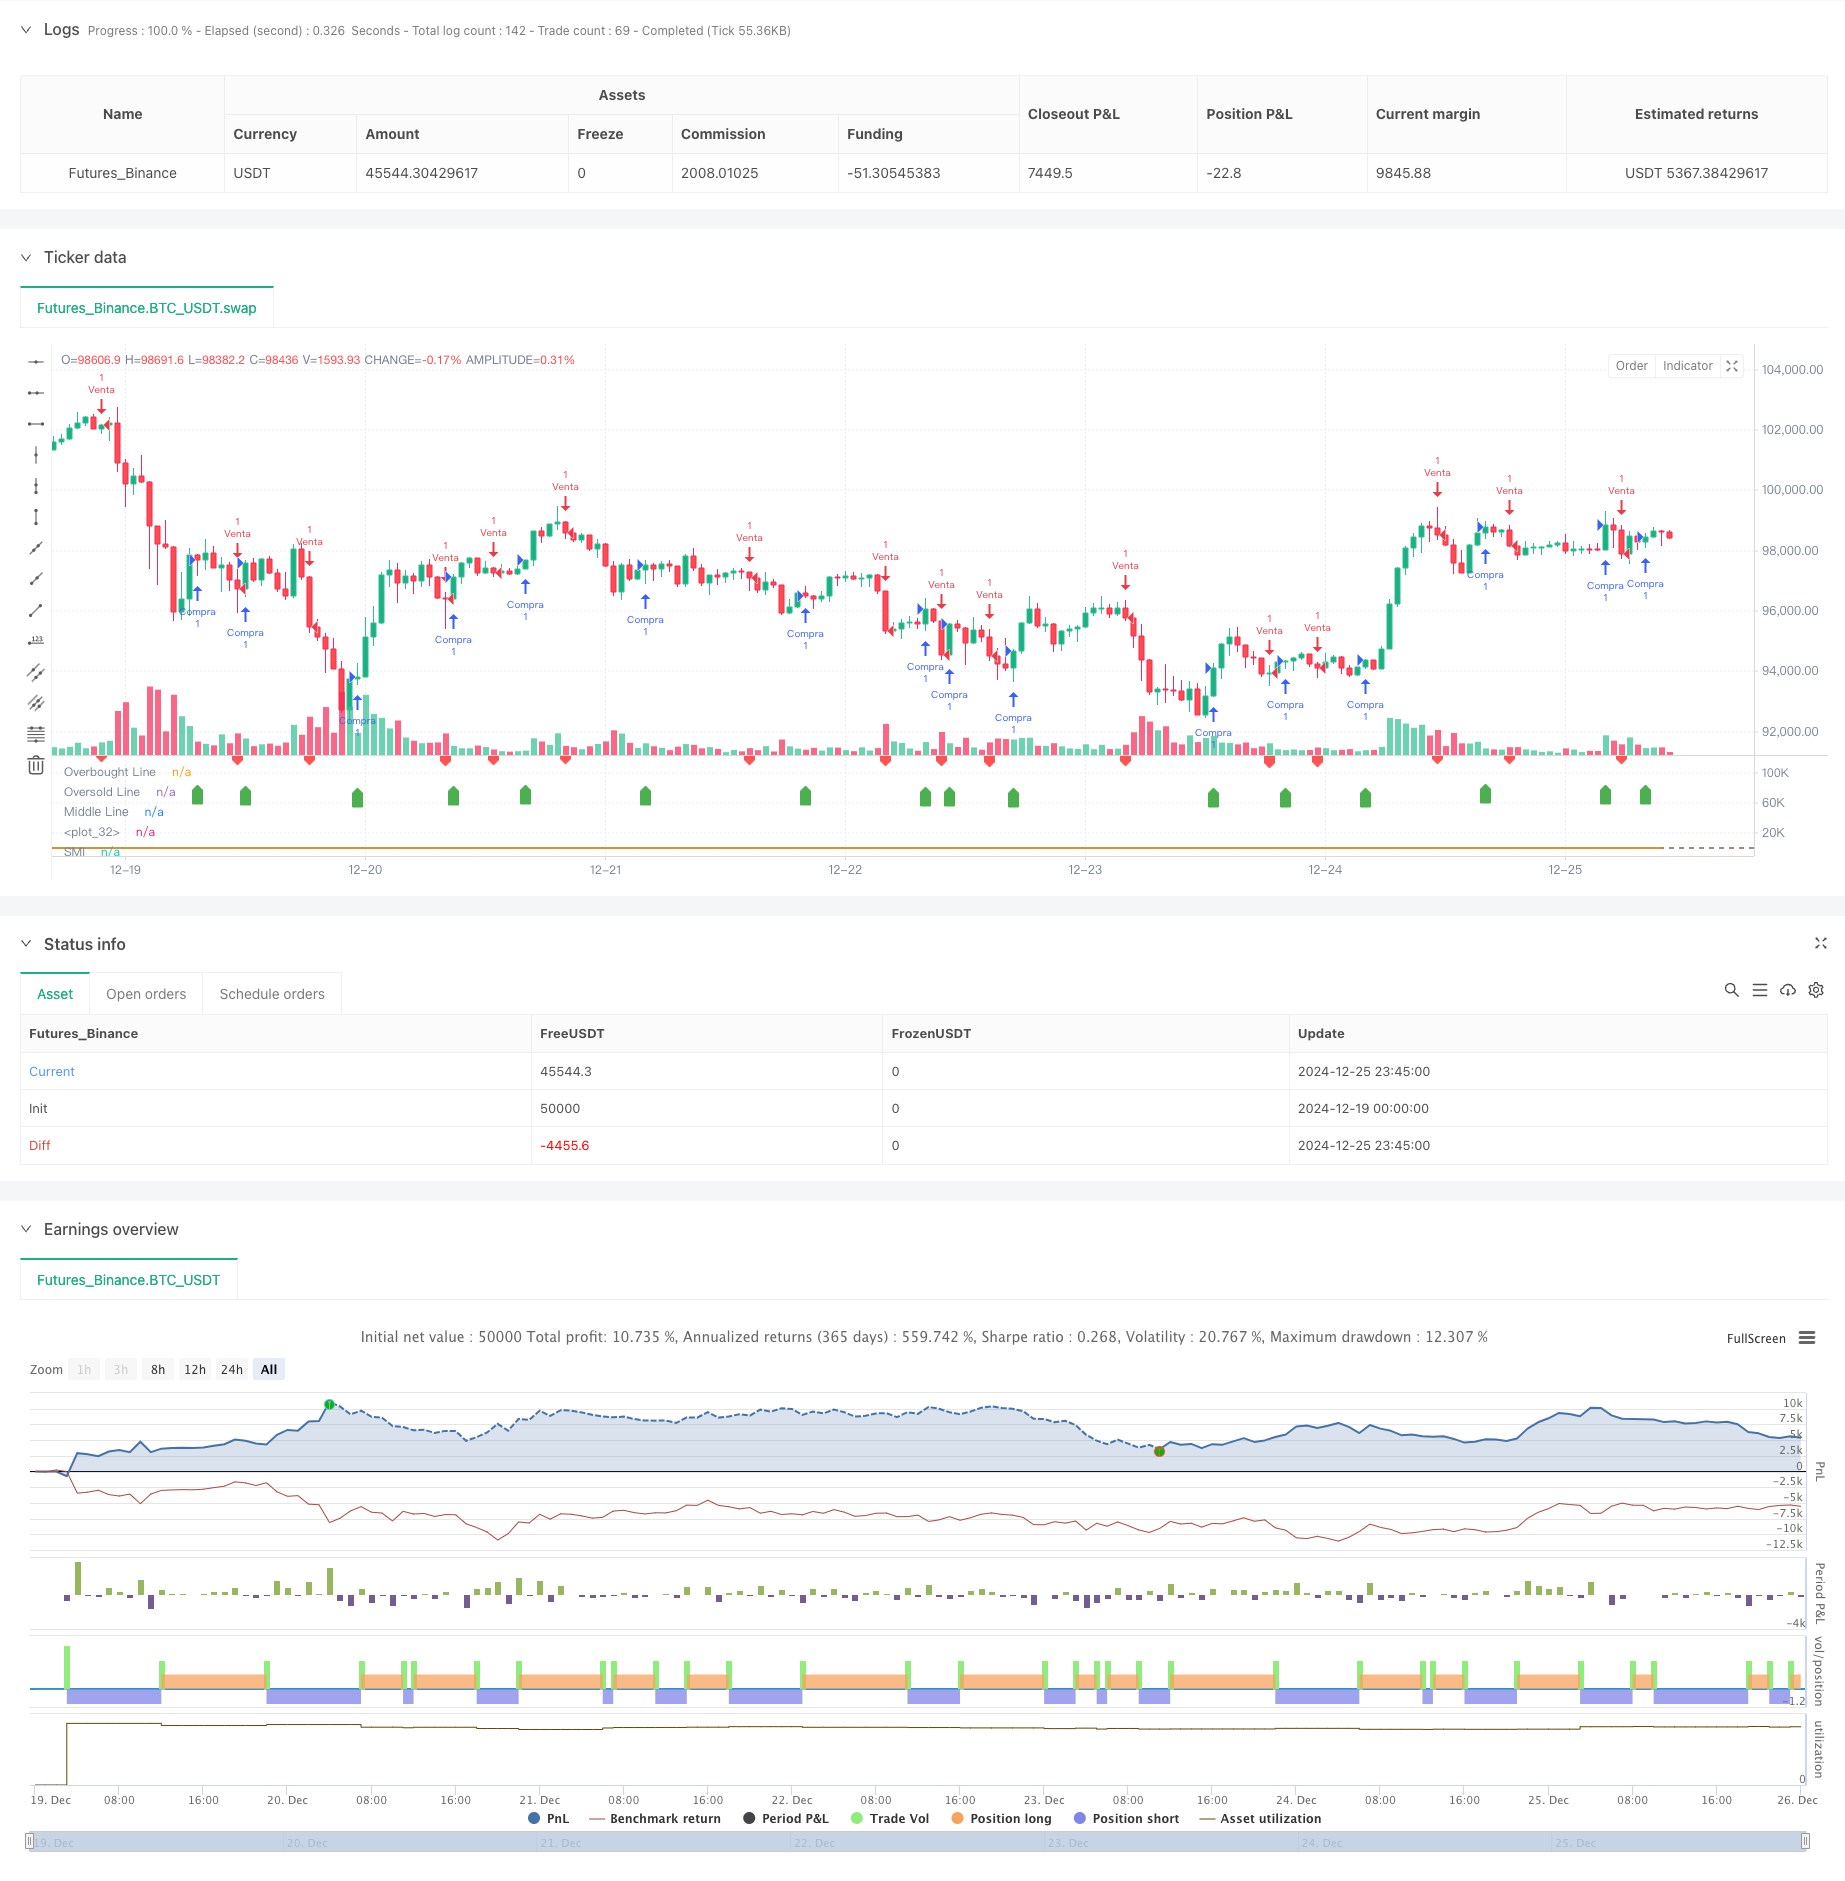
모멘텀 기반 SMI 크로스오버 신호 적응 예측 전략
저자:차오장, 날짜: 2024-12-27 15:38:01태그:SMIEMA

전반적인 설명
이 전략은 스토카스틱 모멘텀 인덱스 (SMI) 를 기반으로 한 적응형 거래 시스템이다. SMI 지표와 신호 라인 사이의 교차점을 분석하여 자동으로 주요 위치에서 구매 및 판매 신호를 생성하여 시장 추세를 예측합니다. 이 전략은 데이터를 매끄럽게하고 신호 신뢰성을 향상시키기 위해 이중 기하급수적 이동 평균 (EMA) 을 사용합니다. 이 시스템은 중장기 거래에 특히 적합하며 주요 시장 트렌드 반전 지점을 효과적으로 캡처합니다.
전략 원칙
이 전략의 핵심은 SMI 계산을 통해 가격 동력을 측정하는 데 있다. 먼저 특정 기간 내에서 가장 높고 가장 낮은 가격 범위를 결정하고, 그 다음이 범위에 대한 폐쇄 가격의 위치를 정상화한다. 상대 범위와 가격 범위 모두에 이중 EMA 평형을 적용함으로써 더 안정적인 SMI 값을 생성한다. SMI 라인이 신호 라인 (SMI
전략적 장점
- 명확한 신호 생성: 주관적 판단을 제거하여 트레이딩 트리거로 교차 신호를 사용합니다.
- 강한 소음 저항성: 시장 소음을 효과적으로 필터하기 위해 이중 EMA 평평화를 사용합니다.
- 높은 적응력: 매개 변수 최적화를 통해 다른 시장 환경에 적응 할 수 있습니다.
- 포괄적 리스크 제어: 극한 시장 조건에서 잘못된 판단을 피하기 위해 과소 구매/ 과소 판매 구역을 설정합니다.
- 높은 시각화: 시장 조건을 직관적으로 표시하기 위해 경사 채식을 사용합니다.
전략 위험
- 지연 위험: 여러 이동 평균 계산으로 인해 신호 생성에 약간의 지연이 있습니다.
- 오스실레이션 위험: 옆 시장에서 잘못된 신호를 일으킬 수 있습니다.
- 매개 변수 민감도: 다른 매개 변수 조합은 극적으로 다른 결과를 초래할 수 있습니다.
- 시장 환경 의존성: 트렌드 시장에서 더 잘 수행되고, 다양한 시장에서 덜 효과적입니다.
최적화 방향
- 부피 표시를 포함: 부피 변경을 결합하여 신호 효과를 검증
- 트렌드 필터 추가: 더 긴 기간 이동 평균을 사용하여 전체 트렌드 방향을 확인
- 최적화 매개 변수 적응: 시장 변동성에 따라 매개 변수를 동적으로 조정
- 스톱 로스 메커니즘 강화: 수익을 보호하기 위해 후속 스톱을 구현
- 리스크 관리 개선: 포지션 크기와 자금 관리 모듈을 추가
요약
이 전략은 SMI 지표를 기반으로 한 성숙한 거래 전략으로, 기술 지표 크로스오버를 통해 강력한 실용성을 통해 거래 신호를 생성합니다. 전략의 핵심 장점은 명확한 신호와 강한 노이즈 저항성, 그러나 약간의 내재적 지연이 있습니다. 볼륨 검증 및 트렌드 필터링과 같은 최적화로 전략의 안정성과 신뢰성을 더욱 향상시킬 수 있습니다. 이 전략은 중장기 트렌드를 추적하는 데 특히 적합하며 체계적인 거래 시스템을 구축하려는 투자자들에게 훌륭한 선택으로 사용됩니다.
/*backtest
start: 2024-12-19 00:00:00
end: 2024-12-26 00:00:00
period: 45m
basePeriod: 45m
exchanges: [{"eid":"Futures_Binance","currency":"BTC_USDT"}]
*/

// This Pine Script™ code is subject to the terms of the Mozilla Public License 2.0 at https://mozilla.org/MPL/2.0/
// © Iban_Boe

//@version=6
strategy("SMI Strategy with Signals", "SMI Strategy", overlay=false)

// Parámetros del SMI
lengthK   = input.int(14, "%K Length",  minval=1, maxval=15000)
lengthD   = input.int(3,  "%D Length",  minval=1, maxval=4999)
lengthEMA = input.int(3,  "EMA Length", minval=1, maxval=4999)

// Función de doble EMA
emaEma(source, length) => ta.ema(ta.ema(source, length), length)

// Cálculos del SMI
highestHigh = ta.highest(lengthK)
lowestLow = ta.lowest(lengthK)
highestLowestRange = highestHigh - lowestLow
relativeRange = close - (highestHigh + lowestLow) / 2
smi = 200 * (emaEma(relativeRange, lengthD) / emaEma(highestLowestRange, lengthD))
smiSignal = ta.ema(smi, lengthEMA)

// Gráficos del SMI
smiPlot = plot(smi, "SMI", color=color.blue)
plot(smiSignal, "SMI-based EMA", color=color.orange)

// Level lines
hline(40, "Overbought Line", color=color.green)
hline(-40, "Oversold Line", color=color.red)
hline(0, "Middle Line", color=color.gray)

midLinePlot = plot(0, color = na, editable = false, display = display.none)
fill(smiPlot, midLinePlot, 120,  40,   top_color = color.new(#4caf4f, 50),    bottom_color = color.new(color.green, 100), title = "Overbought Gradient Fill")
fill(smiPlot, midLinePlot, -40, -120,  top_color = color.new(color.red, 100), bottom_color = color.new(color.red, 50),    title = "Oversold Gradient Fill")

// Señales de compra y venta
buySignal = ta.crossover(smi, smiSignal) // Detect crossover
sellSignal = ta.crossunder(smi, smiSignal) // Detect crossover

// Graficar señales de compra/venta
plotshape(series=buySignal, style=shape.labelup, location=location.belowbar, color=color.green, size=size.tiny, title="Señal de Compra")
plotshape(series=sellSignal, style=shape.labeldown, location=location.abovebar, color=color.red, size=size.tiny, title="Señal de Venta")

// Lógica de la estrategia
if (buySignal)
    strategy.entry("Compra", strategy.long)

if (sellSignal)
    strategy.entry("Venta", strategy.short)

// Alertas
alertcondition(buySignal, title="Alerta de Compra", message="¡Señal de Compra Detectada!")
alertcondition(sellSignal, title="Alerta de Venta", message="¡Señal de Venta Detectada!")
- 콤보 2/20 EMA & 밴드 패스 필터
- EMA 트렌드 클라우드
- 트렌드 스칼프-프랙탈박스-3EMA
- 동적 이중 EMA 크로스오버 양적 거래 전략
- 이치모쿠 클라우드 매끄러운 오시레이터
- EMA와 단기 신호 전략의 교차
- MA 황제 인실리코노트
- 백테스팅 - 지표
- 다중 EMA 골든 크로스 전략
- 풀 보디 촛불 신호 시스템으로 듀얼 EMA 모멘텀 트렌드 거래 전략
- 멀티테크니컬 인디케이터 시너지 거래 시스템
- 다기술 지표 기반의 고주파 동적 최적화 전략
- 삼중 슈퍼트렌드 및 계수적인 이동 평균 트렌드 양적 거래 전략을 따르는
- 클라우드 기반 볼링거 대역 두 배 이동 평균 양적 경향 전략
- 볼링거 밴드 트렌드 디버전스 기반의 다단계 양적 거래 전략
- 피보나치 0.7 레벨 트렌드 돌파를 기반으로 한 양적 거래 전략
- 여러 기간 프랙탈 브레이크 오더 블록 적응 거래 전략
- 이동평균 크로스오버에 기반한 리스크/어워드 비율 최적화 전략
- 동적 트렌드 인식 거래 전략을 따르는 적응 트렌드
- 보린저 대역을 기반으로 한 국경 간 동적 범위 양적 거래 전략
- 다중 이동 평균 크로스오버 신호 강화 거래 전략
- 볼링거 반드와 우디스 CCI를 이용한 다중 지표 필터링 거래 전략
- 동적 이동 평균 트렌드를 RSI 확인 거래 전략으로 따라
- 풀백 최적화 시스템과 동적 다 기간 기하급수적 이동 평균 크로스 전략
- 동적 이동 평균 크로스오버 트렌드 적응적 리스크 관리 전략
- 스토카스틱 RSI를 기반으로 한 적응적 거래 전략
- 다단계 기관 주문 흐름 양적 전략
- 다중 EMA 동적 트렌드 포착 양적 거래 전략
- 동적 이동 평균 및 고정 스톱 손실 최적화 모델과 볼링거 밴드 교차 전략
- ATR 스톱 로스 및 거래 구역 제어와 함께 RSI 트렌드 역전 거래 전략