资源加载中... loading...

Adaptive Trading Strategy Based on Stochastic RSI Dual-Line Crossover

Author: ChaoZhang, Date: 2024-12-27 15:06:56
Tags: RSISRSISMA

img

Overview

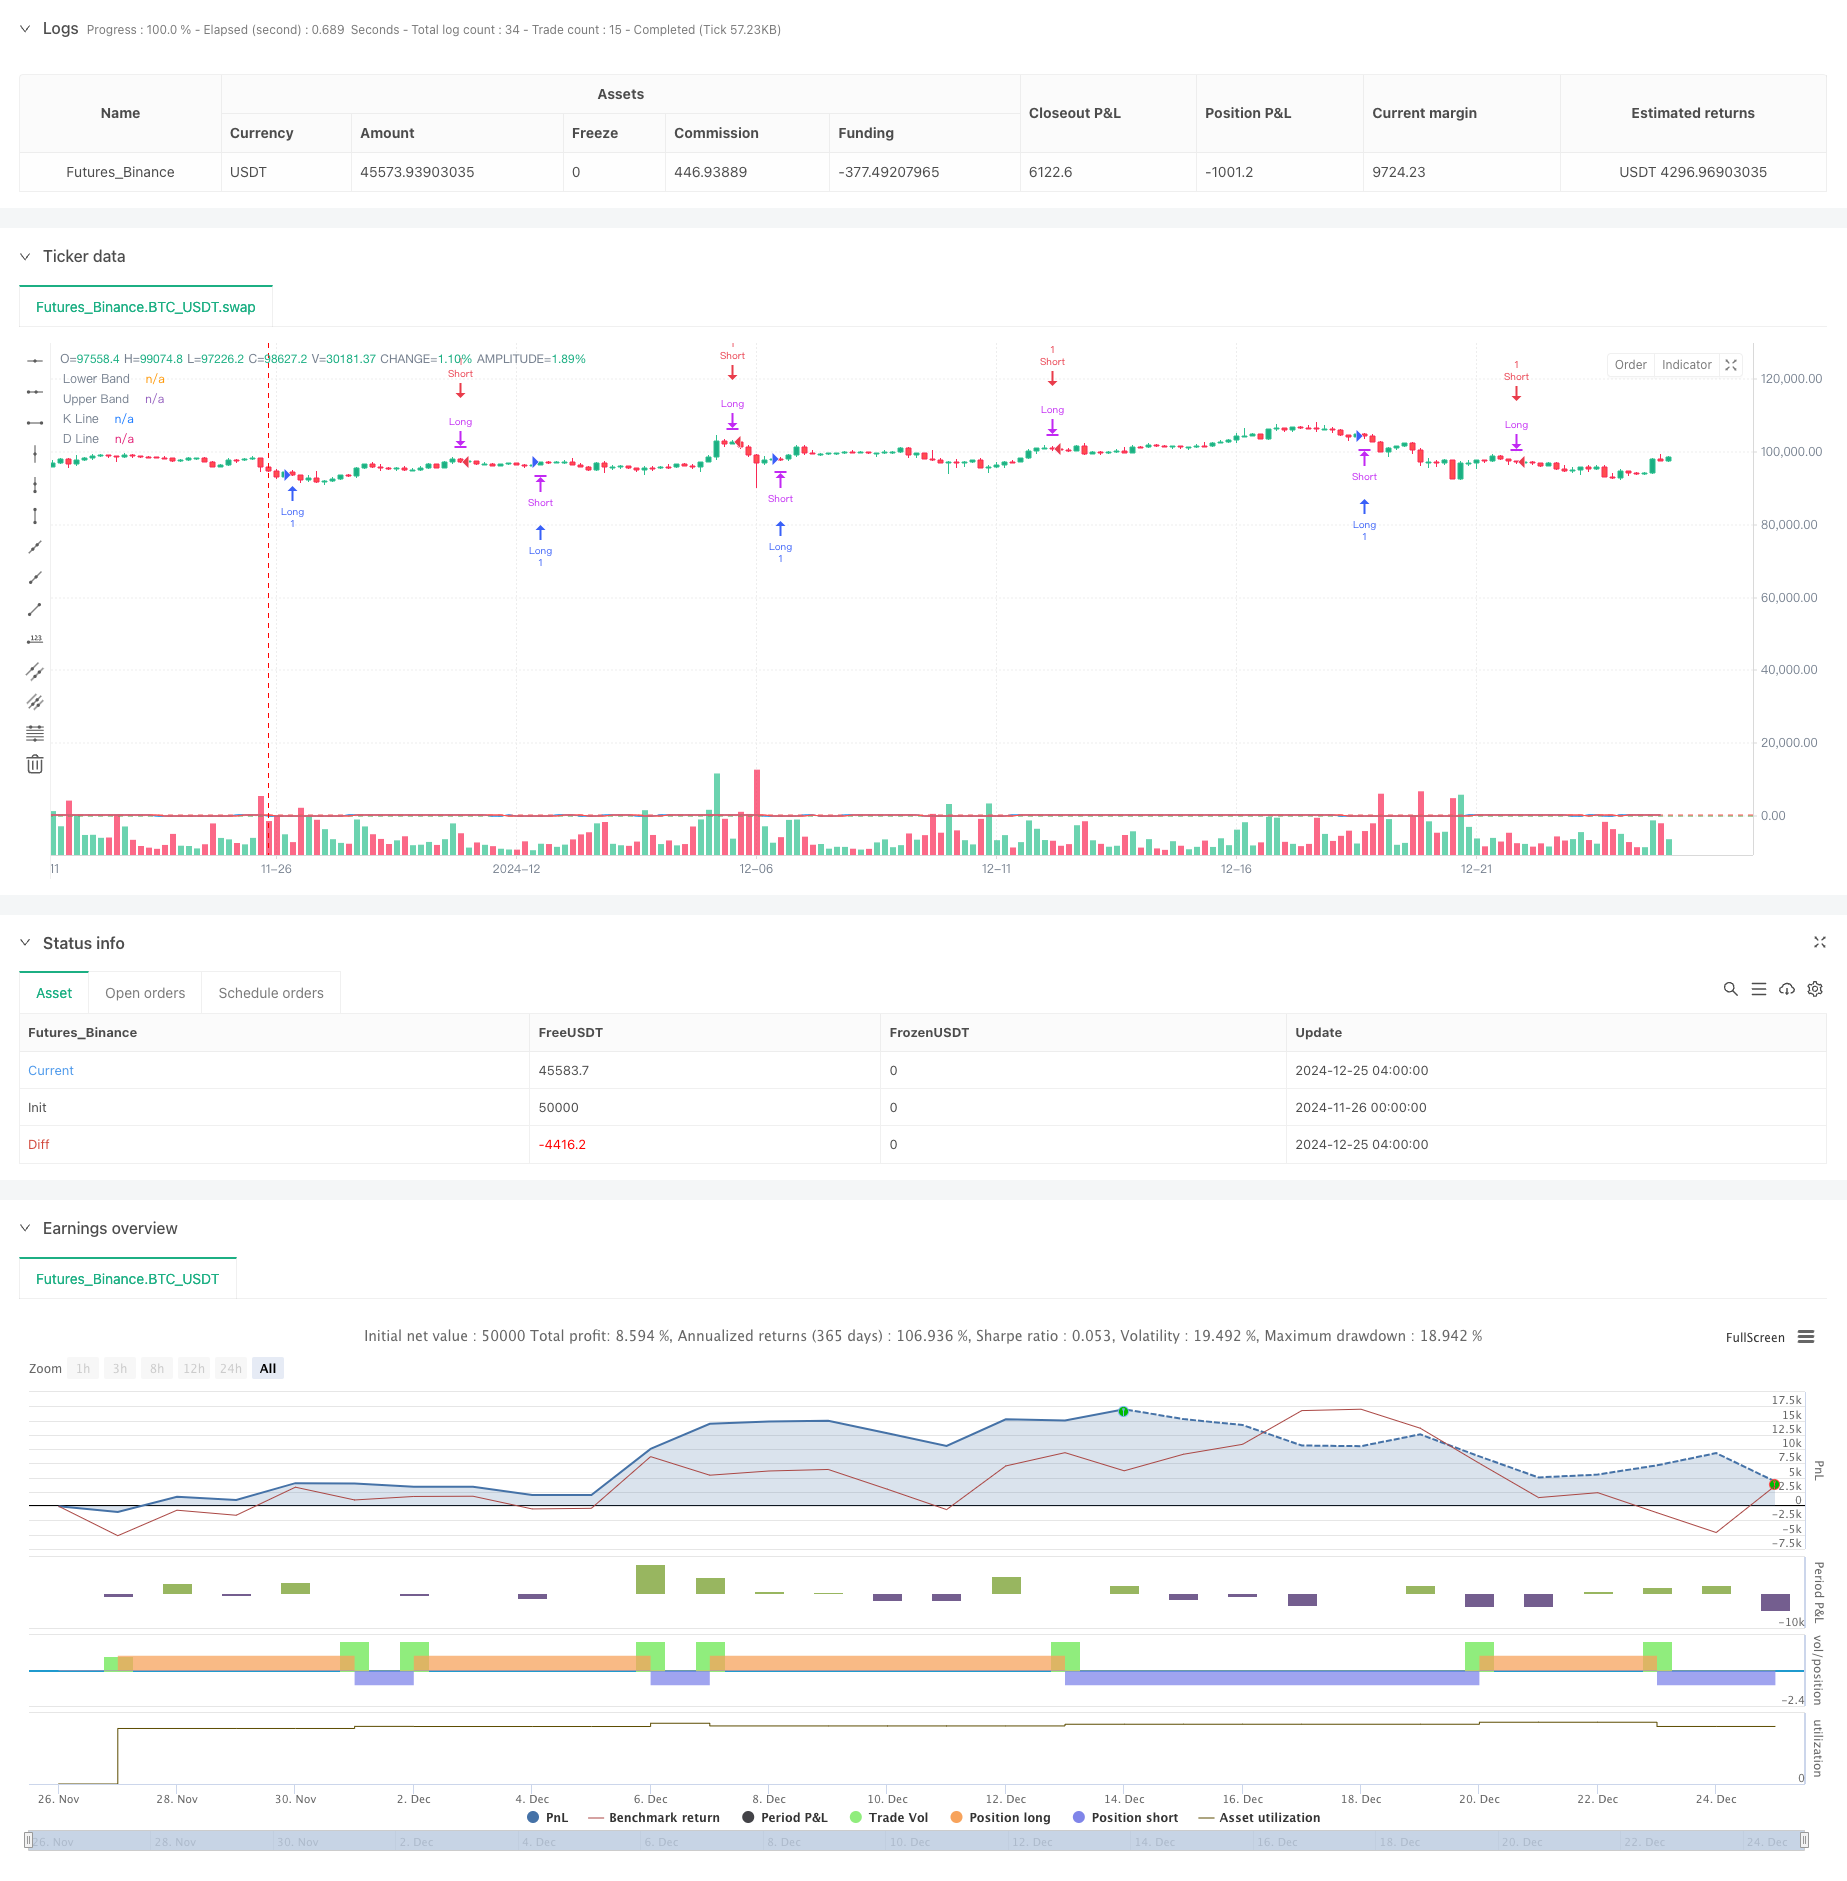
This strategy is an adaptive trading system based on the Stochastic RSI indicator, which makes trading decisions by monitoring crossover signals between K-line and D-line in overbought and oversold regions. The strategy integrates the advantages of traditional RSI and stochastic indicators, providing more reliable trading signals through dual confirmation of price momentum and volatility.

Strategy Principle

The core logic of the strategy is based on the following key steps:

  1. First calculate the traditional RSI indicator to capture price relative strength
  2. Apply stochastic calculations to RSI values to obtain a more sensitive momentum indicator
  3. Use Simple Moving Average (SMA) to smooth the Stochastic RSI, generating K-line and D-line
  4. Set filtering conditions in overbought/oversold regions (20/80) to seek high-quality trading opportunities
  5. When K-line crosses above D-line below 20, close short position and open long position
  6. When K-line crosses below D-line above 80, close long position and open short position
  7. Use time filter to limit trading periods, improving strategy adaptability

Strategy Advantages

  1. High signal reliability: Greatly reduces false breakout risks through dual confirmation of RSI and stochastic indicators
  2. Strong adaptability: Parameters can be flexibly adjusted according to different market conditions
  3. Comprehensive risk control: Avoids early entry during trend continuation through overbought/oversold region restrictions
  4. Clear execution mechanism: Uses crossover signals as triggers, reducing subjective judgment
  5. Good extensibility: Reserved time filtering interface for further optimization

Strategy Risks

  1. Oscillation market risk: May generate frequent trades in sideways markets
  2. Lag risk: Moving average smoothing leads to signal delays
  3. Parameter sensitivity: Different parameter combinations may cause significant strategy performance variations
  4. Market environment dependence: May miss some profits in strong trend markets

Risk Control Suggestions:

  • Recommend combining volatility indicators for market environment judgment
  • Can add stop-loss and take-profit mechanisms to improve risk-reward ratio
  • Consider using dynamic parameter adaptation mechanism
  • Add trend filters to avoid counter-trend trading

Strategy Optimization Directions

  1. Dynamic Parameter Optimization:
  • Dynamically adjust overbought/oversold thresholds based on market volatility
  • Optimize parameter combinations through machine learning
  1. Signal Optimization:
  • Add volume confirmation mechanism
  • Add trend confirmation indicators
  • Implement multi-timeframe analysis
  1. Risk Management Optimization:
  • Implement dynamic position management
  • Add trailing stop-loss mechanism
  • Design smart take-profit scheme
  1. Execution Mechanism Optimization:
  • Optimize order execution timing
  • Implement partial position operations
  • Add slippage control mechanism

Summary

This strategy builds a reliable trading system by combining the advantages of RSI and stochastic indicators. The core advantages lie in signal reliability and system extensibility. Through reasonable parameter settings and risk control mechanisms, it can maintain stable performance in different market environments. It is recommended that traders adjust parameters according to specific market characteristics and pay attention to risk control when using it in live trading.


/*backtest
start: 2024-11-26 00:00:00
end: 2024-12-25 08:00:00
period: 4h
basePeriod: 4h
exchanges: [{"eid":"Futures_Binance","currency":"BTC_USDT"}]
*/

//@version=5
strategy("Stochastic RSI Strategy", overlay=true)

// Ayarlar
k_period = input.int(14, title="K Period")
d_period = input.int(3, title="D Period")
stoch_length = input.int(14, title="Stoch Length")
stoch_smoothK = input.int(3, title="Stoch SmoothK")
stoch_smoothD = input.int(3, title="Stoch SmoothD")

lower_band = input.int(20, title="Lower Band")
upper_band = input.int(80, title="Upper Band")

start_date = input(timestamp("2023-01-01 00:00"), title="Start Date")
end_date = input(timestamp("2024-12-31 23:59"), title="End Date")
use_date_filter = input.bool(true, title="Use Date Filter")

// Stochastic RSI hesaplama
rsi = ta.rsi(close, stoch_length)
stoch_rsi = ta.stoch(rsi, rsi, rsi, k_period)
K = ta.sma(stoch_rsi, stoch_smoothK)
D = ta.sma(K, stoch_smoothD)

// Tarih filtresi
is_in_date_range = true

// Alım-satım koşulları
long_condition = ta.crossover(K, D) and K < lower_band and is_in_date_range
short_condition = ta.crossunder(K, D) and K > upper_band and is_in_date_range

// İşlemleri yürüt
if (long_condition)
    strategy.close("Short")
    strategy.entry("Long", strategy.long)

if (short_condition)
    strategy.close("Long")
    strategy.entry("Short", strategy.short)

// Grafikte göstergeleri çiz
plot(K, title="K Line", color=color.blue)
plot(D, title="D Line", color=color.red)
hline(lower_band, "Lower Band", color=color.green)
hline(upper_band, "Upper Band", color=color.red)

Related

More