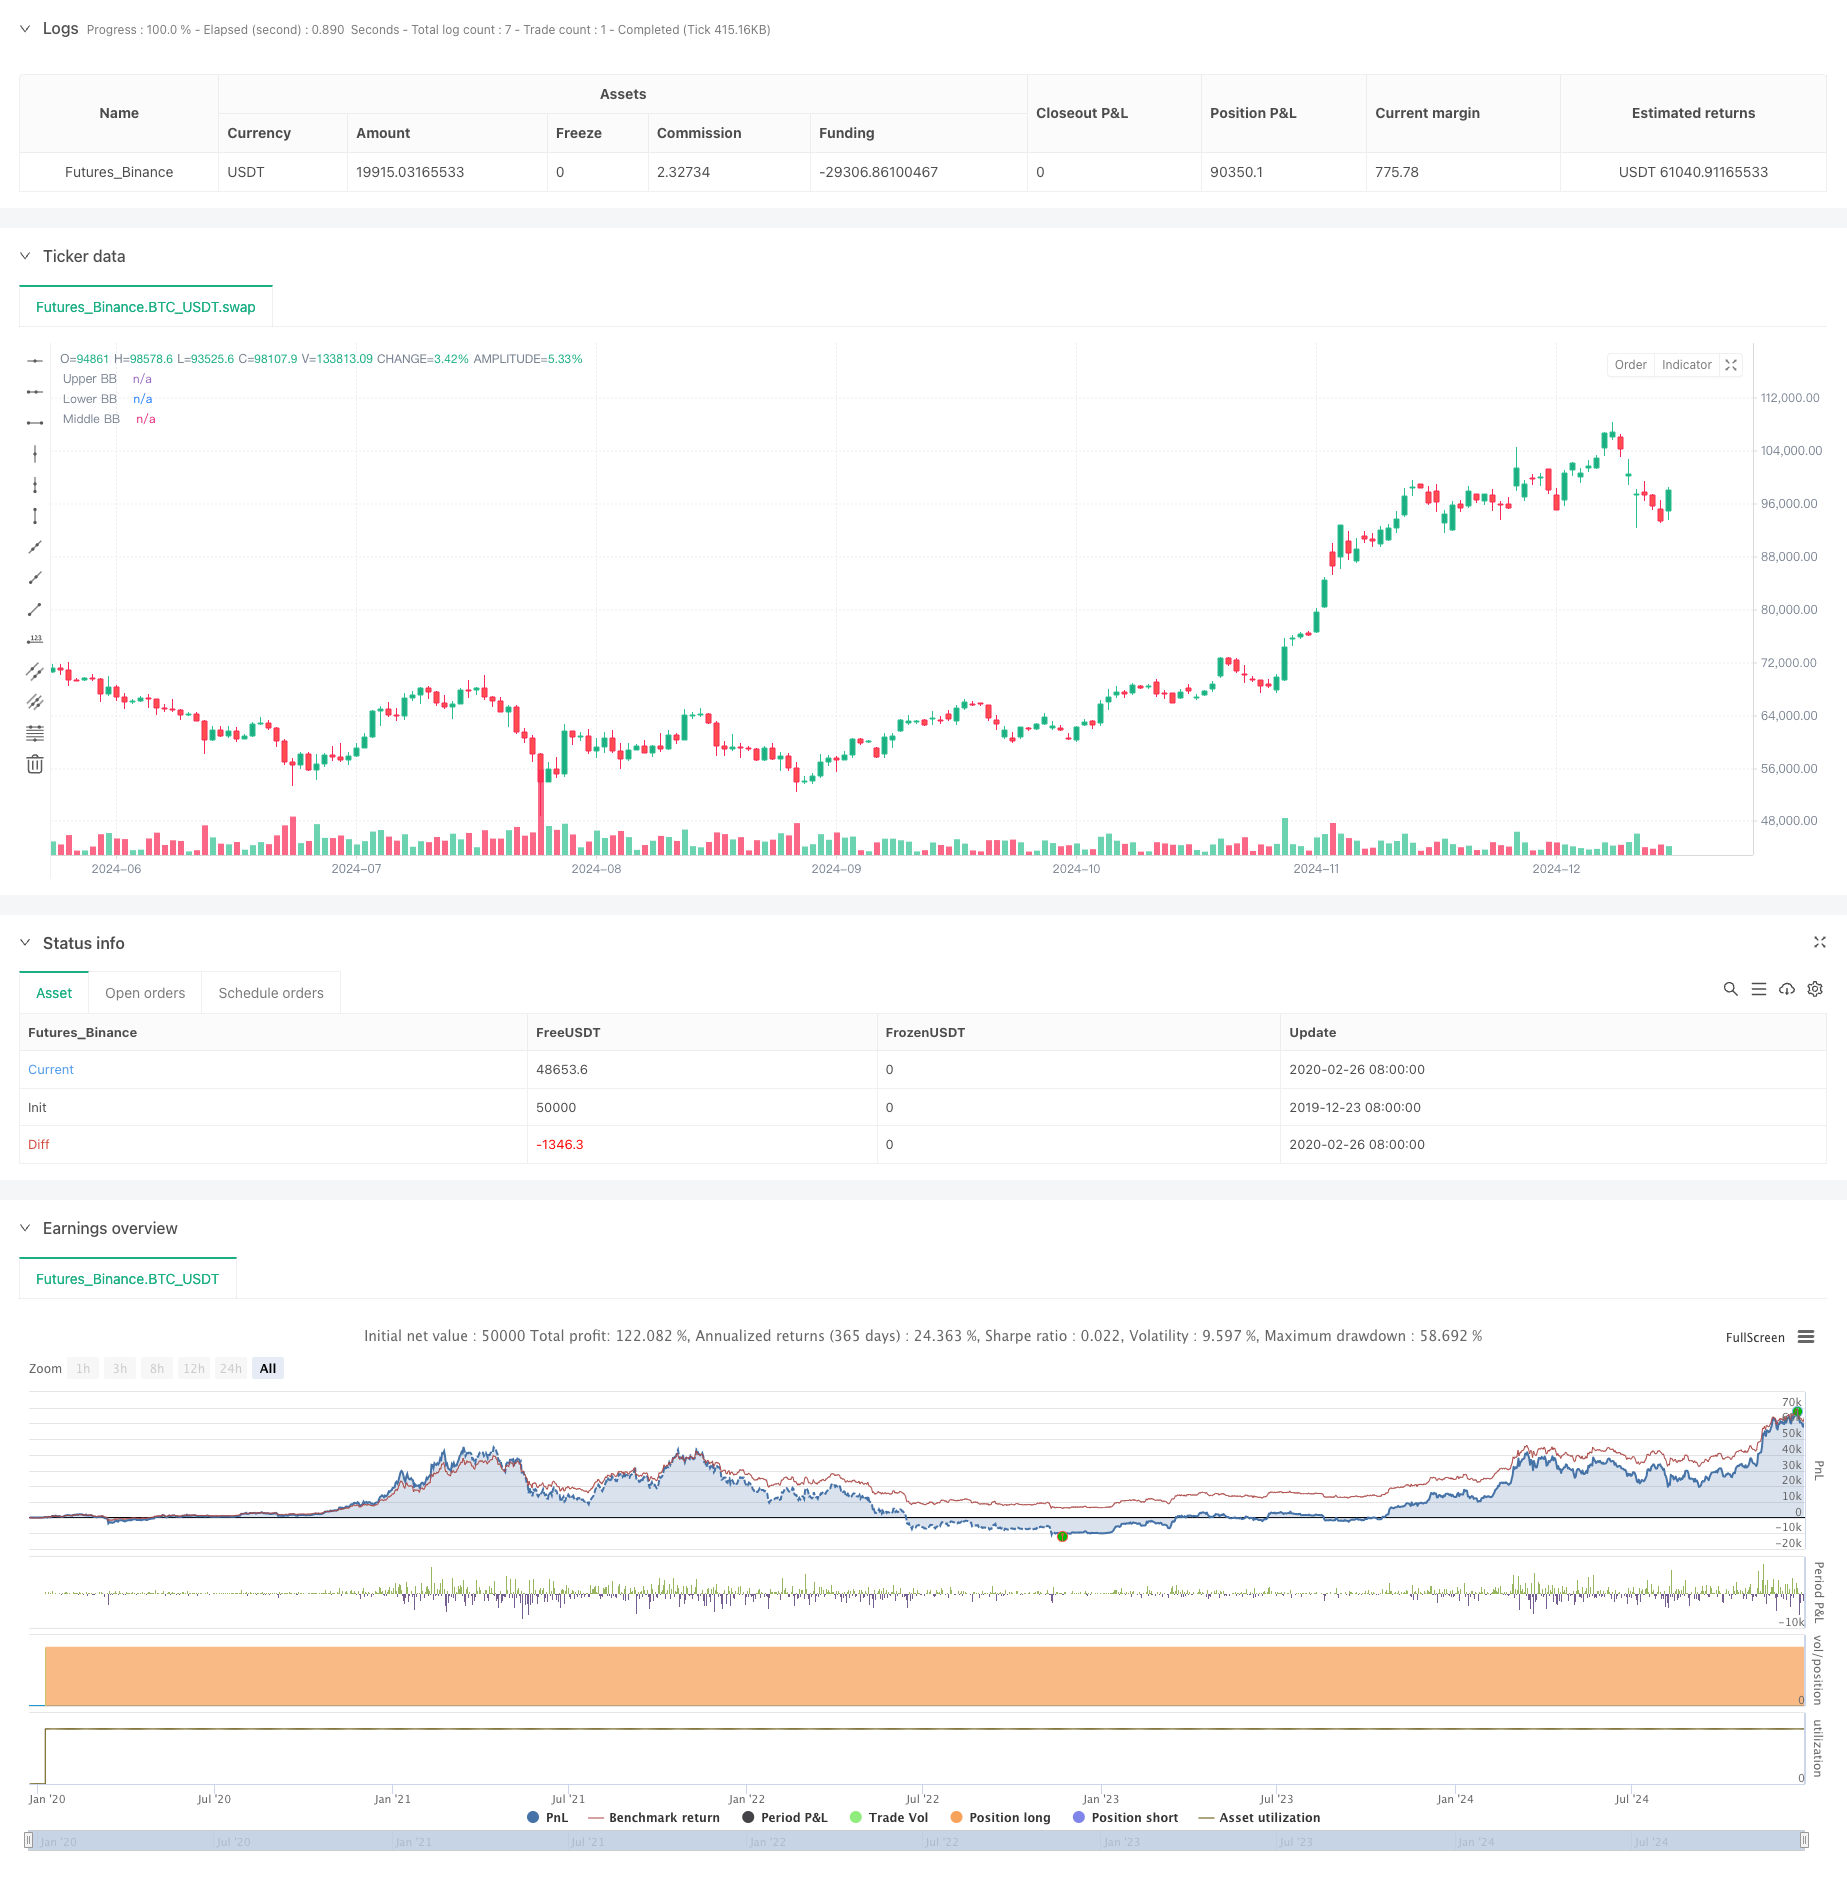
볼링거 밴드 트렌드 디버전스 기반의 다단계 양적 거래 전략
저자:차오장, 날짜: 2024-12-27 15:52:41태그:BBEMASMAstdevBBDIV추세

전반적인 설명
이 전략은 볼링거 밴드 트렌드 디버전스 및 동적 대역폭 변화에 기반한 다단계 양적 거래 시스템이다. 이 전략은 볼링거 밴드 너비 역동성, 가격 브레이크오웃 및 EMA200 조율을 모니터링하여 완전한 거래 결정 프레임워크를 구축합니다. 적응성 변동성 추적 메커니즘을 사용하여 시장 트렌드 전환점을 효과적으로 파악합니다.
전략 원칙
이 전략은 다음의 핵심 요소에 기초합니다.
- 20주기 이동평균과 2개의 표준편차를 사용하여 볼링거 밴드 계산
- 3개의 연속적인 시점에서의 대역폭 변화를 통해 트렌드 강도를 결정하는 것
- 촛불 몸과 대역폭 비율을 사용하여 브레이크아웃 검증
- 중장기 트렌드 필터로서의 EMA200
- 폭이 넓어지는 조건으로 가격이 상단 범위를 넘을 때 긴 진입
- 가격이 팽창폭이 줄어든 상태에서 하위 범위를 넘어설 때 출구
전략적 장점
- 잠재적인 트렌드 전환점을 식별하는 미래 지향 신호 시스템
- 여러 가지 기술 지표의 교차 검증은 잘못된 신호를 줄여줍니다.
- 대역폭 변화율 지표는 시장 변동성에 잘 적응합니다.
- 명확한 입력 및 출력 논리, 프로그래밍으로 구현하기 쉬운
- 종합적인 위험 관리 메커니즘으로 인출을 효과적으로 통제합니다.
전략 위험
- 다양한 시장에서 빈번한 거래를 생성 할 수 있습니다.
- 급격한 트렌드 변화로 인한 잠재적인 지연
- 매개 변수 최적화는 과도한 적합성 위험이 있습니다
- 높은 시장 변동성 기간 동안 미끄러짐 위험
- 대역폭 지표의 효과를 지속적으로 모니터링해야 합니다.
전략 최적화 방향
- 적응적 매개 변수 최적화 메커니즘을 도입
- 부피 및 유효성 확인을 위한 다른 보조 지표를 추가합니다.
- 스톱 로스 및 영업 조건 최적화
- 추세 강도를 평가하는 양적 기준을 개선
- 추가 시장 환경 필터를 포함
요약
이 전략은 볼링거 밴드 트렌드 디버전스와 동적 대역폭 변화를 통해 견고한 거래 시스템을 구축합니다. 트렌딩 시장에서 우수한 성과를 거두는 동안, 시장 범위 및 매개 변수 최적화에 대한 개선이 필요합니다. 전반적으로 전략은 좋은 실용적 가치와 확장 공간을 보여줍니다.
/*backtest
start: 2019-12-23 08:00:00
end: 2024-12-25 08:00:00
period: 1d
basePeriod: 1d
exchanges: [{"eid":"Futures_Binance","currency":"BTC_USDT"}]
*/

//@version=6
strategy("BBDIV_Strategy", overlay=true)

// Inputs for Bollinger Bands
length = input.int(20, title="BB Length")
mult = input.float(2.0, title="BB Multiplier")

// Calculate Bollinger Bands
basis = ta.sma(close, length)
deviation = mult * ta.stdev(close, length)
upperBB = basis + deviation
lowerBB = basis - deviation

// Calculate Bollinger Band width
bb_width = upperBB - lowerBB
prev_width = ta.valuewhen(not na(bb_width[1]), bb_width[1], 0)
prev_prev_width = ta.valuewhen(not na(bb_width[2]), bb_width[2], 0)

// Determine BB state
bb_state = bb_width > prev_width and prev_width > prev_prev_width ? 1 : bb_width < prev_width and prev_width < prev_prev_width ? -1 : 0

// Assign colors based on BB state
bb_color = bb_state == 1 ? color.green : bb_state == -1 ? color.red : color.gray

// Highlight candles closed outside BB
candle_size = high - low
highlight_color = (candle_size > bb_width / 2 and close > upperBB) ? color.new(color.green, 50) : (candle_size > bb_width / 2 and close < lowerBB) ? color.new(color.red, 50) : na

bgcolor(highlight_color, title="Highlight Candles")

// Plot Bollinger Bands
plot(upperBB, title="Upper BB", color=bb_color, linewidth=2, style=plot.style_line)
plot(lowerBB, title="Lower BB", color=bb_color, linewidth=2, style=plot.style_line)
plot(basis, title="Middle BB", color=color.blue, linewidth=1, style=plot.style_line)

// Calculate EMA 200
ema200 = ta.ema(close, 200)

// Plot EMA 200
plot(ema200, title="EMA 200", color=color.orange, linewidth=2, style=plot.style_line)

// Strategy logic
enter_long = highlight_color == color.new(color.green, 50)
exit_long = highlight_color == color.new(color.red, 50)

if (enter_long)
    strategy.entry("Buy", strategy.long)

if (exit_long)
    strategy.close("Buy")

// Display profit at close
if (exit_long)
    var float entry_price = na
    var float close_price = na
    var float profit = na

    if (strategy.opentrades > 0)
        entry_price := strategy.opentrades.entry_price(strategy.opentrades - 1)
        close_price := close
        profit := (close_price - entry_price) * 100 / entry_price * 2 * 10 // Assuming 1 pip = 0.01 for XAUUSD
        label.new(bar_index, high + (candle_size * 2), str.tostring(profit, format.mintick) + " USD", style=label.style_label_up, color=color.green)
관련
- 강화된 볼링거 평균 역전 양적 전략
- 볼링거 밴드 모멘텀 브레이크업 적응 트렌드 전략
- 볼링거 밴드 및 기하급수적인 이동 평균 크로스오버 거래 전략
- 볼링거 밴드 브레이크업 전략
- 볼링거 밴드 정확한 진입 및 위험 관리 전략
- 볼링거 밴드 브레이크업 전략
- 슬라이프 및 가격 영향 결합 전략과 볼링거 밴드 크로스오버
- 평균 반전 볼링거 밴드 달러-비용 평균화 투자 전략
- MACD BB 브레이크업 전략
- 볼링거 밴드 및 EMA 트렌드 다음 전략
더 많은
- 멀티테크니컬 인디케이터 시너지 거래 시스템
- 다기술 지표 기반의 고주파 동적 최적화 전략
- 삼중 슈퍼트렌드 및 계수적인 이동 평균 트렌드 양적 거래 전략을 따르는
- 클라우드 기반 볼링거 대역 두 배 이동 평균 양적 경향 전략
- 피보나치 0.7 레벨 트렌드 돌파를 기반으로 한 양적 거래 전략
- 여러 기간 프랙탈 브레이크 오더 블록 적응 거래 전략
- 이동평균 크로스오버에 기반한 리스크/어워드 비율 최적화 전략
- 동적 트렌드 인식 거래 전략을 따르는 적응 트렌드
- 보린저 대역을 기반으로 한 국경 간 동적 범위 양적 거래 전략
- 모멘텀 기반 SMI 크로스오버 신호 적응 예측 전략
- 다중 이동 평균 크로스오버 신호 강화 거래 전략
- 볼링거 반드와 우디스 CCI를 이용한 다중 지표 필터링 거래 전략
- 동적 이동 평균 트렌드를 RSI 확인 거래 전략으로 따라
- 풀백 최적화 시스템과 동적 다 기간 기하급수적 이동 평균 크로스 전략